The Vulcanization Accelerators Market is estimated to be valued at USD 1.9 billion in 2025 and is projected to reach USD 3.0 billion by 2035, registering a compound annual growth rate (CAGR) of 4.3% over the forecast period.
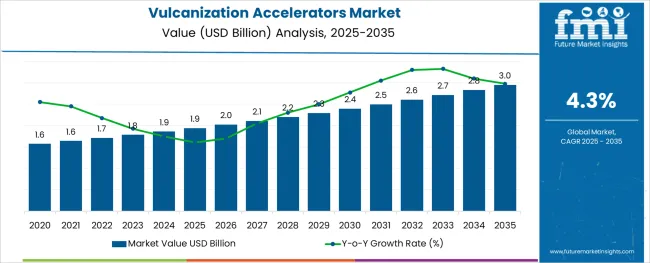
The vulcanization accelerators market is progressing steadily, driven by increased demand from the automotive sector and growing production of rubber products globally. Improvements in accelerator formulations have enhanced the efficiency and quality of rubber vulcanization, making the process faster and more controlled.
The automotive industry remains a major consumer due to the need for durable tires and rubber components that can withstand high performance and safety standards. Regulatory emphasis on improving product safety and environmental compliance has encouraged the adoption of advanced accelerators that reduce harmful emissions during production.
Technological innovations have also contributed to the development of more effective and less toxic accelerators. As the automotive sector expands and the use of rubber products diversifies into other industries, the market is expected to grow further. Growth is likely to be driven by the Thiozoles product type and automotive applications, reflecting their critical role in high-quality vulcanization processes.
The market is segmented by Product Type and Application and region. By Product Type, the market is divided into Thiozoles, Sulfanamides, Dithiocarbamates, Thiuram, and Others. In terms of Application, the market is classified into Automotive, Industrial, Medical, and Consumer Goods.
Regionally, the market is classified into North America, Latin America, Western Europe, Eastern Europe, Balkan & Baltic Countries, Russia & Belarus, Central Asia, East Asia, South Asia & Pacific, and the Middle East & Africa.
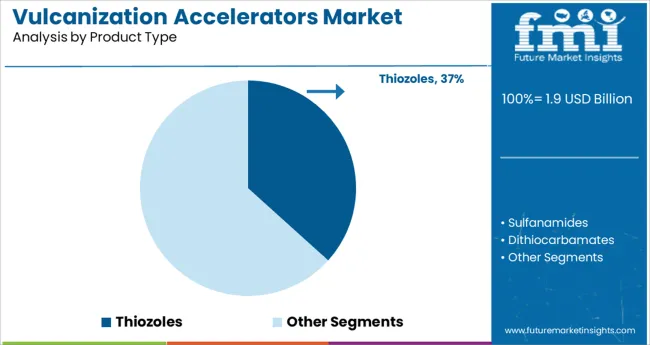
The Thiozoles segment is projected to hold 36.7% of the vulcanization accelerators market revenue in 2025, retaining its position as the leading product type. This segment’s growth is attributed to the superior acceleration effect and enhanced processing safety offered by thiozole-based accelerators. These compounds facilitate rapid vulcanization and improved physical properties of rubber, making them preferred choices in high-performance applications.
Their ability to deliver consistent cross-linking in various rubber formulations has increased their adoption among manufacturers. Furthermore, regulatory trends favoring safer chemical profiles have supported the demand for thiozole accelerators over other traditional compounds.
As product performance and safety standards continue to rise, the Thiozoles segment is expected to maintain its leadership position.
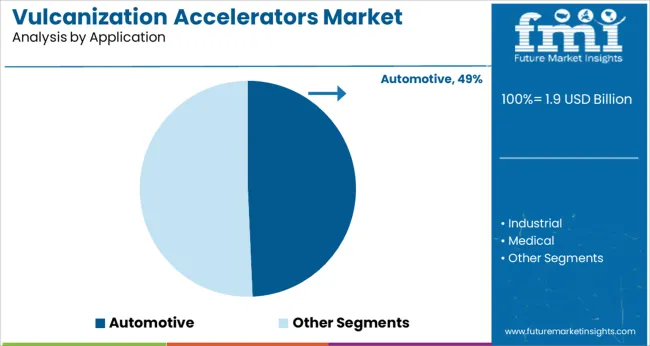
The Automotive segment is anticipated to account for 49.3% of the vulcanization accelerators market revenue in 2025, making it the dominant application sector. Growth in this segment has been driven by the expansion of the automotive industry worldwide, with increasing vehicle production and demand for durable rubber components.
The need for high-quality tires and automotive parts that meet rigorous safety and performance criteria has underscored the importance of effective vulcanization processes. Automotive manufacturers have increasingly adopted advanced accelerators to enhance the durability and longevity of rubber components used in tires, seals, hoses, and belts.
Additionally, evolving regulations around vehicle safety and emissions have encouraged the use of more efficient and environmentally friendly vulcanization technologies. As the automotive sector continues to grow and innovate, the demand for vulcanization accelerators in this application is expected to remain strong.
| Market Statistics | Details |
|---|---|
| H1,2024 (A) | 4.2% |
| H1,2025 Projected (P) | 4.3% |
| H1,2025 Outlook (O) | 4.0% |
| BPS Change : H1,2025 (O) - H1,2025 (P) | (-) 30 ↓ |
| BPS Change : H1,2025 (O) - H1,2024 (A) | (-) 20 ↓ |
The bps values recorded in the vulcanization accelerators market in H1, 2025 - Outlook over H1, 2025 Projected represent a reduction of 30 units, according to FMI analysis. Additionally, the market is anticipated to fall another 20 BPS in H1-2025 compared to H1 2024.
Growing health concerns and rising awareness of commodity composition among end users are the key factors behind the market's downfallet. Vulcanization accelerators are slightly toxic, and with the presence or development of less toxic alternatives to the product, demand is likely to be hampered compared to previous years.
Further, the rise in the price of commodity products and ongoing geopolitical tensions are also impacting the market's growth.
Future Market Insights anticipates a comparison and review analysis of the market dynamics for vulcanization accelerators, which is primarily influenced by several industry-specific factors and a few distinct influences regarding therapeutic strategies that foster industry innovation.
One of the most recent innovations in the industry is the continuous research and development of low-cost, highly effective, and less harmful vulcanization accelerators.
However, despite various challenges in the market, demand for vulcanization accelerators is expected to witness moderate growth with expanding industrial activity, rising vehicle production, and rising medical spending in developed and developing nations.
Additionally, growing tire production capacity and an abundance of inexpensive raw materials in developing nations like China, India, and ASEAN are anticipated to fuel the growth of the vulcanization accelerators market during the projected year.
Increasing industrial activity, growing automobile output, and rising medical expenditure in established and developing economies will likely boost demand for vulcanization accelerators throughout the forecast period. Furthermore, rising tire manufacturing capacity and plentiful low-cost raw material availability in developing countries such as China, India, and ASEAN countries are expected to propel the vulcanization accelerators market forward throughout the forecast period. However, developing high-performance tires in developed economies will result in moderate market growth.
The market is expected to witness attractive growth opportunities in the near future owing to its higher consumption in the automotive & medical industries, which is anticipated to boost the demand for Vulcanization Accelerators.
Vulcanization accelerators are essential in the automobile sector since they produce tires, wiper blades, engine mounts, seals, hoses, and belts. Due to the easy availability of a wide range of products at a fair price point, individual customers are increasing their spending on tire replacement, consumer goods, and medical treatments.
The market is predicted to rapidly increase, particularly in India and China, driving global demand for automotive (passenger cars). The number of vehicles in use has risen in tandem with the growth in vehicle production. This has a direct impact on the aftermarket automotive maintenance and repair industry.
The growing fleet of midsize and compact automobiles is expected to benefit the Vulcanization Accelerators market, as each vehicle will be equipped with rubber-based auxiliary parts and tires.
Tire production is continuously increasing due to rising automobile sales and aftermarket operations. Tire manufacturing uses Vulcanization accelerators to expedite processes and improve tier properties. They also favorably impact the operating rate by boosting the rate of reaction.
As a result, rising tire usage is propelling the vulcanization accelerator market forward. Increasing consumption of the compound in the automotive segment is anticipated to boost demand in the near future, which is expected to reach about USD 2,301.6 million by the year 2035.
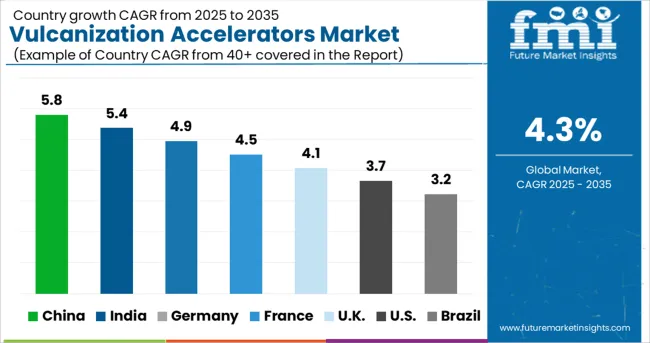
The market is expected to gain traction at 3.2% CAGR between 2025 and 2035. Russia is expected to dominate the European market in the forecast period for the Eastern Europe region.
The European market for Vulcanization Accelerators is predicted to grow moderately. The growing demand for green tires in the region due to labeling initiatives is expected to boost market growth in the coming years. Western Europe has reached market saturation, whereas Eastern Europe is expected to make a considerable contribution to regional market growth.
Due to increased tire production and tire replacement activities in the region, Russia is predicted to fuel the growth of the Europe Vulcanization Accelerators Market. Apart from that, European countries are seeing an increase in car production and aftermarket operations. The need for high-performance materials will rise as the use of high-performance tires rises.
China is projected to reach an estimated value of USD 661.4 Million by the end of 2035. In the overall market of Vulcanization Accelerators, China is the leading producer & consumer of Vulcanization Accelerators owing to the presence of the key players. In recent years, China's auto sector has experienced substantial expansion.
Tire production in China is increasing steadily. However, fluctuating raw material prices caused by trade disputes and material overstock harm local manufacturers. Furthermore, enforcing strict rules on tire exports from European countries and the United States is projected to exacerbate tire makers' troubles.
China and Japan are two of the world's largest tire producers. As the population, standard of living, and manufacturing of electric vehicles rise in East Asia, the need for tires will rise, positively impacting the East Asian Vulcanization Accelerators Market.
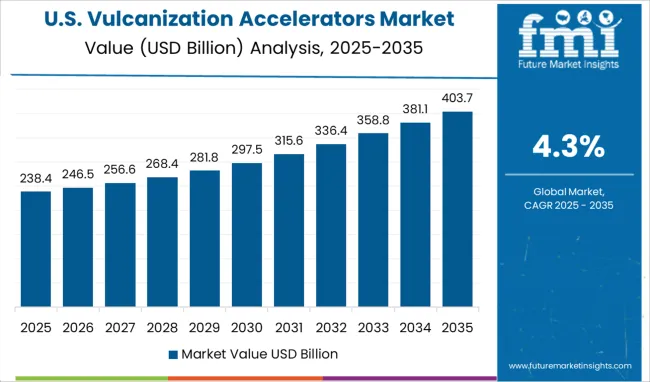
As per FMI, the USA is projected to account for a significant share of the global Vulcanization Accelerators market. The demand for vulcanization accelerators is increasing due to the existence of major tire manufacturers such as Bridgestone, Goodyear, Michelin, Continental, and Pirelli. On the other hand, increased tire imports from Chinese producers are slowing tire output in North America.
The growing fleet size of passenger cars, light trucks, and heavy trucks is driving up demand for replacement tires.
This will directly influence the market for Vulcanization Accelerators. Growth, on the other hand, is predicted to be moderate and consistent. The domination of industrial operations and rising medical and healthcare expenditures, on the other hand, will have a beneficial impact on the market's growth.
The rising need for vulcanization accelerators drives up demand for industrial and medical rubber goods. Despite the United States' dominance, Canada is predicted to overtake the United States in the next few years due to expanding opportunities in the medical sector and custom industrial component design. The USA is expected to reach about USD 3 million by 2035.
The medical industry is expected to grow at a prominent value of 4.3% CAGR from 2025 to 2035.
Tubes, surgical gloves, condoms, breathing bags, cushioning or supporting materials, prostheses, catheters, and implants are just a few examples of medical items that use vulcanization accelerators. The global Vulcanization Accelerators market should benefit from rising healthcare spending.
Due to changing lifestyles, more health awareness, and changing environmental circumstances, medical and healthcare spending has increased significantly in recent years. In the not-too-distant future, government healthcare spending as a percentage of GDP is expected to climb.
As a result, demand for medical rubber goods is expected to increase. Over the projected period, the market is expected to rise due to the increasing use of vulcanization accelerators in manufacturing medical rubber products. Medical-grade rubber products are also in high demand due to a growth in cardiac problems, pediatrics, and the need for vital life-saving surgeries.
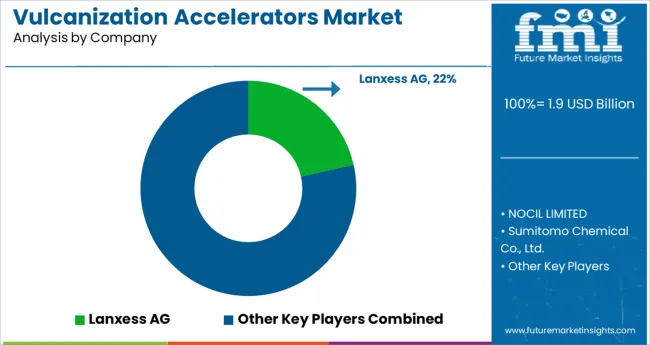
Over the past few years, manufacturers have shifted their focus toward emerging regions to meet the increasing demand for Vulcanization Accelerators. Several key players are also focusing on expanding their production capacities, launching new products, conducting Research and Development, and increasing mergers and acquisition activities.
For Instance:
The latest study by Future Market Insights covers all the strategies and success factors of key market manufacturers.
The list is not exhaustive and is only for representational purposes. Full competitive intelligence with SWOT analysis is available in the report.
| Attribute | Details |
|---|---|
| Forecast Period | 2025 to 2035 |
| Historical Data Available for | 2014 to 2024 |
| Market Analysis | million for Value and Tons for Volume |
| Key Regions Covered | North America; Latin America; Europe; South Asia; East Asia; Oceania; Middle East & Africa. |
| Key Countries Covered | USA, Canada, Germany, United Kingdom, France, Italy, Spain, Russia, BENELUX, China, Japan, India, ASEAN, Oceania, South Korea, Australia, New Zealand, Brazil, Mexico, GCC Countries, South Africa, Turkey |
| Key Segments Covered | Product Type, Application, and Region |
| Key Companies Profiled | Lanxess AG; NOCIL LIMITED; Sumitomo Chemical Co., Ltd.; Arkema; Eastman Chemical Corporation; KUMHO PETROCHEMICAL; Emerald Performance Materials; King Industries, Inc.; Duslo, a.s; Jing Xian Yuelong Metal Rubber Products; Co., Ltd.; Willing New Materials Technology Co. Ltd.; Shandong Stair Chemical & Technology Co., Ltd.; Shandong Yanggu Huatai Chemical Co., Ltd.; Kemai Chemical Co., Ltd. |
| Report Coverage | Market Forecast, Company Share Analysis, Competition Intelligence, Drivers, Restraints, Opportunities and Threats Analysis, Market Dynamics and Challenges, and Strategic Growth Initiatives |
| Customization & Pricing | Available upon Request |
The global vulcanization accelerators market is estimated to be valued at USD 1.9 billion in 2025.
It is projected to reach USD 3.0 billion by 2035.
The market is expected to grow at a 4.3% CAGR between 2025 and 2035.
The key product types are thiozoles, sulfanamides, dithiocarbamates, thiuram and others.
automotive segment is expected to dominate with a 49.3% industry share in 2025.


Our Research Products

The "Full Research Suite" delivers actionable market intel, deep dives on markets or technologies, so clients act faster, cut risk, and unlock growth.

The Leaderboard benchmarks and ranks top vendors, classifying them as Established Leaders, Leading Challengers, or Disruptors & Challengers.

Locates where complements amplify value and substitutes erode it, forecasting net impact by horizon

We deliver granular, decision-grade intel: market sizing, 5-year forecasts, pricing, adoption, usage, revenue, and operational KPIs—plus competitor tracking, regulation, and value chains—across 60 countries broadly.

Spot the shifts before they hit your P&L. We track inflection points, adoption curves, pricing moves, and ecosystem plays to show where demand is heading, why it is changing, and what to do next across high-growth markets and disruptive tech

Real-time reads of user behavior. We track shifting priorities, perceptions of today’s and next-gen services, and provider experience, then pace how fast tech moves from trial to adoption, blending buyer, consumer, and channel inputs with social signals (#WhySwitch, #UX).

Partner with our analyst team to build a custom report designed around your business priorities. From analysing market trends to assessing competitors or crafting bespoke datasets, we tailor insights to your needs.
Supplier Intelligence
Discovery & Profiling
Capacity & Footprint
Performance & Risk
Compliance & Governance
Commercial Readiness
Who Supplies Whom
Scorecards & Shortlists
Playbooks & Docs
Category Intelligence
Definition & Scope
Demand & Use Cases
Cost Drivers
Market Structure
Supply Chain Map
Trade & Policy
Operating Norms
Deliverables
Buyer Intelligence
Account Basics
Spend & Scope
Procurement Model
Vendor Requirements
Terms & Policies
Entry Strategy
Pain Points & Triggers
Outputs
Pricing Analysis
Benchmarks
Trends
Should-Cost
Indexation
Landed Cost
Commercial Terms
Deliverables
Brand Analysis
Positioning & Value Prop
Share & Presence
Customer Evidence
Go-to-Market
Digital & Reputation
Compliance & Trust
KPIs & Gaps
Outputs
Full Research Suite comprises of:
Market outlook & trends analysis
Interviews & case studies
Strategic recommendations
Vendor profiles & capabilities analysis
5-year forecasts
8 regions and 60+ country-level data splits
Market segment data splits
12 months of continuous data updates
DELIVERED AS:
PDF EXCEL ONLINE
Devulcanization Machine Market Analysis - Size, Share, and Forecast Outlook 2025 to 2035
Concrete Accelerators And Retarders Market Size and Share Forecast Outlook 2025 to 2035
Shotcrete Accelerators Market

Thank you!
You will receive an email from our Business Development Manager. Please be sure to check your SPAM/JUNK folder too.
Chat With
MaRIA