
- Market Size (2026)
- USD 10.5 Bn
- Forecast (2036)
- USD 14.0 Bn
- CAGR (2026 to 2036)
- 2.9%
How big is Wiper Blade Market in 2026?
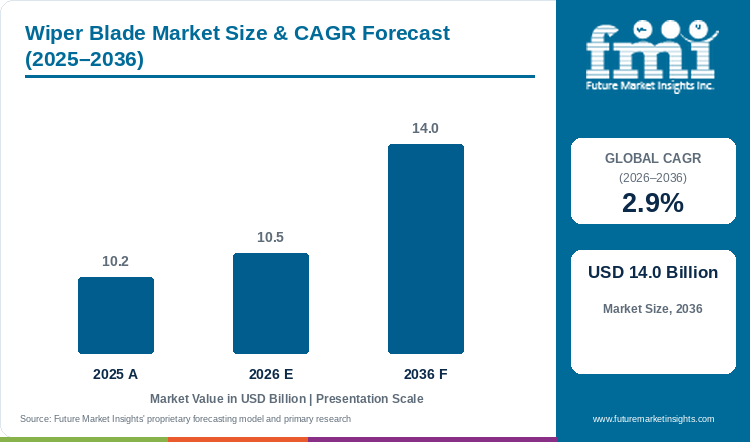
Wiper blades will record a 2.9% CAGR over the 2026 to 2036 window. Sales stood at USD 10.2 billion in 2025. 2026 brings an estimated USD 10.5 billion, and 2036 a projected USD 14.0 billion.
Wiper blade sales reach an estimated USD 10.5 billion in 2026, up from USD 10.2 billion in 2025. In FMI estimates, the market will grow at a 2.9% CAGR over the next decade and reach USD 14.0 billion by 2036.
Blades wipe glass from the automotive glass market, on a 5.7% CAGR from 2026 to 2036. A bigger windshield still gets one blade set, so flat new-car output holds blades at 2.9%. Driverless shuttles clear sensors with heated defoggers instead of blades, and the autonomous shuttle 360-degree visibility defogger systems market posts an 18.2% CAGR over the same years, though a USD 29.0 million base keeps blade losses small before 2036.
Blade volume comes from replacement, and the aftermarket takes an estimated 63.5% of 2026 sales. UK motorists are holding on to vehicles for longer amid cost-of-living pressures, SMMT said in April 2026, and the average car on UK roads reached 9.7 years of age in 2025. A car kept one more year therefore needs another set of blades.
The frontiers of industry growth are shifting to aftermarket counters as UK and Brazilian cars age. Older-car owners will trade up to flat blades, which carry 49% of 2026 sales. However, price will test the flat-blade upgrade, since a budget-minded owner compares cost per pair first.
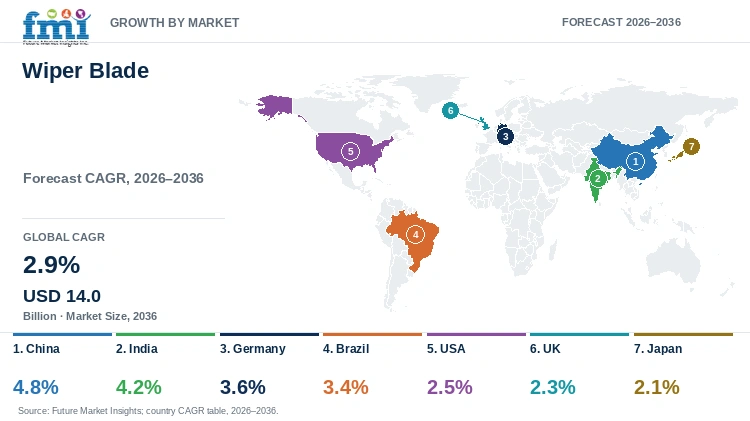
Chinese sales post a 4.8% CAGR and India 4.2%, and Japan is slowest at 2.1% as new-car flow stays flat.
Key Market Trends & Insights
- Blade type: flat blade systems carry 49% of 2026 sales, conventional systems 30% and hybrid systems 21%.
- Application: windshield wipers account for 64%, and rear wipers for 36%.
- Vehicle type: passenger cars hold 60% and light commercial vehicles 20%. Indian passenger vehicle wholesales rose 7.9% to 4,643,439 units in FY26, SIAM data showed.
- Sales channel: the aftermarket takes an estimated 63.5%, and original equipment fitment about 36.5%.
Regional Highlights
- Chinese blade sales post the quickest country CAGR, 4.8% from 2026 to 2036.
- India follows on a 4.2% CAGR, Germany on 3.6% and Brazil on 3.4% over the same years. The USA (2.5%) and the UK (2.3%) run below the global CAGR, and Japan is lowest at 2.1%.
- China had 366 million automobiles on the road at the end of 2025, Gasgoo reported from Ministry of Public Security data.
Market Size & Forecast
Table 1: Market Size and Forecast for the Wiper Blade Market (USD billion and percentage), 2025 to 2036
| Metric | Value |
|---|---|
| 2025 Market Size | USD 10.2 billion |
| Estimated Market Size in 2026 | USD 10.5 billion |
| Projected Market Size by 2036 | USD 14.0 billion |
| CAGR, 2026 to 2036 | 2.9% |
| Added Revenue, 2026 to 2036 | USD 3.5 billion |
| Market Expansion Multiple | 1.3x |
Wiper blades share the windshield parts aisle with motors and washer systems. FMI data cover the motor behind each blade arm in the automotive wiper motor market. Washer pumps and nozzles spray the glass that each blade clears, and automotive washer system demand in Japan reaches the same dealer service bays. Japan posts the lowest blade CAGR in the table at 2.1% from 2026 to 2036, so Japanese dealers will sell blade sets alongside washer repairs at each shaken inspection. Wiper blades as a whole record a 2.9% CAGR over the same years. Motors will last for years and blades will wear out, so blade sales will lean harder on the aftermarket than motor sales do.
Car Parc Age and the Blade Replacement Cycle
Car fleets in the UK, Brazil and Germany kept growing and getting older through 2025. The UK car parc reached 36,676,185 cars, and the average age rose to 9.7 years from 9.5 years in 2024, SMMT reported. Sindipeças put the average age of the Brazilian fleet at 11 years in 2025, with automobiles at 11 years and 5 months, Vrum reported in July 2026. Germany counted about 49.5 million registered cars on 1 January 2026, the highest ever recorded, Destatis said. China ended 2025 with 366 million automobiles on the road, 78% of the motor vehicle total.
Aftermarket results at O'Reilly and Valeo rose with the older fleets. O'Reilly Automotive reported second-quarter 2026 comparable store sales growth of 6.0%, with solid growth in both professional and DIY business. Valeo aftermarket sales for January to June 2026 rose 2.1% like for like, helped by North America, Asia and new services for distributors. Original equipment sales at Valeo fell 0.6% like for like in the first half of 2026. Valeo and other blade makers will steer more launches and shelf space to retail and workshop channels, and fitment contracts with carmakers will grow slowly.
Table 2: Car Parc Age and Aftermarket Indicators for the Wiper Blade Market (years, units, percentage and EUR), mixed reporting years from 2025 to 2026
| Indicator | Data Point | Relevance | Source |
|---|---|---|---|
| UK average car age, 2025 | 9.7 years, up from 9.5 | Older cars need more blade changes. | |
| UK cars over 10 years old, 2025 | 45.7% | A large base of cars past the first ownership cycle. | |
| Brazil fleet average age, 2025 | 11 years; automobiles 11 years and 5 months | Ageing fleet in a fast-growing country. | |
| Brazil circulating fleet, 2025 | About 48.8 million motor vehicles | Size of the Brazilian replacement base. | |
| Germany registered cars, 1 January 2026 | About 49.5 million, highest ever | Record German car stock for blade replacement. | |
| China automobiles in use, end 2025 | 366 million | Scale of the Chinese replacement base. | |
| O'Reilly comparable store sales, Q2 2026 | Up 6.0% | US retail and workshop channel demand. | |
| Valeo aftermarket sales, H1 2026 | €1,102 million, up 2.1% like for like | Supplier aftermarket growth against flat OE. |
Analyst Perspective
“Cars are staying on the road longer in the UK, Brazil and Germany, and I expect that ageing parc to turn into steady repeat demand for flat blades sold through retail and workshop counters. The suppliers that pair a wide fit range with fast distributor service will capture the trade-up from conventional frames over the next ten years.”
- Nikhil Kaitwade, Principal Consultant, Future Market Insights.
How is the Wiper Blade Market segmented?
Blade type, application, vehicle type and sales channel make up the four product cuts, with region alongside. Flat blades lead blade type at 49%, windshield wipers lead application at 64%, passenger cars lead vehicle type at 60% and the aftermarket leads sales channel at an estimated 63.5%.
By blade type: flat blade systems, conventional blade systems, and hybrid blade systems.
By application: windshield wipers and rear wipers.
By vehicle type: light and heavy commercial vehicles, and passenger cars.
By sales channel: aftermarket and original equipment manufacturer (OEM).
By region, five blocks: Europe (with Germany, the UK, France, Italy, Spain, the Nordic countries and BENELUX), Latin America, North America, Middle East and Africa, and Asia Pacific.
Why do flat blade systems lead blade type sales?
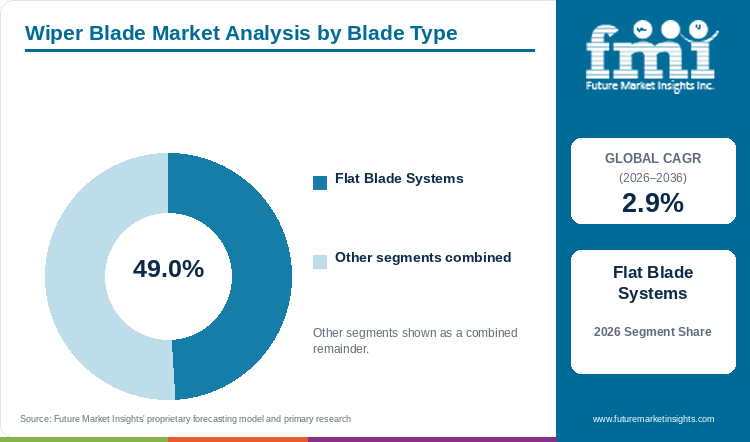
Flat blade systems hold a 49% blade type share in 2026, conventional systems 30% and hybrid systems 21%.
Table 3: Blade Type Share for the Wiper Blade Market (percentage share), 2026
| Blade Type | Estimated Share (2026) |
|---|---|
| Flat Blade Systems | 49% |
| Conventional Blade Systems | 30% |
| Hybrid Blade Systems | 21% |
| Total | 100.0% |
Table 4: Blade Type Leadership and Market Growth for the Wiper Blade Market (segment and CAGR percentage), 2026 to 2036
| Metric | Value |
|---|---|
| Global CAGR (2026 to 2036) | 2.9% |
| Leading Segment | Flat Blade Systems |
Flat systems take 49% in the FMI blade type split, conventional frames 30% and hybrid designs 21%. Flat designs will hold the lead through 2036 as owners replace like for like. Snow and ice will favour frameless blades in Germany and the Nordic countries. Conventional frames will stay the low-price pick for older cars and budget buyers. Hybrid blades will gain on Japanese and Korean models. Suppliers in the automotive wiper blade market will keep flat designs at the centre of new ranges.
- Flat blades will gain share at each replacement as older conventional fitments leave the parc.
- Conventional frames will hold value-tier shelf space in Brazil and India.
Why do windshield wipers lead application sales?
Windshield wipers claim 64% of the 2026 application split, against 36% for rear wipers.
Table 5: Application Share for the Wiper Blade Market (percentage share), 2026
| Application | Estimated Share (2026) |
|---|---|
| Windshield Wipers | 64% |
| Rear Wipers | 36% |
| Total | 100.0% |
Front glass will keep needing two arms on almost every car, and rear arms will stay limited to hatchbacks, estates and SUVs. Windshield wipers hold 64% of application sales against 36% for rear wipers. Drivers will notice a streaky front blade sooner, so front pairs will be replaced more often. SUV growth in India and China will widen the rear wiper base over the decade. Camera and sensor cleaning in the autonomous shuttle 360-degree visibility defogger systems market will add a separate visibility niche beyond blades.
- Rear wipers will gain with SUV and hatchback sales in India and China.
- Front blade pairs will keep the larger aftermarket ticket.
Why do passenger cars lead vehicle type sales?
For 2026, passenger cars represent 60% by vehicle type, light commercial vehicles 20% and heavy commercial vehicles an estimated 20%.
Table 6: Vehicle Type Share for the Wiper Blade Market (percentage share), 2026
| Vehicle Type | Estimated Share (2026) |
|---|---|
| Passenger Cars | 60% |
| Light Commercial Vehicles | 20% |
| Heavy Commercial Vehicles | 20% |
| Total | 100.0% |
Indian passenger vehicle wholesales reached 4,643,439 units in FY26, up 7.9%, Outlook Business reported from SIAM data in April 2026. Indian car volumes near 4.6 million keep passenger cars ahead, with 60% of vehicle type sales, FMI reports. Light commercial vehicles account for 20%. Heavy commercial vehicles take an estimated 20%, and fleet service schedules will set blade changes for trucks and buses. Car owners will stay the largest buyer group, and van fleets will grow with parcel delivery.
- Truck and bus fleets will buy heavy-duty blades through fleet service contracts.
- Total Indian automobile wholesales rose 10.4% to 28,265,519 units in FY26.
Why does the aftermarket lead sales channel sales?
The aftermarket handles an estimated 63.5% of sales channel volume in 2026, and OEM fitment about 36.5%.
Table 7: Sales Channel Share for the Wiper Blade Market (percentage share), 2026
| Sales Channel | Estimated Share (2026) |
|---|---|
| Aftermarket | 63.5% |
| Original Equipment Manufacturer (OEM) | 36.5% |
| Total | 100.0% |
A new car will leave the factory with one set of blades, and the owner will buy several more over the life of the car. Repeat blade buying by owners gives the aftermarket an estimated 63.5% of channel volume. OEM fitment holds about 36.5%. In the United States, aftermarket distribution handles about 65% of wiper blade sales, according to FMI. Valeo posted 2.1% like-for-like aftermarket growth for H1 2026 against a 0.6% like-for-like fall in original equipment. O'Reilly, other retail chains and online sellers will widen the 63.5% aftermarket lead.
- OEM volume will follow new vehicle output in China and India.
- O'Reilly operated 6,695 stores at 30 June 2026.
What are the drivers, restraints, and opportunities in the Wiper Blade Market?
Older car parcs, rising vehicle ownership in Asia and safety inspection rules drive growth of the wiper blade market. Sales of wiper blades meet headwinds from price-sensitive buyers, counterfeit products and weak new vehicle output.
- Driver: UK cars averaging 9.7 years and Brazilian cars averaging 11 years need more replacement blades.
- Restraint: Budget buyers and counterfeit blades cap average prices.
- Opportunity: Store networks and distributor services widen aftermarket reach.
Older Fleets Turn Into Repeat Blade Purchases
Ageing fleets drive repeat purchases, FMI finds. Sindipeças counted about 48.8 million motor vehicles in circulation in Brazil in 2025, with the fleet average age rising since 2014. Trucks averaged 12 years and 3 months, and buses 11 years and 3 months. Older Brazilian trucks and buses will carry more worn parts, and blade changes will come round each rainy season.
Price-Sensitive Buyers and Weak OE Output Hold Back Value
Discount blades and counterfeit packs pull down average prices on the retail shelf. Key challenges faced by manufacturers include buyers who choose on price alone and weak fitment volume. Valeo original equipment sales slipped 0.6% like for like from January to June 2026. Bosch, Valeo and Trico will defend shelf space with fit guides and multi-pack offers.
Store Growth and Distributor Services Open New Shelf Space
Store expansion is one of the supply-side forces shaping market growth, and parts chains will add shelf space for blades in new stores. Sales potential is expected to emerge from new stores, workshop supply and services for distributors. O'Reilly opened 110 net new stores across North America in the first half of 2026. Valeo credited part of the aftermarket gain to new services for distributors. Suppliers with full vehicle coverage will gain listings in the 110 new O'Reilly stores.
Which country CAGRs are profiled in the Wiper Blade Market?
Table 8: Country CAGR Comparison for the Wiper Blade Market (CAGR percentage), 2026 to 2036
| Country | CAGR |
|---|---|
| China | 4.8% |
| India | 4.2% |
| Germany | 3.6% |
| Brazil | 3.4% |
| USA | 2.5% |
| UK | 2.3% |
| Japan | 2.1% |
How do country-level CAGRs compare in the Wiper Blade Market?
Emerging car markets set the top of the country table. FMI puts China at a 4.8% CAGR and India at 4.2% from 2026 to 2036, both above the 2.9% global CAGR. Germany posts a 3.6% CAGR and Brazil 3.4%. The USA, the UK and Japan follow at 2.5%, 2.3% and 2.1%, below the global CAGR.
- China adds new cars to a parc of 366 million automobiles.
- India combines record vehicle sales with a young but growing fleet.
- Germany holds a record car stock of about 49.5 million.
- Brazil runs an old fleet with long service lives.
- The USA relies on a dense retail and workshop parts network.
- The UK car parc keeps ageing as owners delay renewal.
- Japan sold 4,565,777 new automobiles in 2025. Japan has the lowest CAGR of the seven profiled countries for 2026 to 2036, at 2.1%.
Full report country CAGRs cover: Europe and Asia Pacific, then North America, Latin America and the Middle East and Africa, with country detail for Canada, Mexico, France, Italy, Spain, South Korea, Australia and New Zealand, ASEAN, Argentina, Saudi Arabia, UAE, Turkey and South Africa.
Country-wise Analysis
China Wiper Blade Market Outlook (2026 to 2036)
With a 4.8% CAGR from 2026 to 2036, China posts the fastest growth among the seven profiled countries. The country registered 26.19 million new automobiles in 2025, Gasgoo reported from Ministry of Public Security data. The 26.19 million new registrations feed both fitment and, a few years later, replacement. Chinese domestic car brands will source blades from local suppliers, and online parts sales will speed up the replacement cycle in smaller cities.
Key takeaway: China pairs the largest new car flow with a parc of 366 million automobiles, so both OEM and aftermarket channels will grow.
India Wiper Blade Market Outlook (2026 to 2036)
Record wholesales set the base for Indian demand. Total automobile wholesales reached 28,265,519 units in FY26, up 10.4%, SIAM figures showed. Passenger vehicles rose 7.9% to 4,643,439 units. The Indian fleet will stay young for some years, so first replacement waves will arrive later in the decade. India posts a 4.2% CAGR from 2026 to 2036, and monsoon wear will set the timing of blade changes.
Key takeaway: Indian blade sales will move from OEM-led to replacement-led as the post-2020 car boom ages.
Germany Wiper Blade Market Outlook (2026 to 2036)
Destatis counted about 49.5 million registered cars in Germany on 1 January 2026, the highest number ever recorded. Car density reached 593 per 1,000 residents. A German CAGR of 3.6% for 2026 to 2036 leads the profiled European countries. Roadworthiness checks and winter driving will keep owners replacing worn blades on schedule.
Key takeaway: A record car stock gives Germany a deep and steady replacement pool.
Brazil Wiper Blade Market Outlook (2026 to 2036)
Brazil posts a 3.4% CAGR from 2026 to 2036. Automobiles in the national fleet averaged 11 years and 5 months in 2025, Sindipeças data showed, and the fleet has been ageing since 2014. Older cars in tropical rain and sun will wear blades fast. Value-tier conventional blades will keep a large shelf share in independent parts stores.
Key takeaway: Brazil combines heavy rain, strong sun and an old fleet, so replacement frequency will stay high.
USA Wiper Blade Market Outlook (2026 to 2036)
US parts retail at O'Reilly held up through 2026. O'Reilly grew professional revenue to $2,469,582 thousand and DIY revenue to $2,336,858 thousand in the second quarter of 2026. DIY buyers will fit blades in the store car park, and workshops will add them during service. American sales post a 2.5% CAGR from 2026 to 2036, below the global CAGR, and flat new car volumes will hold the rate down.
Key takeaway: Retail counters and service bays will carry American growth, with chains adding stores across North America.
UK Wiper Blade Market Outlook (2026 to 2036)
SMMT said high build quality supported by a vibrant aftermarket helped grow the UK car parc in 2025. The country had 42,549,649 vehicles on the road, up 1.4%. The UK posts a 2.3% CAGR over the forecast period. Garages will replace many worn sets at the annual MOT test.
Key takeaway: British demand will follow the MOT calendar and the growing share of cars over ten years old.
Japan Wiper Blade Market Outlook (2026 to 2036)
Japan records a 2.1% CAGR from 2026 to 2036, the lowest of the seven. New automobile sales in Japan rose 3.3% to 4,565,777 units in 2025, Jiji Press reported. Sales stayed below the pre-pandemic level of over 5 million units. A flat new car flow will keep Japanese blade demand tied to replacement. Dealer servicing and shaken inspections will keep blade changes on a fixed schedule. Hybrid blades will hold a strong place on Japanese models. Washer and wiper parts will move together, and the APAC wiper blade industry will draw more of the regional growth from China and India.
Key takeaway: Japanese blade sales will grow on premium replacement inside dealer service plans.
Who are the notable companies in the Wiper Blade Market?
Robert Bosch GmbH, Valeo SA, DENSO Corporation, Trico Products Corporation, FORVIA HELLA, DRiV , Mitsuba Corporation, PIAA Corporation, Continental AG, Marelli, Nippon Wiper Blade Co. Ltd. and Goodyear Tire & Rubber Company compete for OEM and replacement blade business.
Wiper blade supply is moderately concentrated. FMI counts 50 to 60 meaningful players in this market. Roughly 40% to 45% of sales goes to the three largest companies combined. Regional brands and private labels make up the long tail on retail shelves.
Valeo reported first-half 2026 aftermarket sales of €1,102 million, up 2.1% like for like. The group credited North America, Asia and new distributor services for the gain. Competitive advantage is changing shape, and suppliers with deep aftermarket catalogues will keep the edge over fitment-only rivals.
- Multi-line automotive suppliers: Robert Bosch GmbH, Valeo SA, DENSO Corporation, Continental AG, FORVIA HELLA, and Marelli
- Wiper and replacement brands: Trico Products Corporation, DRiV, Mitsuba Corporation, PIAA Corporation, Nippon Wiper Blade Co. Ltd., Goodyear Tire & Rubber Company, DOGA S.A., WEXCO Industries Inc., and Michelin Lifestyle Limited.
Competitive Benchmarking: Wiper Blade Market
Table 9: Competitive Benchmarking for the Wiper Blade Market (qualitative documentation ratings), 2026
| Company | Aftermarket Results | OE Results | Distribution Reach | Disclosure Depth |
|---|---|---|---|---|
| Valeo SA | High | High | Medium | High |
| Robert Bosch GmbH | Low | Low | Medium | Low |
| DENSO Corporation | Low | Low | Low | Low |
| Trico Products Corporation | Low | Low | Medium | Low |
| O'Reilly Automotive (channel) | High | Low | High | High |
Key Developments in the Wiper Blade Market
- In September 2026, Robert Bosch GmbH expanded its Aerotwin J.E.T-Blade program with additional set variants and wiper lengths for the global aftermarket. The Jet Evolution Technology integrates washer fluid delivery nozzles directly into the wiper blade, directing fluid precisely in front of the wiping edge and eliminating spray mist to improve windshield cleaning efficiency at speed [1].
- In April 2026, Robert Bosch GmbH marked 100 years of wiper blade innovation with a cross-country Route 66 journey highlighting advances in driver visibility and safety. The centennial initiative, designated an Official Route 66 Centennial Project, concluded with a special product announcement and reinforced Bosch’s commitment to continued development of wiper technologies for OEM and aftermarket channels across North America [2].
- In May 2025, Valeo SA extended its Valeo First flat blade wiper range, increasing global car parc coverage by an additional 5% through the launch of five new blade references. The extension was prompted by the introduction of new wiper arm designs by vehicle manufacturers requiring additional connector type compatibility, broadening the range’s fit across current vehicle generations [3].
Key Players in the Wiper Blade Market
Multi-line Automotive Suppliers
- Robert Bosch GmbH
- Valeo SA
- DENSO Corporation
- Continental AG
- FORVIA HELLA
- Marelli
Wiper and Replacement Brands
- Trico Products Corporation
- DRiV
- Mitsuba Corporation
- PIAA Corporation
- Nippon Wiper Blade Co. Ltd.
- Goodyear Tire & Rubber Company
- DOGA S.A.
- WEXCO Industries Inc.
- Michelin Lifestyle Limited
Wiper Blade Market - Report Scope
Table 10: Report Scope for the Wiper Blade Market (coverage fields and definitions), 2026 to 2036
| Coverage field | Report scope |
|---|---|
| Market breakdown | Blade type; application; vehicle type; sales channel; region |
| Quantitative units | USD billion |
| Market definition | Wiper blade market covering flat, conventional and hybrid blade systems for windshield and rear wipers on passenger cars, light commercial vehicles and heavy commercial vehicles, sold through OEM and aftermarket channels. |
| Regions covered | Asia Pacific; Europe; North America; Latin America; Middle East and Africa |
| Countries covered | China; India; Germany; Brazil; USA; UK; Japan |
| Key companies profiled | Robert Bosch GmbH, Valeo SA, DENSO Corporation, Trico Products Corporation, FORVIA HELLA, DRiV, Mitsuba Corporation, PIAA Corporation, Continental AG, Marelli, Nippon Wiper Blade Co. Ltd., Goodyear Tire & Rubber Company, DOGA S.A., WEXCO Industries Inc., Michelin Lifestyle Limited |
| Forecast period | 2026 to 2036 |
Wiper Blade Market - Research Methodology
Table 11: Research Methodology for the Wiper Blade Market (research methods and approach), 2026 edition
| Method | Approach |
|---|---|
| Data Sources | Vehicle parc statistics, trade body reports, supplier and retailer results and trade press from May 2025 onward. |
| Desk Research | Desk work covered car parc size and age, new vehicle wholesales and aftermarket channel results. |
| Market Sizing and Forecasting | Sizing starts from the 2025 base of USD 10.2 billion and the 2.9% CAGR for 2026 to 2036. |
| Data Validation | Parc and sales figures were matched to the issuing statistics office or trade body. |
Wiper Blade Market by Segments
Wiper Blade Market segmented by Blade Type:
- Flat Blade Systems
- Conventional Blade Systems
- Hybrid Blade Systems
Wiper Blade Market segmented by Application:
- Windshield Wipers
- Rear Wipers
Wiper Blade Market segmented by Vehicle Type:
- Passenger Cars
- Light Commercial Vehicles
- Heavy Commercial Vehicles
Wiper Blade Market segmented by Sales Channel:
- Aftermarket
- Original Equipment Manufacturer (OEM)
Wiper Blade Market by Region
- Asia Pacific
- Europe
- North America
- Latin America
- Middle East and Africa
Research Sources and Bibliography
- [1] Robert Bosch GmbH official press portal, bosch-presse.de, September 2026 program announcement.
- [2] PRNewswire official Bosch press release, April 29, 2026 (digital-release.wgnradio.com carrying the original PRNewswire text).
- [3] Valeo Service official website, valeoservice.com, May 2025 product announcement (“Valeo First Wipers — Your Clever Choice”).
- [4] Vrum. (2026, July 1). Frota brasileira envelhece e achar peças de reposição vira um desafio. https://www.vrum.com.br/mercado/2026/07/7453060-frota-brasileira-envelhece-e-achar-pecas-de-reposicao-vira-um-desafio.html
- [5] Statistisches Bundesamt (Destatis). (2026, July 22). Pkw-Dichte 2026 erneut gestiegen. https://www.destatis.de/DE/Presse/Pressemitteilungen/2026/07/PD26_N050_46_85.html
- [6] O'Reilly Automotive, Inc. (2026, July 29). O'Reilly Automotive, Inc. Reports Second Quarter 2026 Results. https://corporate.oreillyauto.com/2026/07/29/oreilly-automotive-inc-reports-second-quarter-2026-results/
- [7] Valeo SA (GlobeNewswire). (2026, July 22). Valeo H1 2026 Results. https://www.globenewswire.com/news-release/2026/07/22/3331600/0/en/Valeo-H1-2026-Results.html
- [8] Jiji Press (Adnkronos). (2026, January 5). Japan's New Auto Sales Up for 1st Time in 2 Yrs. https://english.adnkronos.com/2026/01/05/japans-new-auto-sales-up-for-1st-time-in-2-yrs/
This bibliography is provided for reader reference. The full report contains the complete reference list and detailed citations.
This Report Answers
- What will wiper blade sales total in 2026 and in 2036?
- At what CAGR will the market expand from 2026 to 2036?
- Which blade type will hold the largest share?
- Will the aftermarket or OEM fitment carry more volume?
- Which countries will grow fastest, and which will grow slowest?
- Which suppliers will compete for replacement and fitment business through 2036?
Table of Content
- Key Takeaways
- Market Size and CAGR
- Top Growth Driver
- Fastest Growing Segment
- Leading Region
- Key Companies
- Emerging Opportunities
- Executive Summary
- Global Market Outlook
- Demand-side Trends
- Supply-side Trends
- Technology Roadmap Analysis
- Analysis and Recommendations
- Analyst Perspective (What is happening? Why now? What should investors know?)
- Key Questions Answered
- How large is the market?
- What is the CAGR?
- What are key trends?
- Which region dominates?
- Who are the leaders?
Read More...
- Market Overview
- Market Coverage / Taxonomy
- Market Definition / Scope / Limitations
- Research Methodology
- Chapter Orientation
- Analytical Lens and Working Hypotheses
- Market Structure, Signals, and Trend Drivers
- Benchmarking and Cross-market Comparability
- Market Sizing, Forecasting, and Opportunity Mapping
- Research Design and Evidence Framework
- Desk Research Programme (Secondary Evidence)
- Expert Input and Fieldwork (Primary Evidence)
- Tooling, Models, and Reference Databases
- Data Engineering and Model Build
- Quality Assurance and Audit Trail
- Market Background
- Market Dynamics (Drivers, Restraints, Opportunity, Trends)
- Scenario Forecast (Optimistic, Likely, Conservative)
- Impact Analysis
- AI Impact
- Sustainability Impact
- Regulatory Impact
- Technology Impact
- Consumer / Buyer Analysis
- Purchase Drivers
- Adoption Barriers
- Buyer Journey
- Opportunity Map Analysis
- Product Life Cycle Analysis
- Supply Chain Analysis
- Investment Feasibility Matrix
- Value Chain Analysis
- PESTLE and Porter's Analysis
- Regulatory Landscape
- Regional Parent Market Outlook
- Production and Consumption Statistics
- Import and Export Statistics
- Global Market Analysis and Forecast, 2021 to 2036
- Historical Market Size Value (USD Billion) Analysis, 2021 to 2025
- Current and Future Market Size Value (USD Billion) Projections, 2026 to 2036
- Y-o-Y Growth Trend Analysis
- Absolute $ Opportunity Analysis
- Global Market Pricing Analysis, 2021 to 2036
- Global Market Analysis and Forecast, By Blade Type, 2021 to 2036
- Introduction / Key Findings
- Historical Market Size Value (USD Billion) Analysis By Blade Type, 2021 to 2025
- Current and Future Market Size Value (USD Billion) Analysis and Forecast By Blade Type, 2026 to 2036
- Flat Blade Systems
- Conventional Blade Systems
- Hybrid Blade Systems
- Y-o-Y Growth Trend Analysis By Blade Type, 2021 to 2025
- Absolute $ Opportunity Analysis By Blade Type, 2026 to 2036
- Global Market Analysis and Forecast, By Application, 2021 to 2036
- Introduction / Key Findings
- Historical Market Size Value (USD Billion) Analysis By Application, 2021 to 2025
- Current and Future Market Size Value (USD Billion) Analysis and Forecast By Application, 2026 to 2036
- Windshield Wipers
- Rear Wipers
- Y-o-Y Growth Trend Analysis By Application, 2021 to 2025
- Absolute $ Opportunity Analysis By Application, 2026 to 2036
- Global Market Analysis and Forecast, By Vehicle Type, 2021 to 2036
- Introduction / Key Findings
- Historical Market Size Value (USD Billion) Analysis By Vehicle Type, 2021 to 2025
- Current and Future Market Size Value (USD Billion) Analysis and Forecast By Vehicle Type, 2026 to 2036
- Passenger Cars
- Light Commercial Vehicles
- Heavy Commercial Vehicles
- Y-o-Y Growth Trend Analysis By Vehicle Type, 2021 to 2025
- Absolute $ Opportunity Analysis By Vehicle Type, 2026 to 2036
- Global Market Analysis and Forecast, By Sales Channel, 2021 to 2036
- Introduction / Key Findings
- Historical Market Size Value (USD Billion) Analysis By Sales Channel, 2021 to 2025
- Current and Future Market Size Value (USD Billion) Analysis and Forecast By Sales Channel, 2026 to 2036
- Aftermarket
- Original Equipment Manufacturer (OEM)
- Y-o-Y Growth Trend Analysis By Sales Channel, 2021 to 2025
- Absolute $ Opportunity Analysis By Sales Channel, 2026 to 2036
- Global Market Analysis and Forecast, By Region, 2021 to 2036
- Introduction
- Historical Market Size Value (USD Billion) Analysis By Region, 2021 to 2025
- Current Market Size Value (USD Billion) Analysis and Forecast By Region, 2026 to 2036
- Asia Pacific
- Europe
- North America
- Latin America
- Middle East and Africa
- Market Attractiveness Analysis By Region
- Asia Pacific Market Analysis and Forecast, By Country
- Historical Market Size Value (USD Billion) Trend Analysis By Market Taxonomy, 2021 to 2025
- Market Size Value (USD Billion) Forecast By Market Taxonomy, 2026 to 2036
- By Country
- By Blade Type
- By Application
- By Vehicle Type
- By Sales Channel
- Market Attractiveness Analysis
- By Country
- By Blade Type
- By Application
- By Vehicle Type
- By Sales Channel
- Key Takeaways
- Europe Market Analysis and Forecast, By Country
- Historical Market Size Value (USD Billion) Trend Analysis By Market Taxonomy, 2021 to 2025
- Market Size Value (USD Billion) Forecast By Market Taxonomy, 2026 to 2036
- By Country
- By Blade Type
- By Application
- By Vehicle Type
- By Sales Channel
- Market Attractiveness Analysis
- By Country
- By Blade Type
- By Application
- By Vehicle Type
- By Sales Channel
- Key Takeaways
- North America Market Analysis and Forecast, By Country, 2021 to 2036
- Historical Market Size Value (USD Billion) Trend Analysis By Market Taxonomy, 2021 to 2025
- Market Size Value (USD Billion) Forecast By Market Taxonomy, 2026 to 2036
- By Country
- By Blade Type
- By Application
- By Vehicle Type
- By Sales Channel
- Market Attractiveness Analysis
- By Country
- By Blade Type
- By Application
- By Vehicle Type
- By Sales Channel
- Key Takeaways
- Latin America Market Analysis and Forecast, By Country
- Historical Market Size Value (USD Billion) Trend Analysis By Market Taxonomy, 2021 to 2025
- Market Size Value (USD Billion) Forecast By Market Taxonomy, 2026 to 2036
- By Country
- By Blade Type
- By Application
- By Vehicle Type
- By Sales Channel
- Market Attractiveness Analysis
- By Country
- By Blade Type
- By Application
- By Vehicle Type
- By Sales Channel
- Key Takeaways
- Middle East and Africa Market Analysis and Forecast, By Country
- Historical Market Size Value (USD Billion) Trend Analysis By Market Taxonomy, 2021 to 2025
- Market Size Value (USD Billion) Forecast By Market Taxonomy, 2026 to 2036
- By Country
- By Blade Type
- By Application
- By Vehicle Type
- By Sales Channel
- Market Attractiveness Analysis
- By Country
- By Blade Type
- By Application
- By Vehicle Type
- By Sales Channel
- Key Takeaways
- Key Countries Market Analysis
- China
- Pricing Analysis
- Market Share Analysis, 2025
- By Blade Type
- By Application
- By Vehicle Type
- By Sales Channel
- India
- Pricing Analysis
- Market Share Analysis, 2025
- By Blade Type
- By Application
- By Vehicle Type
- By Sales Channel
- Germany
- Pricing Analysis
- Market Share Analysis, 2025
- By Blade Type
- By Application
- By Vehicle Type
- By Sales Channel
- Brazil
- Pricing Analysis
- Market Share Analysis, 2025
- By Blade Type
- By Application
- By Vehicle Type
- By Sales Channel
- USA
- Pricing Analysis
- Market Share Analysis, 2025
- By Blade Type
- By Application
- By Vehicle Type
- By Sales Channel
- UK
- Pricing Analysis
- Market Share Analysis, 2025
- By Blade Type
- By Application
- By Vehicle Type
- By Sales Channel
- Japan
- Pricing Analysis
- Market Share Analysis, 2025
- By Blade Type
- By Application
- By Vehicle Type
- By Sales Channel
- China
- Market Structure Analysis
- Competition Dashboard
- Competition Benchmarking
- Market Share Analysis of Top Players
- By Regional
- By Blade Type
- By Application
- By Vehicle Type
- By Sales Channel
- Emerging Startups
- Innovation Benchmarking
- Competition Analysis
- Competition Deep Dive
- Valeo SA
- Overview
- Product Portfolio
- Profitability by Market Segments
- Sales Footprint
- Strategy Overview
- Marketing Strategy
- Product Strategy
- Channel Strategy
- Robert Bosch GmbH
- DENSO Corporation
- Trico Products Corporation
- O'Reilly Automotive (channel)
- Continental AG
- FORVIA HELLA
- Marelli
- DRiV
- Mitsuba Corporation
- PIAA Corporation
- Nippon Wiper Blade Co. Ltd.
- Goodyear Tire & Rubber Company
- DOGA S.A.
- WEXCO Industries Inc.
- Michelin Lifestyle Limited
- Valeo SA
- Case Studies
- Success Stories
- Recent Developments
- Competition Deep Dive
- Assumptions & Acronyms Used
List of Tables
- Table 1: Global Market Value (USD Billion) Forecast by Region, 2021 to 2036
- Table 2: Global Market Value (USD Billion) Forecast by Blade Type, 2021 to 2036
- Table 3: Global Market Value (USD Billion) Forecast by Application, 2021 to 2036
- Table 4: Global Market Value (USD Billion) Forecast by Vehicle Type, 2021 to 2036
- Table 5: Global Market Value (USD Billion) Forecast by Sales Channel, 2021 to 2036
- Table 6: Asia Pacific Market Value (USD Billion) Forecast by Country, 2021 to 2036
- Table 7: Asia Pacific Market Value (USD Billion) Forecast by Blade Type, 2021 to 2036
- Table 8: Asia Pacific Market Value (USD Billion) Forecast by Application, 2021 to 2036
- Table 9: Asia Pacific Market Value (USD Billion) Forecast by Vehicle Type, 2021 to 2036
- Table 10: Asia Pacific Market Value (USD Billion) Forecast by Sales Channel, 2021 to 2036
- Table 11: Europe Market Value (USD Billion) Forecast by Country, 2021 to 2036
- Table 12: Europe Market Value (USD Billion) Forecast by Blade Type, 2021 to 2036
- Table 13: Europe Market Value (USD Billion) Forecast by Application, 2021 to 2036
- Table 14: Europe Market Value (USD Billion) Forecast by Vehicle Type, 2021 to 2036
- Table 15: Europe Market Value (USD Billion) Forecast by Sales Channel, 2021 to 2036
- Table 16: North America Market Value (USD Billion) Forecast by Country, 2021 to 2036
- Table 17: North America Market Value (USD Billion) Forecast by Blade Type, 2021 to 2036
- Table 18: North America Market Value (USD Billion) Forecast by Application, 2021 to 2036
- Table 19: North America Market Value (USD Billion) Forecast by Vehicle Type, 2021 to 2036
- Table 20: North America Market Value (USD Billion) Forecast by Sales Channel, 2021 to 2036
- Table 21: Latin America Market Value (USD Billion) Forecast by Country, 2021 to 2036
- Table 22: Latin America Market Value (USD Billion) Forecast by Blade Type, 2021 to 2036
- Table 23: Latin America Market Value (USD Billion) Forecast by Application, 2021 to 2036
- Table 24: Latin America Market Value (USD Billion) Forecast by Vehicle Type, 2021 to 2036
- Table 25: Latin America Market Value (USD Billion) Forecast by Sales Channel, 2021 to 2036
- Table 26: Middle East and Africa Market Value (USD Billion) Forecast by Country, 2021 to 2036
- Table 27: Middle East and Africa Market Value (USD Billion) Forecast by Blade Type, 2021 to 2036
- Table 28: Middle East and Africa Market Value (USD Billion) Forecast by Application, 2021 to 2036
- Table 29: Middle East and Africa Market Value (USD Billion) Forecast by Vehicle Type, 2021 to 2036
- Table 30: Middle East and Africa Market Value (USD Billion) Forecast by Sales Channel, 2021 to 2036
List of Figures
- Figure 1: Global Market Pricing Analysis
- Figure 2: Global Market Value (USD Billion) Forecast 2021-2036
- Figure 3: Global Market Value Share and BPS Analysis by Blade Type, 2026 and 2036
- Figure 4: Global Market Y-o-Y Growth Comparison by Blade Type, 2026-2036
- Figure 5: Global Market Attractiveness Analysis by Blade Type
- Figure 6: Global Market Value Share and BPS Analysis by Application, 2026 and 2036
- Figure 7: Global Market Y-o-Y Growth Comparison by Application, 2026-2036
- Figure 8: Global Market Attractiveness Analysis by Application
- Figure 9: Global Market Value Share and BPS Analysis by Vehicle Type, 2026 and 2036
- Figure 10: Global Market Y-o-Y Growth Comparison by Vehicle Type, 2026-2036
- Figure 11: Global Market Attractiveness Analysis by Vehicle Type
- Figure 12: Global Market Value Share and BPS Analysis by Sales Channel, 2026 and 2036
- Figure 13: Global Market Y-o-Y Growth Comparison by Sales Channel, 2026-2036
- Figure 14: Global Market Attractiveness Analysis by Sales Channel
- Figure 15: Global Market Value (USD Billion) Share and BPS Analysis by Region, 2026 and 2036
- Figure 16: Global Market Y-o-Y Growth Comparison by Region, 2026-2036
- Figure 17: Global Market Attractiveness Analysis by Region
- Figure 18: Asia Pacific Market Incremental Dollar Opportunity, 2026-2036
- Figure 19: Europe Market Incremental Dollar Opportunity, 2026-2036
- Figure 20: North America Market Incremental Dollar Opportunity, 2026-2036
- Figure 21: Latin America Market Incremental Dollar Opportunity, 2026-2036
- Figure 22: Middle East and Africa Market Incremental Dollar Opportunity, 2026-2036
- Figure 23: Asia Pacific Market Value Share and BPS Analysis by Country, 2026 and 2036
- Figure 24: Asia Pacific Market Value Share and BPS Analysis by Blade Type, 2026 and 2036
- Figure 25: Asia Pacific Market Y-o-Y Growth Comparison by Blade Type, 2026-2036
- Figure 26: Asia Pacific Market Attractiveness Analysis by Blade Type
- Figure 27: Asia Pacific Market Value Share and BPS Analysis by Application, 2026 and 2036
- Figure 28: Asia Pacific Market Y-o-Y Growth Comparison by Application, 2026-2036
- Figure 29: Asia Pacific Market Attractiveness Analysis by Application
- Figure 30: Asia Pacific Market Value Share and BPS Analysis by Vehicle Type, 2026 and 2036
- Figure 31: Asia Pacific Market Y-o-Y Growth Comparison by Vehicle Type, 2026-2036
- Figure 32: Asia Pacific Market Attractiveness Analysis by Vehicle Type
- Figure 33: Asia Pacific Market Value Share and BPS Analysis by Sales Channel, 2026 and 2036
- Figure 34: Asia Pacific Market Y-o-Y Growth Comparison by Sales Channel, 2026-2036
- Figure 35: Asia Pacific Market Attractiveness Analysis by Sales Channel
- Figure 36: Europe Market Value Share and BPS Analysis by Country, 2026 and 2036
- Figure 37: Europe Market Value Share and BPS Analysis by Blade Type, 2026 and 2036
- Figure 38: Europe Market Y-o-Y Growth Comparison by Blade Type, 2026-2036
- Figure 39: Europe Market Attractiveness Analysis by Blade Type
- Figure 40: Europe Market Value Share and BPS Analysis by Application, 2026 and 2036
- Figure 41: Europe Market Y-o-Y Growth Comparison by Application, 2026-2036
- Figure 42: Europe Market Attractiveness Analysis by Application
- Figure 43: Europe Market Value Share and BPS Analysis by Vehicle Type, 2026 and 2036
- Figure 44: Europe Market Y-o-Y Growth Comparison by Vehicle Type, 2026-2036
- Figure 45: Europe Market Attractiveness Analysis by Vehicle Type
- Figure 46: Europe Market Value Share and BPS Analysis by Sales Channel, 2026 and 2036
- Figure 47: Europe Market Y-o-Y Growth Comparison by Sales Channel, 2026-2036
- Figure 48: Europe Market Attractiveness Analysis by Sales Channel
- Figure 49: North America Market Value Share and BPS Analysis by Country, 2026 and 2036
- Figure 50: North America Market Value Share and BPS Analysis by Blade Type, 2026 and 2036
- Figure 51: North America Market Y-o-Y Growth Comparison by Blade Type, 2026-2036
- Figure 52: North America Market Attractiveness Analysis by Blade Type
- Figure 53: North America Market Value Share and BPS Analysis by Application, 2026 and 2036
- Figure 54: North America Market Y-o-Y Growth Comparison by Application, 2026-2036
- Figure 55: North America Market Attractiveness Analysis by Application
- Figure 56: North America Market Value Share and BPS Analysis by Vehicle Type, 2026 and 2036
- Figure 57: North America Market Y-o-Y Growth Comparison by Vehicle Type, 2026-2036
- Figure 58: North America Market Attractiveness Analysis by Vehicle Type
- Figure 59: North America Market Value Share and BPS Analysis by Sales Channel, 2026 and 2036
- Figure 60: North America Market Y-o-Y Growth Comparison by Sales Channel, 2026-2036
- Figure 61: North America Market Attractiveness Analysis by Sales Channel
- Figure 62: Latin America Market Value Share and BPS Analysis by Country, 2026 and 2036
- Figure 63: Latin America Market Value Share and BPS Analysis by Blade Type, 2026 and 2036
- Figure 64: Latin America Market Y-o-Y Growth Comparison by Blade Type, 2026-2036
- Figure 65: Latin America Market Attractiveness Analysis by Blade Type
- Figure 66: Latin America Market Value Share and BPS Analysis by Application, 2026 and 2036
- Figure 67: Latin America Market Y-o-Y Growth Comparison by Application, 2026-2036
- Figure 68: Latin America Market Attractiveness Analysis by Application
- Figure 69: Latin America Market Value Share and BPS Analysis by Vehicle Type, 2026 and 2036
- Figure 70: Latin America Market Y-o-Y Growth Comparison by Vehicle Type, 2026-2036
- Figure 71: Latin America Market Attractiveness Analysis by Vehicle Type
- Figure 72: Latin America Market Value Share and BPS Analysis by Sales Channel, 2026 and 2036
- Figure 73: Latin America Market Y-o-Y Growth Comparison by Sales Channel, 2026-2036
- Figure 74: Latin America Market Attractiveness Analysis by Sales Channel
- Figure 75: Middle East and Africa Market Value Share and BPS Analysis by Country, 2026 and 2036
- Figure 76: Middle East and Africa Market Value Share and BPS Analysis by Blade Type, 2026 and 2036
- Figure 77: Middle East and Africa Market Y-o-Y Growth Comparison by Blade Type, 2026-2036
- Figure 78: Middle East and Africa Market Attractiveness Analysis by Blade Type
- Figure 79: Middle East and Africa Market Value Share and BPS Analysis by Application, 2026 and 2036
- Figure 80: Middle East and Africa Market Y-o-Y Growth Comparison by Application, 2026-2036
- Figure 81: Middle East and Africa Market Attractiveness Analysis by Application
- Figure 82: Middle East and Africa Market Value Share and BPS Analysis by Vehicle Type, 2026 and 2036
- Figure 83: Middle East and Africa Market Y-o-Y Growth Comparison by Vehicle Type, 2026-2036
- Figure 84: Middle East and Africa Market Attractiveness Analysis by Vehicle Type
- Figure 85: Middle East and Africa Market Value Share and BPS Analysis by Sales Channel, 2026 and 2036
- Figure 86: Middle East and Africa Market Y-o-Y Growth Comparison by Sales Channel, 2026-2036
- Figure 87: Middle East and Africa Market Attractiveness Analysis by Sales Channel
- Figure 88: Global Market - Tier Structure Analysis
- Figure 89: Global Market - Company Share Analysis
Frequently Asked Questions
What is the size of the Wiper Blade Market in 2026?
Sales will be about USD 10.5 billion in 2026 (estimated) and USD 14.0 billion in 2036 (projected), as per FMI. At what rate will the wiper blade market grow? Blade sales will record a 2.9% CAGR from 2026 to 2036. Older fleets in the UK and Brazil and new cars in China and India will carry the 2.9% CAGR.
Which blade type will lead in 2026?
Flat blade systems will take 49% of blade type sales, ahead of conventional systems at 30%.
Which application will hold the larger share?
Front windshield wipers will hold 64%, and rear wipers will hold 36%.
Which country will grow fastest?
Chinese sales will post a 4.8% CAGR from 2026 to 2036, and FMI expects India to follow at 4.2%.
How concentrated will competition be?
Moderate concentration will continue, with the top three companies holding roughly 40% to 45% of sales combined.
Preview the report firsthand - request a free sample
Get SampleGet the brochure for pricing and purchase details.
Get PDF
