The APAC Wiper Blade Industry is estimated to be valued at USD 3.1 billion in 2025 and is projected to reach USD 6.0 billion by 2035, registering a compound annual growth rate (CAGR) of 6.8% over the forecast period.
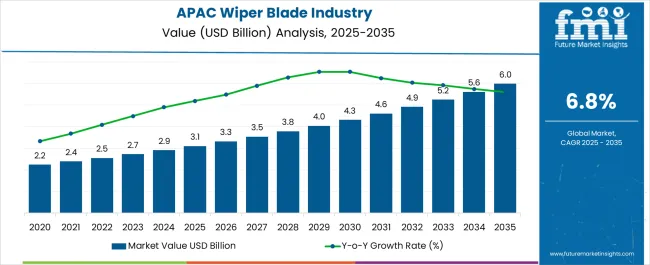
| Metric | Value |
|---|---|
| APAC Wiper Blade Industry Estimated Value in (2025 E) | USD 3.1 billion |
| APAC Wiper Blade Industry Forecast Value in (2035 F) | USD 6.0 billion |
| Forecast CAGR (2025 to 2035) | 6.8% |
The APAC wiper blade industry is expanding steadily with growth supported by rising automotive production, increasing vehicle ownership, and heightened demand for safety and visibility enhancements. Current dynamics are characterized by strong replacement demand across mature markets and rising first-time purchases in emerging economies. Regulatory emphasis on road safety and adverse weather conditions prevalent across several APAC countries are also driving consistent adoption.
Manufacturers are investing in product innovation, such as aerodynamic designs and advanced rubber materials, to improve durability and performance. Distribution networks are being optimized through both offline retail and e-commerce channels to ensure wider market reach.
The future outlook is supported by urbanization trends, the expansion of ride-sharing and fleet operators, and increasing penetration of passenger vehicles in high-growth economies Growth rationale is based on the essential role of wiper blades in vehicle safety, rising consumer preference for premium and longer-lasting products, and the ability of industry players to align offerings with evolving automotive design standards.
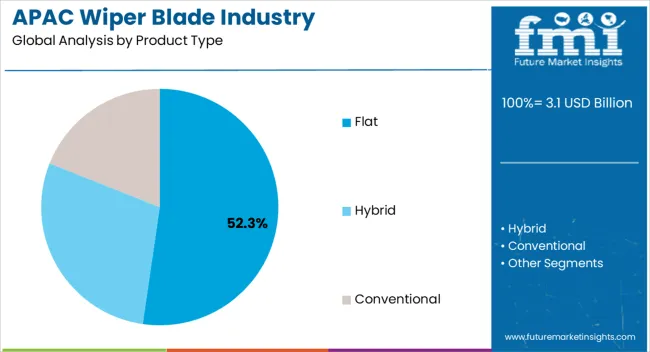
The flat wiper blade segment, holding 52.30% of the product type category, has emerged as the dominant product due to its superior performance in terms of wiping efficiency, reduced noise, and sleek design. Its aerodynamic structure offers durability and resistance against wind lift, which has strengthened consumer preference across diverse vehicle categories.
Market adoption has been further reinforced by compatibility with modern vehicle designs and increasing availability through both OEMs and aftermarket channels. Manufacturers are emphasizing enhanced rubber formulations and integrated spoiler designs to improve functionality under extreme weather conditions.
Continued technological improvements and consumer awareness of product longevity are expected to sustain the segment’s market leadership while supporting incremental revenue growth across APAC markets.
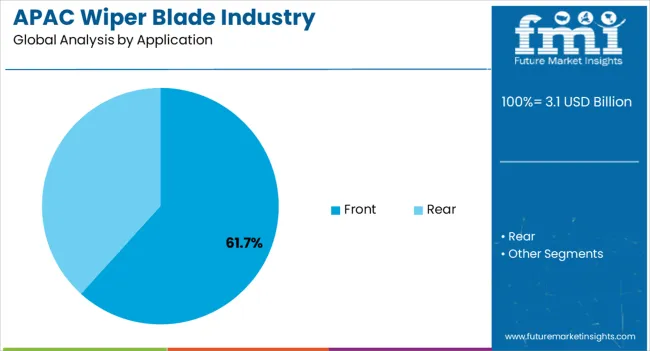
The front wiper blade segment, accounting for 61.70% of the application category, has maintained its leading position due to its indispensable role in ensuring driver visibility and vehicle safety. The segment benefits from mandatory installation in all vehicles and consistent replacement demand driven by wear and tear.
Consumer awareness regarding the critical role of front wipers in accident prevention has supported sustained adoption. Market dynamics are also influenced by seasonal demand patterns, particularly in regions with heavy rainfall and monsoon climates.
Product development strategies, including the introduction of all-weather blades and advanced coating technologies, have enhanced reliability and extended service life The segment is expected to retain its dominance as automotive safety standards tighten and as vehicle parc expansion drives recurring replacement demand across the region.
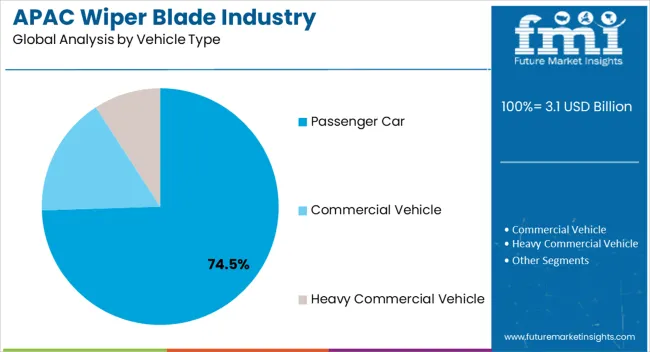
The passenger car segment, representing 74.50% of the vehicle type category, has emerged as the largest contributor due to rising ownership levels, rapid urbanization, and the growing middle-class population in APAC economies. Expanding automotive manufacturing hubs in countries such as China, India, and Southeast Asia have reinforced production and sales of passenger cars, directly supporting wiper blade demand.
The segment benefits from both OEM installations and aftermarket replacement cycles, which are accelerated by climatic conditions that impact blade durability. Consumers are increasingly opting for premium and longer-lasting wiper blades, reflecting a shift toward quality-focused purchasing.
With continued growth in vehicle sales, expansion of road infrastructure, and rising adoption of electric and hybrid passenger cars, the passenger car segment is expected to remain the leading category, driving sustained demand for wiper blades across APAC markets.
Revenue in APAC to Double through 2035
The APAC wipe blade business revenue is predicted to expand around 2x through 2035, amid a 4.8% increase in expected CAGR compared to the historical one. This is due to the booming automotive sector and growing demand for novel wiper technologies to improve the safety of vehicles.
Sales of wiper blades in APAC will also rise due to rapid population growth, increasing anticipated urbanization, a rise in vehicle ownership, and heightened awareness of road safety. By 2035, the total revenue is set to reach USD 5,763.1 million.
China to Remain the Hotbed for Wiper Blade Manufacturers
As per the latest analysis, China is expected to retain its dominance in APAC during the forecast period. It is set to hold around 45.0% of the APAC share in 2035. This is attributed to the following factors:
Booming Electric Vehicle Sector: China’s sustained leadership in the APAC wiper blade business is intimately tied to the country’s electric vehicle (EV) revolution. According to the World Economic Forum, in 2025, China remained the world’s leading EV country, with global sales of 59%. With a robust push toward EV adoption, the demand for wiper blades specifically designed for electric vehicles is surging. These blades need to meet the unique demands of EV windshields, ensuring optimal performance and longevity in an expanding segment of the automotive business.
Government Emphasis on Road Safety: China government’s unwavering commitment to road safety has become a driving force behind the increasing demand for advanced wiper blade technologies. As part of broader automotive safety initiatives, there is a growing mandate for vehicles to be equipped with cutting-edge wiper systems, reinforcing visibility and accident prevention measures on the road. This is creating a high demand for wiper blades in APAC, and the trend is expected to continue through 2035.
Robust Aftermarket Demand: The aftermarket landscape plays a pivotal role in maintaining the country's dominance in APAC. The dynamic aftermarket sector witnesses a consistent demand for high-quality automotive wiper systems driven by consumers seeking reliable replacements and upgrades. This sustained demand fortifies the revenue share and fuels innovation as manufacturers strive to meet evolving consumer expectations. This is expected to uplift wiper blade demand in the country through 2035.
Conventional Wiper Blades Stealing the Show
As per the latest report, conventional wiper blades are expected to dominate the APAC wiper blade business, with a volume share of about 64.8% in 2025. This is due to the growing demand for conventional wiper blades from the thriving automotive sector.
Cost-effectiveness plays a crucial role, particularly in countries where economic considerations heavily influence consumer choices. Conventional wiper blades are often more affordable than their high-tech counterparts, making them an attractive option for a wide range of vehicle owners, from budget-conscious consumers to commercial fleets.
The simplicity and ease of installation and maintenance of conventional wiper blades contribute to their popularity. These blades are user-friendly and can be easily replaced without the need for specialized tools or professional assistance. This accessibility resonates well with a diverse consumer base, including those in regions with less access to sophisticated automotive services.
The proven durability and reliability of conventional wiper blades make them a practical choice, especially in diverse weather conditions prevalent in the APAC region. While advanced technologies such as beam blades or hybrid designs offer unique features, conventional blades are known for their resilience and effective performance, demonstrating consistent wiping capability in several climates, from heavy rains to dusty environments.
Hybrid wiper blades, on the other hand, are anticipated to witness a higher demand, rising at a 7.1% CAGR during the forecast period. This is attributable to the growing usage of these wipers in modern vehicles.
Wiper blades are gaining immense traction across the APAC for several reasons. These include their evolving designs, usage of advanced materials and technologies, heightened focus on driver safety, and thriving automotive sector. Similarly, the recognition of their pivotal role in ensuring clear visibility, particularly in adverse weather conditions, is driving demand.
Wiper blade manufacturers are actively seeking innovations in material technology, aerodynamics, and smart features to enhance performance and cater to the growing demand for advanced solutions. The business is characterized by a pursuit of eco-friendly materials, durable designs, and compatibility with evolving automotive technologies, reflecting a concerted effort to stay ahead of the competition.
Front and rear wiper blades are anticipated to witness high demand from automotive manufacturers due to their integral role in enhancing driver visibility and safety. As carmakers increasingly prioritize advanced safety features, front wipers play a crucial part in ensuring clear windshields during several weather conditions.
The rising trend of integrating Advanced Driver Assistance Systems (ADAS) in vehicles further amplifies the importance of efficient front automotive wiper systems. The usage of these advanced technologies is contributing to the growing demand from automotive manufacturers aiming to provide comprehensive safety solutions in their vehicles.
With the emphasis on sleek and aerodynamic vehicle designs, front wipers are not only functional but also contribute to the overall aesthetics of modern vehicles. This is making them a sought-after component in the automotive manufacturing landscape.
Growing consumer demand for efficient, quiet, and cost-effective solutions for optimal visibility on the road is triggering innovation in wiper blade technology. To meet this demand, key wiper blade manufacturers are constantly introducing novel solutions with enhanced features.
Recent years have seen significant strides in the wiper blade business, marked by technological innovations aimed at enhancing user experience. Key players such as Michelin are prioritizing consumer convenience with features such as double-lock connectors, ensuring not only easy installation but also prolonged durability to meet the expectations of a discerning clientele.
Selifaurch's commitment to high-performance wiper blades is evident in designs that minimize friction, contributing to superior wipe quality and increased longevity, particularly in challenging weather scenarios. Such innovations are expected to foster the growth of the wiper blade business in APAC and other regions.
Key factors expected to boost revenue in APAC include-
Sales of wiper blades in APAC grew at a CAGR of 2.3% between 2020 and 2025. Total revenue reached about USD 2,730.6 million in 2025. In the forecast period, the APAC wiper blade business is set to thrive at a CAGR of 7.1%.
| Historical CAGR (2020 to 2025) | 2.3% |
|---|---|
| Forecast CAGR (2025 to 2035) | 7.1% |
The APAC wiper blade business experienced consistent growth from 2020 to 2025, attributed to several key factors. The region’s burgeoning automotive business played a pivotal role, with increased vehicle production and sales driving the demand for essential components such as wiper blades.
Changing weather patterns in the Asia Pacific, including monsoons and varying climatic conditions, heightened the importance of effective wiper blades. This further fueled business growth. The adoption of advanced windshield technologies, incorporating innovations in wiper blade design and materials, also played a significant role in sustaining demand.
Future Scope of the Wiper Blade Business in APAC-
Over the forecast period, the APAC wiper blade business is poised to exhibit healthy growth, totaling a valuation of USD 2,897.4 million by 2025. This growth is fueled by a combination of factors, including the region's expanding automotive sector, increasing awareness of road safety, and the integration of advanced wiper blade technologies to address diverse climatic conditions across Asia-Pacific.
Key Dynamics-
Rising Demand for High-tech Wiper Blades Boosting Sales
Sales of wiper blades in APAC are expected to rise rapidly during the forecast period. This is due to the growing demand for premium wiper blades offering enhanced performance, durability, and noise reduction, especially from the SUVs segment. Consumers are inclined toward using high-tech solutions such as rain-sensing wipers.
In several parts of China, Japan, and India, SUV demand is increasing. The expansion is mainly driven by rising disposable income and changing demographics. The automotive wiper blade business is expected to see significant growth as a result of the increase in SUV sales.
High Replacement Rate of Wiper Blades
Wiper blades need to be changed every six months in order to work at their best. However, factors such as the material they are made of and the quality of the blades can affect how long they survive.
Regularly parking a car in the sweltering sun can also significantly affect the windshield wipers. Over time, the blades break and crack due to plastic degradation caused by the sun’s heat.
If left neglected for too long, the material of the blade can rip and separate from the arm. This can seriously damage the windshield since the metal or hard plastic of the arm rubs on the glass. Due to its shorter lifespan, aftermarket sales of replacement wipers are very common.
Increasing Demand for Driver and Vehicle Safety
One of the most important requirements for safe driving in all types of weather and driving conditions is having a clear vision of the road ahead. Especially in current high-speed cars, windscreen wiper blades are necessary to keep the windscreen clean enough for the driver's perspective.
Despite being a relatively insignificant part of the car, windshield wipers significantly impact driving and safety. They swiftly and cleanly remove rain, snow, dirt, pollen, frost, and other debris at the press of a button. As a result, they offer superior sight, increasing the driver's and vehicle's overall safety.
As per the World Health Organization (WHO), about 1.3 million people die in road crashes every year. To reduce this and improve the safety of vehicles and passengers, auto companies in APAC and other regions use advanced wiper technologies in vehicles. This will likely uplift demand for front and rear wiper blades.
Introduction of Silicone Material as an Alternative to Rubber
Several wipers contain rubber blades, which often deteriorate over time after being exposed to heat for an extended period, even with only minor rain exposure. As they age, they become less efficient. This is prompting wiper blade companies to utilize novel materials such as silicone.
As they are more resistant to severe weather, silicone wiper coating typically outlasts rubber ones in terms of endurance. They can last two to six times as long as rubber wiper blades, which typically harden fast and lose their effectiveness when exposed to high temperatures for an extended period. This will create new opportunities for manufacturers.
Hatchback and Sedan Aerodynamics for Rear Wipers
Rear wipers are used to keep the window clean and visible for safety purposes. In sedans and other compact cars, a slanted window prevents this accumulation. A sedan's and other small cars' aerodynamic shapes, which enable movement with reduced wind resistance, enable them to get high gas mileage.
To increase aerodynamics and reduce drag, the windows on these little cars are typically as slanted as possible. A rear wiper is unnecessary because the slanted glass does not collect dirt as readily. Further, the addition of a rear wiper would increase wind resistance and decrease gas efficiency.
Growing Counterfeit Parts
The ‘crime of the twenty-first century,’ as described by the Federal Bureau of Investigation (FBI), is counterfeiting. The production of fake goods, including wiper blades, is a big problem in the Asia-Pacific region.
The affordable price of these counterfeit parts (often less than 25% to 40%) is also fueling their adoption. This is anticipated to restrain the growth of the automotive wiper blade business to a large extent.
The table below highlights key countries’ revenues. China, Japan, and India are expected to remain the top three consumers of wiper blades, with expected valuations of USD 1,387.5 million, USD 589.9 million, and USD 300.6 million, respectively, in 2035.
| Countries | Expected Wiper Blade Revenue (2035) |
|---|---|
| China | USD 1,387.5 million |
| Japan | USD 589.9 million |
| India | USD 300.6 million |
The table below shows the estimated growth rates of the top three countries. Japan, South Korea, and Indonesia are set to record higher CAGRs of 8.3%, 8.4%, and 7.4%, respectively, through 2035.
| Countries | Projected Wiper Blade CAGR (2025 to 2035) |
|---|---|
| Japan | 8.3% |
| South Korea | 8.4% |
| Indonesia | 7.4% |
Japan’s wiper blade business size is projected to reach USD 589.9 million by 2035. Over the assessment period, demand for wiper blades in Japan is anticipated to rise at a robust CAGR of around 8.3%.
Several factors are expected to drive wiper blade demand in Japan. These include rising production and sales of vehicles, particularly electric ones, and a growing need for improving passenger and vehicle safety.
Japan's unwavering commitment to safety standards in the automotive sector further fuels the demand for top-tier wiper blades. This is because wiper blades are essential for improving the overall safety of vehicles.
With an emphasis on road safety, consumers in Japan prioritize vehicles equipped with advanced safety features, positioning wiper blades as integral components for optimal visibility during adverse weather conditions. This aligns with the global trend of heightened awareness regarding road safety, driving the adoption of advanced wiper blade technologies.
A distinctive aspect contributing to the growth is the niche sector for wiper blades catering to Japan's automotive enthusiasts and collectors. These consumers, often owners of classic and rare vehicle models, seek specialized wiper blades, creating a unique segment within the business.
Japan-based wiper blade manufacturers, with their extensive lineup covering a wide array of vehicles, position themselves as experts capable of meeting the specific needs of this discerning consumer base. This will likely boost the overall wiper blade revenue in the country.
As per the latest report, sales of wiper blades in China are projected to soar at a CAGR of around 6.5% during the assessment period. Total valuation in the country is anticipated to reach USD 1,387.5 million by 2035.
China stands as the pivotal force propelling the growth of the APAC wiper blade business. With its status as the largest automotive country in the region, China's influential role is underscored by its robust vehicle production and consistently high sales figures.
The nation's dynamic automotive landscape, marked by a burgeoning middle class and rapid urbanization, translates into a significant and sustained demand for wiper blades. The heightened awareness of road safety among consumers further fuels demand for wiper blades as these essential components contribute directly to driving visibility and safety.
The ongoing advancements in China's manufacturing capabilities and its burgeoning automotive aftermarket sector reinforce the country's central position in shaping the growth trajectory. As the automotive business in China continues to evolve, with a focus on innovation and technology adoption, the wiper blades business stands to benefit substantially.
The interplay of these factors solidifies China's dominance in driving growth in the APAC wiper blade business. These factors also position the country as a key influencer in shaping future trends and developments within the broader automotive components sector in the Asia-Pacific region.
The wiper blade business value in India is anticipated to total USD 300.6 million by 2035. Over the forecast period, demand for wiper blades in the country is set to increase at a robust CAGR of 6.9%. This is attributable to the growing popularity of passenger vehicles in the country.
India is experiencing a surge in vehicle ownership, driven by a growing middle class and increased urbanization. As more individuals and families invest in automobiles, the demand for essential automotive components, including wiper blades, witnesses a proportional increase.
Wiper blade manufacturers can capitalize on this trend by providing a diverse range of products to cater to the expanding vehicle sector. Similarly, several international wiper blade companies are focusing on entering India to gain maximum profits.
The aftermarket segment in India's automotive business is witnessing significant growth, offering substantial opportunities for wiper blade manufacturers. As vehicle owners become more conscious of maintenance and seek quality replacements, the aftermarket becomes a lucrative space for providing upgraded and technologically advanced wiper blades.
Manufacturers can tap into this growing aftermarket demand by offering innovative products and establishing strong distribution networks. They can also consider moving their products to online platforms to expand their customer base and boost revenue
The below section shows the aftermarket segment dominating, based on the sales channel. It is forecast to thrive at a 7.5% CAGR between 2025 and 2035.
Based on vehicle type, the passenger car segment is anticipated to hold a dominant share through 2035. It is set to exhibit a CAGR of 7.3% during the forecast period.
| Top Segment (Sales Channel) | Aftermarket |
|---|---|
| Predicted CAGR (2025 to 2035) | 7.5% |
As per the latest wiper blade industry analysis, the aftermarket segment is anticipated to hold a significant volume share of 67.0% in 2025. It will likely progress at a CAGR of 7.5% CAGR during the forecast period.
Vehicle owners are becoming aware of the importance of regular maintenance to ensure optimal performance and safety. As consumers become more conscious of the need to replace worn-out wiper blades for effective visibility, the aftermarket sales channel becomes a preferred choice.
The aftermarket segment offers flexibility and a diverse range of product options, encouraging consumers to explore innovative and technologically advanced wiper blades. Manufacturers and retailers in the aftermarket can introduce new features, materials, and designs, meeting the evolving preferences of consumers who seek enhanced performance and durability.
Aftermarket wiper blades often provide cost-effective solutions compared to original equipment manufacturer (OEM) offerings. Vehicle owners seeking reliable and affordable replacements for their wiper blades are more inclined toward the aftermarket segment, thereby fostering segment growth.
| Top Segment (Vehicle Type) | Passenger Car |
|---|---|
| Projected CAGR (2025 to 2035) | 7.3% |
Based on vehicle type, the passenger car segment is projected to thrive at a 7.3% CAGR during the forecast period. It is set to attain a valuation of USD 4,928.9 million by 2035. This is attributable to the rising production and sales of passenger vehicles across APAC.
The APAC region is witnessing a steady increase in the number of passenger cars on the roads. As the vehicle fleet expands, the demand for essential components such as wiper blades grows proportionally.
The need for regular replacement and maintenance of wiper blades becomes more pronounced in a larger and more diverse fleet of passenger cars, contributing to sustained demand in this segment. The passenger car segment often experiences rapid technological advancements, and this includes innovations in wiper blade technology.
Manufacturers are introducing smart wiper systems, hybrid wiper blades, and other advanced features to enhance performance and convenience for car owners. Thanks to rising sales of passenger cars in the APAC region, companies are developing wiper blades specifically for passenger cars.
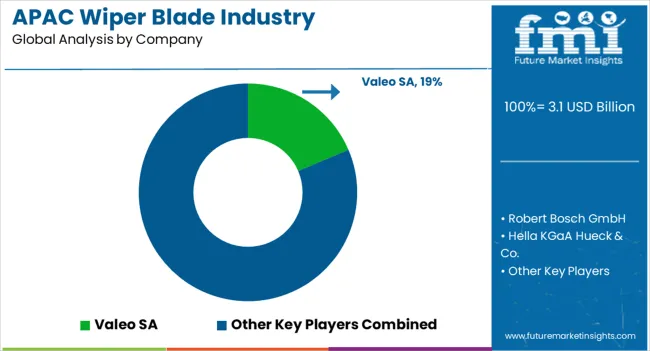
The APAC wiper blade business landscape is consolidated, with leading players accounting for about 60% to 65% share. Valeo SA, Ultra Wiring Connectivity System Ltd., Syndicate Wiper Systems Ltd., Robert Bosch GmbH, Hella KGaA Hueck & Co., Denso Corp., CAP Corporation, Doga, SA, ITW, Mitsuba Corporation, DRiV Incorporated, WIPE India, 3M, Spark Minda Group, XIONG SHUN AUTOMOBILE MATERIAL(XIAMEN)CO., LTD., TRICO Products Corp., Xiamen Meto Auto Parts Industry Co., Ltd., and Maruenu Inc. are the leading manufacturers and suppliers of wiper blades listed in the report.
Key wiper blade companies, including Robert Bosch, Denso Corp, Mitsuba Corporation, and Valeo SA, are focusing on developing novel wiper blades with innovative designs, durable materials, & advanced technologies for optimal visibility and driving safety. They are also showing an inclination toward implementing strategies such as facility expansions, price reduction, mergers, acquisitions, and partnerships to strengthen their footprint.
Recent Developments in APAC Wiper Blade Business-
| Attribute | Details |
|---|---|
| Estimated Value (2025) | USD 3.1 billion |
| Projected Size (2035) | USD 6.0 billion |
| Anticipated Growth Rate (2025 to 2035) | 6.8% |
| Historical Data | 2020 to 2025 |
| Forecast Period | 2025 to 2035 |
| Quantitative Units | Value (USD million) and Volume (Th. Units) |
| Report Coverage | Revenue Forecast, Volume Forecast, Company Ranking, Competitive Landscape, Growth Factors, Trends, and Pricing Analysis |
| Key Segments Covered | By Product Type, By Application, By Vehicle Type, By Size, By Sales Channel, By Country |
| Regions Covered | APAC |
| Key Countries Covered | China, Japan, South Korea, India, Thailand, Malaysia, Indonesia, Philippines, Singapore, Australia, Rest of APAC |
| Key Companies Profiled | Valeo SA; Robert Bosch GmbH; Hella KGaA Hueck & Co.; Denso Corp.; CAP Corporation; Syndicate Wiper Systems Ltd.; ITW; Mitsuba Corporation; Doga, SA; DRiV Incorporated; TRICO Products Corp.; WIPE India; 3M; Spark Minda Group; Ultra Wiring Connectivity System Ltd.; XIONG SHUN AUTOMOBILE MATERIAL XIAMEN CO., LTD.; Xiamen Meto Auto Parts Industry Co., Ltd.; Maruenu Inc.; NITTO-KOGYO CO., LTD.; Jenok Wiper Blade |
The global APAC wiper blade industry is estimated to be valued at USD 3.1 billion in 2025.
The market size for the APAC wiper blade industry is projected to reach USD 6.0 billion by 2035.
The APAC wiper blade industry is expected to grow at a 6.8% CAGR between 2025 and 2035.
The key product types in APAC wiper blade industry are flat, hybrid and conventional.
In terms of application, front segment to command 61.7% share in the APAC wiper blade industry in 2025.


Our Research Products

The "Full Research Suite" delivers actionable market intel, deep dives on markets or technologies, so clients act faster, cut risk, and unlock growth.

The Leaderboard benchmarks and ranks top vendors, classifying them as Established Leaders, Leading Challengers, or Disruptors & Challengers.

Locates where complements amplify value and substitutes erode it, forecasting net impact by horizon

We deliver granular, decision-grade intel: market sizing, 5-year forecasts, pricing, adoption, usage, revenue, and operational KPIs—plus competitor tracking, regulation, and value chains—across 60 countries broadly.

Spot the shifts before they hit your P&L. We track inflection points, adoption curves, pricing moves, and ecosystem plays to show where demand is heading, why it is changing, and what to do next across high-growth markets and disruptive tech

Real-time reads of user behavior. We track shifting priorities, perceptions of today’s and next-gen services, and provider experience, then pace how fast tech moves from trial to adoption, blending buyer, consumer, and channel inputs with social signals (#WhySwitch, #UX).

Partner with our analyst team to build a custom report designed around your business priorities. From analysing market trends to assessing competitors or crafting bespoke datasets, we tailor insights to your needs.
Supplier Intelligence
Discovery & Profiling
Capacity & Footprint
Performance & Risk
Compliance & Governance
Commercial Readiness
Who Supplies Whom
Scorecards & Shortlists
Playbooks & Docs
Category Intelligence
Definition & Scope
Demand & Use Cases
Cost Drivers
Market Structure
Supply Chain Map
Trade & Policy
Operating Norms
Deliverables
Buyer Intelligence
Account Basics
Spend & Scope
Procurement Model
Vendor Requirements
Terms & Policies
Entry Strategy
Pain Points & Triggers
Outputs
Pricing Analysis
Benchmarks
Trends
Should-Cost
Indexation
Landed Cost
Commercial Terms
Deliverables
Brand Analysis
Positioning & Value Prop
Share & Presence
Customer Evidence
Go-to-Market
Digital & Reputation
Compliance & Trust
KPIs & Gaps
Outputs
Full Research Suite comprises of:
Market outlook & trends analysis
Interviews & case studies
Strategic recommendations
Vendor profiles & capabilities analysis
5-year forecasts
8 regions and 60+ country-level data splits
Market segment data splits
12 months of continuous data updates
DELIVERED AS:
PDF EXCEL ONLINE
Wiper Blade Market Size and Share Forecast Outlook 2025 to 2035
Automotive Wiper Blade Market Growth – Trends & Forecast 2024 to 2034
APAC Heart Health Functional Food Market Size and Share Forecast Outlook 2025 to 2035
Blade-type Belt Cleaners Market Size and Share Forecast Outlook 2025 to 2035
Industry Analysis of Outbound Tourism in Germany Size and Share Forecast Outlook 2025 to 2035
Industry Analysis of Syringe and Needle in GCC Size and Share Forecast Outlook 2025 to 2035
Industry Analysis Non-commercial Acrylic Paint in the United States Size and Share Forecast Outlook 2025 to 2035
Industry Analysis of Medical Device Packaging in Southeast Asia Size and Share Forecast Outlook 2025 to 2035
Industry Analysis of Paper Bag in North America Size and Share Forecast Outlook 2025 to 2035
Industry Analysis of Lidding Film in the United States Size and Share Forecast Outlook 2025 to 2035
Industry Analysis of Last-mile Delivery Software in Japan Size and Share Forecast Outlook 2025 to 2035
Industry Analysis of Automotive Lightweight Body Panel in the United States Size and Share Forecast Outlook 2025 to 2035
Industry Analysis of Electronic Skin in Japan Size and Share Forecast Outlook 2025 to 2035
Industry Analysis of Electronic Skin in Korea Size and Share Forecast Outlook 2025 to 2035
Industry Analysis of Electronic Skin in Western Europe Size and Share Forecast Outlook 2025 to 2035
Blade Server Market Size and Share Forecast Outlook 2025 to 2035
APAC Waste Heat Recovery Systems Market Size and Share Forecast Outlook 2025 to 2035
APAC Fluoroelastomer Market Size and Share Forecast Outlook 2025 to 2035
APAC Commercial Glazing System Market Size and Share Forecast Outlook 2025 to 2035
APAC Solar Micro Inverters Market Analysis – Share, Size, and Forecast 2025 to 2035

Thank you!
You will receive an email from our Business Development Manager. Please be sure to check your SPAM/JUNK folder too.
Chat With
MaRIA