Blade Server Market Size and Share Forecast Outlook 2025 to 2035

The Blade Server Market is estimated to be valued at USD 18690.9 million in 2025 and is projected to reach USD 42085.0 million by 2035, registering a compound annual growth rate (CAGR) of 8.5% over the forecast period.
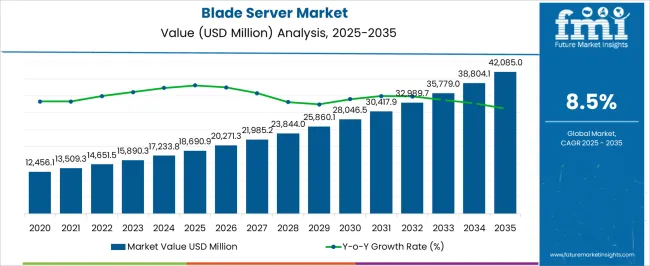
Quick Stats for Blade Server Market

  • Blade Server Market Industry Value (2025): USD 18690.9 million
  • Blade Server Market Forecast Value (2035): USD 42085.0 million
  • Blade Server Market Forecast CAGR: 8.5%
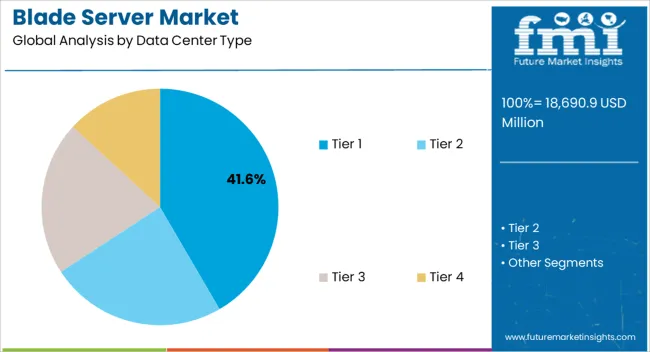
  • Leading Segment in Blade Server Market in 2025: Tier 1 (41.6%)
  • Key Growth Region in Blade Server Market: North America, Asia-Pacific, Europe
  • Top Key Players in Blade Server Market: Cisco Systems Inc., Dell Inc., Hewlett-Packard Company, Lenovo Group Limited, Fujitsu Limited, Hitachi Limited, NEC Corporation, Silicon Graphics International Corporation, Huawei Technologies Co. Ltd., Lenovo Group Limited

Blade Server Market Market Value Analysis

Metric Value
Blade Server Market Estimated Value in (2025 E) USD 18690.9 million
Blade Server Market Forecast Value in (2035 F) USD 42085.0 million
Forecast CAGR (2025 to 2035) 8.5%

Rationale for Segmental Growth in the Blade Server Market

The blade server market is experiencing accelerated growth due to the rising adoption of virtualization, cloud computing, and high performance applications across enterprises and service providers. Demand is being reinforced by the need for optimized data center infrastructure that ensures higher processing density, reduced power consumption, and simplified management.

Enterprises are increasingly investing in modular architectures to improve scalability while reducing operational costs. Additionally, the shift toward edge computing, AI driven workloads, and hyperscale cloud deployments is further intensifying demand for efficient and compact server designs.

Regulatory focus on energy efficiency and carbon footprint reduction is pushing organizations to adopt blade servers as a preferred infrastructure solution. The outlook remains positive as organizations prioritize agility, automation, and sustainable operations to support the growing digital economy.
Segmental Analysis

Insights into the Tier 1 Data Center Type Segment

Blade Server Market Analysis By Data Center Type

The tier 1 data center type segment is expected to account for 41.60% of market revenue by 2025, making it a leading contributor within the data center type category. Growth is being driven by expanding digital services in emerging economies and cost conscious enterprises seeking efficient but reliable server infrastructure.

Tier 1 facilities provide essential support for businesses with moderate workloads, making them suitable for organizations in early stages of digital transformation.

The affordability and operational simplicity of tier 1 centers have reinforced their widespread adoption, establishing this category as a key driver of blade server market expansion.
Insights into the Professional Services Segment

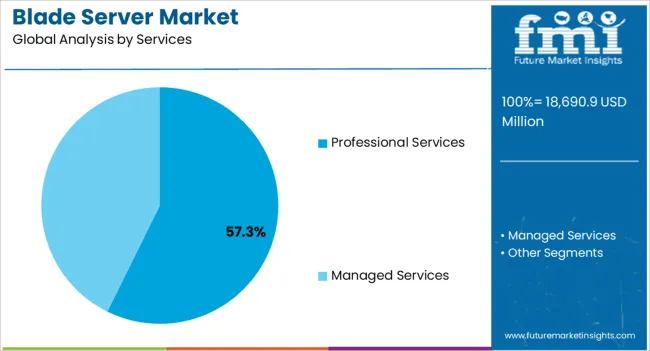
Blade Server Market Analysis By Services

The professional services segment is projected to hold 57.30% of overall revenue by 2025 within the services category, making it the dominant segment. This leadership is attributed to the reliance of enterprises on expert deployment, consulting, and integration support when adopting blade server infrastructure.

Professional services ensure that systems are optimized for workload requirements, scalability, and energy efficiency, which are critical in complex IT environments. The ability to streamline implementation and reduce downtime has further strengthened demand.

Consequently, professional services have become a cornerstone for organizations aiming to achieve faster returns on investment from their blade server deployments.
Insights into the Cloud Service Provider Application Segment

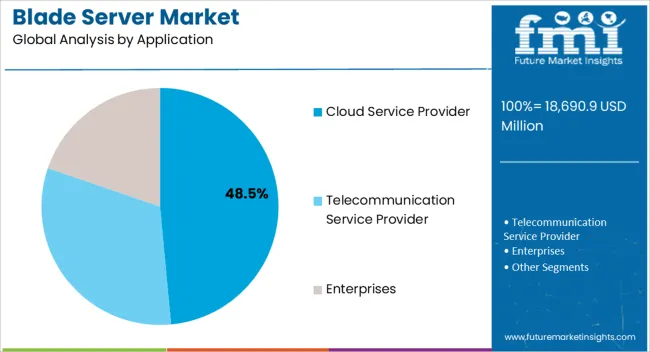
Blade Server Market Analysis By Application

The cloud service provider segment is projected to represent 48.50% of the overall market by 2025 within the application category, positioning it as the most significant segment. Demand is being driven by the exponential growth of cloud based platforms, digital content consumption, and enterprise migration to cloud environments.

Blade servers are favored for their scalability, high density computing, and energy efficiency, all of which align with the requirements of hyperscale cloud operators. The need to support AI, big data analytics, and storage intensive applications has further reinforced their adoption.

As cloud providers continue to expand global data center capacity, blade servers remain central to their infrastructure strategies, consolidating this segment’s market leadership.

Major Drivers that are Positively Impacting the Blade Server Market

By allowing more processing power in fewer places, businesses may lower their primary costs. Demand for blade servers is high as they can be used to accomplish this due to their highly compact design, which uses less energy and physical space.

Secondary expenses, such as hardware cabling costs, facilities charges, as well as the personnel hours needed to configure and manage systems, also need reduction. The implementation of blade servers can curb these expenses, making the processes work smoothly.

Blade servers are increasingly being deployed, as it resolves a lot of challenges faced by various enterprises. These challenges include improving service availability, reducing operation costs, and increasing consistency and predictability.

The blade server market share is likely to experience notable growth, as consumers seek reduced operational costs and energy while expanding their IT infrastructure. Additionally, traditional rack and tower servers occupy a large surface area and huge power, and are hence, being replaced by blade servers.

End Users See Blade Server Heavy on their Pockets

Incorporating expensive technology, as well as vendor lock-in, requires high capital investment. This is expected to be a major drawback that obstructs the blade server market share.

Although one blade server does not create a heat problem - the installment of several blade servers is known to generate excessive heat. This is likely to curb the demand for these servers, as this issue can decrease their functionality.

However, the blade server adoption offers better advantages over the setup, provisioning, and upkeep of large server farms. This is anticipated to open up possibilities for its development and promote the market's growth.

Category Data Center Type
Leading Segment Tier 4
Market Share 32.3%
Category Application
Leading Segment Cloud Service Provider
Market Share 43.3%

North America Bags Over One-third of the Market Share

North America accounts for the highest share of the blade server market, with a significant revenue of 37.6% in 2025. This is attributed to the presence of several data-driven enterprises.

The USA government aimed to deliver better services to the public while increasing return-on-investment to taxpayers. This was done by launching the Data Center Optimization Initiative (DCOI) and consolidating many data centers around the country.

This region is experiencing a shift from individual device and system storage to the core cloud and edge of networks. Furthermore, the need for immediate processing of the vast amount of data being acquired on a real-time basis is likely to increase as a result of the extensive investments in AI infrastructure by the companies in this region.

How is the Start-up Ecosystem in the Blade Server Market?

Partnerships and acquisitions, as well as new product launches, have been the key strategies of the market players. The growing demand for blade servers is expected to strengthen their product portfolios and expand their geographic presence.

The combination of streamlined tens to hundreds of server management, lower prices, better efficiency, and more effective usage of costly data center capacity are all the pivotal factors that have rendered blade servers tempting.

Start-up companies are contributing to the growing demand with their own manufacturing strategies.
  • Stackery - They provide a serverless platform to design, deploy, and monitor cloud-native applications. Users need not provide or manage servers with the code running only when it is needed and pay only for the computing time used. Features include real-time visibility into serverless infrastructure, CI/CD turnkey automation, isolated testing and production environments, and function code packaging.
  • JumpCloud - They offer a cloud-based directory service for user and IT resource authentication. They provide a service that authenticates, authorizes, and manages the identities of business employees and the systems and IT resources. This service securely connects employees with systems, applications, and other resources through a single unified cloud-based directory.

Key Companies Transforming the Blade Server Market Space

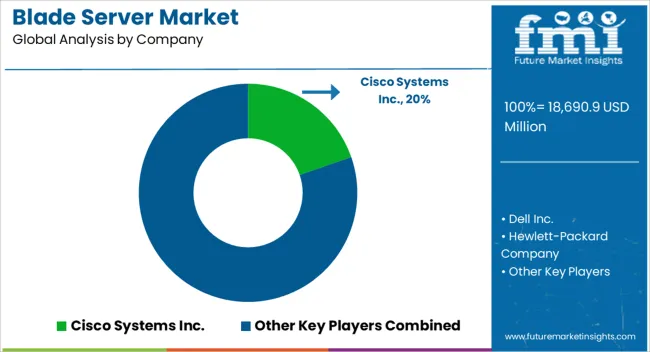
Blade Server Market Analysis By Company

The presence of significant players in the market creates fierce competition. This surges numerous research and development activities, along with mergers and acquisitions, which eventually promote the growth of the global blade server market size.

Key players like Cisco Systems Inc, Hewlett-Packard Company, and Hewlett-Packard Company offer high-technology services and products that support computers and related products.

Moreover, companies are focusing on providing a wide variety of hardware components, as well as software and related services, to consumers, small and medium-sized businesses (SMBs), and large enterprises, including customers in the government, health, and education sectors.

OTHER MARKET PARTICIPANTS OF THE BLADE SERVER MARKET

  • Hitachi Limited
  • NEC Corporation
  • Silicon Graphics International Corporation
  • Huawei Technologies Co. Ltd.
  • Lenovo Group Limited

Some Of The Recent Developments In The Blade Server Market Are:

  • In April 2020, Fujitsu released its latest blade server PRIMERGY CX400 M4, which is a multi-node blade server that enables the flexibility to adapt to various high-performance and technical computing workloads.
  • In October 2020, Microsoft announced the xCloud project, which is a new custom blade server that hosts the internal components of four Xbox One consoles, and associated infrastructure which will offer the live streaming gaming experience to users.
  • In March 2020, HP entered into a partnership with Mesosphere and developed new SKUs that combine the infrastructure of HPE BladeSystem, HPE 3PAR StoreServ 8200, and HPE FlexFabric 10 GB SAN Switches.
  • In June 2020, Nortek Air Solutions entered into a partnership with Facebook to introduce cooling techniques that are intended to increase the energy and water performance of data centers.

Report Scope

Report Attributes Details
Growth Rate CAGR of 8.5% from 2025 to 2035
The base year for estimation 2025
Historical data 2020 to 2025
Forecast period 2025 to 2035
Quantitative units Revenue in USD million and CAGR from 2025 to 2035
Report Coverage Revenue forecast, volume forecast, company ranking, competitive landscape, growth factors, and trends, Pricing Analysis
Segments Covered Data Center Type, Services, Application, End Users, Region
Regional scope North America; Western Europe; Eastern Europe; Middle East; Afric;, ASEAN; South Asia; Rest of Asia; Australia; and New Zealand
Country scope USA, Canada, Mexico, Germany, United Kingdom, France, Italy, Spain, Russia, Belgium, Poland, Czech Republic, China, India, Japan, Australia, Brazil, Argentina, Colombia, Saudi Arabia, United Arab Emirates, Iran, South Africa
Key companies profiled Cisco Systems Inc.; Dell Inc.; Hewlett-Packard Company; Lenovo Group Limited; Fujitsu Limited; Hitachi Limited; NEC Corporation; Silicon Graphics International Corporation; Huawei Technologies Co. Ltd.; Lenovo Group Limited
Customization scope Free report customization (equivalent to up to 8 analysts' working days) with purchase. Addition or alteration to country, regional & segment scope.
Pricing and purchase options Avail customized purchase options to meet your exact research needs.

Key Segments Profiled in the Blade Server Market Survey

By Data Center Type:

  • Tier 1
  • Tier 2
  • Tier 3
  • Tier 4

By Services:

  • Professional Services
  • Managed Services

By Application:

  • Cloud Service Provider
  • Telecommunication Service Provider
  • Enterprises

By End Users:

  • BSFI
  • IT and Telecommunications
  • Transportation and Logistics
  • Manufacturing
  • Government and Defence
  • E-commerce
  • Healthcare
  • Energy and Utilities
  • Retail
  • Media and Entertainment

By Region:

  • North America
  • Latin America
  • Asia Pacific
  • Middle East and Africa
  • Europe

Frequently Asked Questions

How big is the blade server market in 2025?

The global blade server market is estimated to be valued at USD 18,690.9 million in 2025.

What will be the size of blade server market in 2035?

The market size for the blade server market is projected to reach USD 42,085.0 million by 2035.

How much will be the blade server market growth between 2025 and 2035?

The blade server market is expected to grow at a 8.5% CAGR between 2025 and 2035.

What are the key product types in the blade server market?

The key product types in blade server market are tier 1, tier 2, tier 3 and tier 4.

Which services segment to contribute significant share in the blade server market in 2025?

In terms of services, professional services segment to command 57.3% share in the blade server market in 2025.

Table of Content

  1. Executive Summary
    • Global Market Outlook
    • Demand-side Trends
    • Supply-side Trends
    • Technology Roadmap Analysis
    • Analysis and Recommendations
  2. Market Overview
    • Market Coverage / Taxonomy
    • Market Definition / Scope / Limitations
  3. Market Background
    • Market Dynamics
      • Drivers
      • Restraints
      • Opportunity
      • Trends
    • Scenario Forecast
      • Demand in Optimistic Scenario
      • Demand in Likely Scenario
      • Demand in Conservative Scenario
    • Opportunity Map Analysis
    • Product Life Cycle Analysis
    • Supply Chain Analysis
    • Investment Feasibility Matrix
    • Value Chain Analysis
    • PESTLE and Porter’s Analysis
    • Regulatory Landscape
    • Regional Parent Market Outlook
    • Production and Consumption Statistics
    • Import and Export Statistics
  4. Global Market Analysis 2020 to 2024 and Forecast, 2025 to 2035
    • Historical Market Size Value (USD Million) Analysis, 2020 to 2024
    • Current and Future Market Size Value (USD Million) Projections, 2025 to 2035
      • Y-o-Y Growth Trend Analysis
      • Absolute $ Opportunity Analysis
  5. Global Market Pricing Analysis 2020 to 2024 and Forecast 2025 to 2035
  6. Global Market Analysis 2020 to 2024 and Forecast 2025 to 2035, By Data Center Type
    • Introduction / Key Findings
    • Historical Market Size Value (USD Million) Analysis By Data Center Type , 2020 to 2024
    • Current and Future Market Size Value (USD Million) Analysis and Forecast By Data Center Type , 2025 to 2035
      • Tier 1
      • Tier 2
      • Tier 3
      • Tier 4
    • Y-o-Y Growth Trend Analysis By Data Center Type , 2020 to 2024
    • Absolute $ Opportunity Analysis By Data Center Type , 2025 to 2035
  7. Global Market Analysis 2020 to 2024 and Forecast 2025 to 2035, By Services
    • Introduction / Key Findings
    • Historical Market Size Value (USD Million) Analysis By Services, 2020 to 2024
    • Current and Future Market Size Value (USD Million) Analysis and Forecast By Services, 2025 to 2035
      • Professional Services
      • Managed Services
    • Y-o-Y Growth Trend Analysis By Services, 2020 to 2024
    • Absolute $ Opportunity Analysis By Services, 2025 to 2035
  8. Global Market Analysis 2020 to 2024 and Forecast 2025 to 2035, By Application
    • Introduction / Key Findings
    • Historical Market Size Value (USD Million) Analysis By Application, 2020 to 2024
    • Current and Future Market Size Value (USD Million) Analysis and Forecast By Application, 2025 to 2035
      • Cloud Service Provider
      • Telecommunication Service Provider
      • Enterprises
    • Y-o-Y Growth Trend Analysis By Application, 2020 to 2024
    • Absolute $ Opportunity Analysis By Application, 2025 to 2035
  9. Global Market Analysis 2020 to 2024 and Forecast 2025 to 2035, By End Users
    • Introduction / Key Findings
    • Historical Market Size Value (USD Million) Analysis By End Users, 2020 to 2024
    • Current and Future Market Size Value (USD Million) Analysis and Forecast By End Users, 2025 to 2035
      • BSFI
      • IT and Telecommunications
      • Transportation And Logistics
      • Manufacturing
      • Government And Defence
      • E-commerce
      • Healthcare
      • Energy And Utilities
      • Retail
      • Media And Entertainment
    • Y-o-Y Growth Trend Analysis By End Users, 2020 to 2024
    • Absolute $ Opportunity Analysis By End Users, 2025 to 2035
  10. Global Market Analysis 2020 to 2024 and Forecast 2025 to 2035, By Region
    • Introduction
    • Historical Market Size Value (USD Million) Analysis By Region, 2020 to 2024
    • Current Market Size Value (USD Million) Analysis and Forecast By Region, 2025 to 2035
      • North America
      • Latin America
      • Western Europe
      • Eastern Europe
      • East Asia
      • South Asia and Pacific
      • Middle East & Africa
    • Market Attractiveness Analysis By Region
  11. North America Market Analysis 2020 to 2024 and Forecast 2025 to 2035, By Country
    • Historical Market Size Value (USD Million) Trend Analysis By Market Taxonomy, 2020 to 2024
    • Market Size Value (USD Million) Forecast By Market Taxonomy, 2025 to 2035
      • By Country
        • USA
        • Canada
        • Mexico
      • By Data Center Type
      • By Services
      • By Application
      • By End Users
    • Market Attractiveness Analysis
      • By Country
      • By Data Center Type
      • By Services
      • By Application
      • By End Users
    • Key Takeaways
  12. Latin America Market Analysis 2020 to 2024 and Forecast 2025 to 2035, By Country
    • Historical Market Size Value (USD Million) Trend Analysis By Market Taxonomy, 2020 to 2024
    • Market Size Value (USD Million) Forecast By Market Taxonomy, 2025 to 2035
      • By Country
        • Brazil
        • Chile
        • Rest of Latin America
      • By Data Center Type
      • By Services
      • By Application
      • By End Users
    • Market Attractiveness Analysis
      • By Country
      • By Data Center Type
      • By Services
      • By Application
      • By End Users
    • Key Takeaways
  13. Western Europe Market Analysis 2020 to 2024 and Forecast 2025 to 2035, By Country
    • Historical Market Size Value (USD Million) Trend Analysis By Market Taxonomy, 2020 to 2024
    • Market Size Value (USD Million) Forecast By Market Taxonomy, 2025 to 2035
      • By Country
        • Germany
        • UK
        • Italy
        • Spain
        • France
        • Nordic
        • BENELUX
        • Rest of Western Europe
      • By Data Center Type
      • By Services
      • By Application
      • By End Users
    • Market Attractiveness Analysis
      • By Country
      • By Data Center Type
      • By Services
      • By Application
      • By End Users
    • Key Takeaways
  14. Eastern Europe Market Analysis 2020 to 2024 and Forecast 2025 to 2035, By Country
    • Historical Market Size Value (USD Million) Trend Analysis By Market Taxonomy, 2020 to 2024
    • Market Size Value (USD Million) Forecast By Market Taxonomy, 2025 to 2035
      • By Country
        • Russia
        • Poland
        • Hungary
        • Balkan & Baltic
        • Rest of Eastern Europe
      • By Data Center Type
      • By Services
      • By Application
      • By End Users
    • Market Attractiveness Analysis
      • By Country
      • By Data Center Type
      • By Services
      • By Application
      • By End Users
    • Key Takeaways
  15. East Asia Market Analysis 2020 to 2024 and Forecast 2025 to 2035, By Country
    • Historical Market Size Value (USD Million) Trend Analysis By Market Taxonomy, 2020 to 2024
    • Market Size Value (USD Million) Forecast By Market Taxonomy, 2025 to 2035
      • By Country
        • China
        • Japan
        • South Korea
      • By Data Center Type
      • By Services
      • By Application
      • By End Users
    • Market Attractiveness Analysis
      • By Country
      • By Data Center Type
      • By Services
      • By Application
      • By End Users
    • Key Takeaways
  16. South Asia and Pacific Market Analysis 2020 to 2024 and Forecast 2025 to 2035, By Country
    • Historical Market Size Value (USD Million) Trend Analysis By Market Taxonomy, 2020 to 2024
    • Market Size Value (USD Million) Forecast By Market Taxonomy, 2025 to 2035
      • By Country
        • India
        • ASEAN
        • Australia & New Zealand
        • Rest of South Asia and Pacific
      • By Data Center Type
      • By Services
      • By Application
      • By End Users
    • Market Attractiveness Analysis
      • By Country
      • By Data Center Type
      • By Services
      • By Application
      • By End Users
    • Key Takeaways
  17. Middle East & Africa Market Analysis 2020 to 2024 and Forecast 2025 to 2035, By Country
    • Historical Market Size Value (USD Million) Trend Analysis By Market Taxonomy, 2020 to 2024
    • Market Size Value (USD Million) Forecast By Market Taxonomy, 2025 to 2035
      • By Country
        • Kingdom of Saudi Arabia
        • Other GCC Countries
        • Turkiye
        • South Africa
        • Other African Union
        • Rest of Middle East & Africa
      • By Data Center Type
      • By Services
      • By Application
      • By End Users
    • Market Attractiveness Analysis
      • By Country
      • By Data Center Type
      • By Services
      • By Application
      • By End Users
    • Key Takeaways
  18. Key Countries Market Analysis
    • USA
      • Pricing Analysis
      • Market Share Analysis, 2024
        • By Data Center Type
        • By Services
        • By Application
        • By End Users
    • Canada
      • Pricing Analysis
      • Market Share Analysis, 2024
        • By Data Center Type
        • By Services
        • By Application
        • By End Users
    • Mexico
      • Pricing Analysis
      • Market Share Analysis, 2024
        • By Data Center Type
        • By Services
        • By Application
        • By End Users
    • Brazil
      • Pricing Analysis
      • Market Share Analysis, 2024
        • By Data Center Type
        • By Services
        • By Application
        • By End Users
    • Chile
      • Pricing Analysis
      • Market Share Analysis, 2024
        • By Data Center Type
        • By Services
        • By Application
        • By End Users
    • Germany
      • Pricing Analysis
      • Market Share Analysis, 2024
        • By Data Center Type
        • By Services
        • By Application
        • By End Users
    • UK
      • Pricing Analysis
      • Market Share Analysis, 2024
        • By Data Center Type
        • By Services
        • By Application
        • By End Users
    • Italy
      • Pricing Analysis
      • Market Share Analysis, 2024
        • By Data Center Type
        • By Services
        • By Application
        • By End Users
    • Spain
      • Pricing Analysis
      • Market Share Analysis, 2024
        • By Data Center Type
        • By Services
        • By Application
        • By End Users
    • France
      • Pricing Analysis
      • Market Share Analysis, 2024
        • By Data Center Type
        • By Services
        • By Application
        • By End Users
    • India
      • Pricing Analysis
      • Market Share Analysis, 2024
        • By Data Center Type
        • By Services
        • By Application
        • By End Users
    • ASEAN
      • Pricing Analysis
      • Market Share Analysis, 2024
        • By Data Center Type
        • By Services
        • By Application
        • By End Users
    • Australia & New Zealand
      • Pricing Analysis
      • Market Share Analysis, 2024
        • By Data Center Type
        • By Services
        • By Application
        • By End Users
    • China
      • Pricing Analysis
      • Market Share Analysis, 2024
        • By Data Center Type
        • By Services
        • By Application
        • By End Users
    • Japan
      • Pricing Analysis
      • Market Share Analysis, 2024
        • By Data Center Type
        • By Services
        • By Application
        • By End Users
    • South Korea
      • Pricing Analysis
      • Market Share Analysis, 2024
        • By Data Center Type
        • By Services
        • By Application
        • By End Users
    • Russia
      • Pricing Analysis
      • Market Share Analysis, 2024
        • By Data Center Type
        • By Services
        • By Application
        • By End Users
    • Poland
      • Pricing Analysis
      • Market Share Analysis, 2024
        • By Data Center Type
        • By Services
        • By Application
        • By End Users
    • Hungary
      • Pricing Analysis
      • Market Share Analysis, 2024
        • By Data Center Type
        • By Services
        • By Application
        • By End Users
    • Kingdom of Saudi Arabia
      • Pricing Analysis
      • Market Share Analysis, 2024
        • By Data Center Type
        • By Services
        • By Application
        • By End Users
    • Turkiye
      • Pricing Analysis
      • Market Share Analysis, 2024
        • By Data Center Type
        • By Services
        • By Application
        • By End Users
    • South Africa
      • Pricing Analysis
      • Market Share Analysis, 2024
        • By Data Center Type
        • By Services
        • By Application
        • By End Users
  19. Market Structure Analysis
    • Competition Dashboard
    • Competition Benchmarking
    • Market Share Analysis of Top Players
      • By Regional
      • By Data Center Type
      • By Services
      • By Application
      • By End Users
  20. Competition Analysis
    • Competition Deep Dive
      • Cisco Systems Inc.
        • Overview
        • Product Portfolio
        • Profitability by Market Segments (Product/Age /Sales Channel/Region)
        • Sales Footprint
        • Strategy Overview
          • Marketing Strategy
          • Product Strategy
          • Channel Strategy
      • Dell Inc.
      • Hewlett-Packard Company
      • Lenovo Group Limited
      • Fujitsu Limited
      • Hitachi Limited
      • NEC Corporation
      • Silicon Graphics International Corporation
      • Huawei Technologies Co. Ltd.
      • Lenovo Group Limited
  21. Assumptions & Acronyms Used
  22. Research Methodology

List of Tables

  • Table 1: Global Market Value (USD Million) Forecast by Region, 2020 to 2035
  • Table 2: Global Market Value (USD Million) Forecast by Data Center Type , 2020 to 2035
  • Table 3: Global Market Value (USD Million) Forecast by Services, 2020 to 2035
  • Table 4: Global Market Value (USD Million) Forecast by Application, 2020 to 2035
  • Table 5: Global Market Value (USD Million) Forecast by End Users, 2020 to 2035
  • Table 6: North America Market Value (USD Million) Forecast by Country, 2020 to 2035
  • Table 7: North America Market Value (USD Million) Forecast by Data Center Type , 2020 to 2035
  • Table 8: North America Market Value (USD Million) Forecast by Services, 2020 to 2035
  • Table 9: North America Market Value (USD Million) Forecast by Application, 2020 to 2035
  • Table 10: North America Market Value (USD Million) Forecast by End Users, 2020 to 2035
  • Table 11: Latin America Market Value (USD Million) Forecast by Country, 2020 to 2035
  • Table 12: Latin America Market Value (USD Million) Forecast by Data Center Type , 2020 to 2035
  • Table 13: Latin America Market Value (USD Million) Forecast by Services, 2020 to 2035
  • Table 14: Latin America Market Value (USD Million) Forecast by Application, 2020 to 2035
  • Table 15: Latin America Market Value (USD Million) Forecast by End Users, 2020 to 2035
  • Table 16: Western Europe Market Value (USD Million) Forecast by Country, 2020 to 2035
  • Table 17: Western Europe Market Value (USD Million) Forecast by Data Center Type , 2020 to 2035
  • Table 18: Western Europe Market Value (USD Million) Forecast by Services, 2020 to 2035
  • Table 19: Western Europe Market Value (USD Million) Forecast by Application, 2020 to 2035
  • Table 20: Western Europe Market Value (USD Million) Forecast by End Users, 2020 to 2035
  • Table 21: Eastern Europe Market Value (USD Million) Forecast by Country, 2020 to 2035
  • Table 22: Eastern Europe Market Value (USD Million) Forecast by Data Center Type , 2020 to 2035
  • Table 23: Eastern Europe Market Value (USD Million) Forecast by Services, 2020 to 2035
  • Table 24: Eastern Europe Market Value (USD Million) Forecast by Application, 2020 to 2035
  • Table 25: Eastern Europe Market Value (USD Million) Forecast by End Users, 2020 to 2035
  • Table 26: East Asia Market Value (USD Million) Forecast by Country, 2020 to 2035
  • Table 27: East Asia Market Value (USD Million) Forecast by Data Center Type , 2020 to 2035
  • Table 28: East Asia Market Value (USD Million) Forecast by Services, 2020 to 2035
  • Table 29: East Asia Market Value (USD Million) Forecast by Application, 2020 to 2035
  • Table 30: East Asia Market Value (USD Million) Forecast by End Users, 2020 to 2035
  • Table 31: South Asia and Pacific Market Value (USD Million) Forecast by Country, 2020 to 2035
  • Table 32: South Asia and Pacific Market Value (USD Million) Forecast by Data Center Type , 2020 to 2035
  • Table 33: South Asia and Pacific Market Value (USD Million) Forecast by Services, 2020 to 2035
  • Table 34: South Asia and Pacific Market Value (USD Million) Forecast by Application, 2020 to 2035
  • Table 35: South Asia and Pacific Market Value (USD Million) Forecast by End Users, 2020 to 2035
  • Table 36: Middle East & Africa Market Value (USD Million) Forecast by Country, 2020 to 2035
  • Table 37: Middle East & Africa Market Value (USD Million) Forecast by Data Center Type , 2020 to 2035
  • Table 38: Middle East & Africa Market Value (USD Million) Forecast by Services, 2020 to 2035
  • Table 39: Middle East & Africa Market Value (USD Million) Forecast by Application, 2020 to 2035
  • Table 40: Middle East & Africa Market Value (USD Million) Forecast by End Users, 2020 to 2035

List of Figures

  • Figure 1: Global Market Pricing Analysis
  • Figure 2: Global Market Value (USD Million) Forecast 2020 to 2035
  • Figure 3: Global Market Value Share and BPS Analysis by Data Center Type , 2025 and 2035
  • Figure 4: Global Market Y-o-Y Growth Comparison by Data Center Type , 2025–2035
  • Figure 5: Global Market Attractiveness Analysis by Data Center Type
  • Figure 6: Global Market Value Share and BPS Analysis by Services, 2025 and 2035
  • Figure 7: Global Market Y-o-Y Growth Comparison by Services, 2025–2035
  • Figure 8: Global Market Attractiveness Analysis by Services
  • Figure 9: Global Market Value Share and BPS Analysis by Application, 2025 and 2035
  • Figure 10: Global Market Y-o-Y Growth Comparison by Application, 2025–2035
  • Figure 11: Global Market Attractiveness Analysis by Application
  • Figure 12: Global Market Value Share and BPS Analysis by End Users, 2025 and 2035
  • Figure 13: Global Market Y-o-Y Growth Comparison by End Users, 2025–2035
  • Figure 14: Global Market Attractiveness Analysis by End Users
  • Figure 15: Global Market Value (USD Million) Share and BPS Analysis by Region, 2025 and 2035
  • Figure 16: Global Market Y-o-Y Growth Comparison by Region, 2025–2035
  • Figure 17: Global Market Attractiveness Analysis by Region
  • Figure 18: North America Market Incremental Dollar Opportunity, 2025–2035
  • Figure 19: Latin America Market Incremental Dollar Opportunity, 2025–2035
  • Figure 20: Western Europe Market Incremental Dollar Opportunity, 2025–2035
  • Figure 21: Eastern Europe Market Incremental Dollar Opportunity, 2025–2035
  • Figure 22: East Asia Market Incremental Dollar Opportunity, 2025–2035
  • Figure 23: South Asia and Pacific Market Incremental Dollar Opportunity, 2025–2035
  • Figure 24: Middle East & Africa Market Incremental Dollar Opportunity, 2025–2035
  • Figure 25: North America Market Value Share and BPS Analysis by Country, 2025 and 2035
  • Figure 26: North America Market Value Share and BPS Analysis by Data Center Type , 2025 and 2035
  • Figure 27: North America Market Y-o-Y Growth Comparison by Data Center Type , 2025–2035
  • Figure 28: North America Market Attractiveness Analysis by Data Center Type
  • Figure 29: North America Market Value Share and BPS Analysis by Services, 2025 and 2035
  • Figure 30: North America Market Y-o-Y Growth Comparison by Services, 2025–2035
  • Figure 31: North America Market Attractiveness Analysis by Services
  • Figure 32: North America Market Value Share and BPS Analysis by Application, 2025 and 2035
  • Figure 33: North America Market Y-o-Y Growth Comparison by Application, 2025–2035
  • Figure 34: North America Market Attractiveness Analysis by Application
  • Figure 35: North America Market Value Share and BPS Analysis by End Users, 2025 and 2035
  • Figure 36: North America Market Y-o-Y Growth Comparison by End Users, 2025–2035
  • Figure 37: North America Market Attractiveness Analysis by End Users
  • Figure 38: Latin America Market Value Share and BPS Analysis by Country, 2025 and 2035
  • Figure 39: Latin America Market Value Share and BPS Analysis by Data Center Type , 2025 and 2035
  • Figure 40: Latin America Market Y-o-Y Growth Comparison by Data Center Type , 2025–2035
  • Figure 41: Latin America Market Attractiveness Analysis by Data Center Type
  • Figure 42: Latin America Market Value Share and BPS Analysis by Services, 2025 and 2035
  • Figure 43: Latin America Market Y-o-Y Growth Comparison by Services, 2025–2035
  • Figure 44: Latin America Market Attractiveness Analysis by Services
  • Figure 45: Latin America Market Value Share and BPS Analysis by Application, 2025 and 2035
  • Figure 46: Latin America Market Y-o-Y Growth Comparison by Application, 2025–2035
  • Figure 47: Latin America Market Attractiveness Analysis by Application
  • Figure 48: Latin America Market Value Share and BPS Analysis by End Users, 2025 and 2035
  • Figure 49: Latin America Market Y-o-Y Growth Comparison by End Users, 2025–2035
  • Figure 50: Latin America Market Attractiveness Analysis by End Users
  • Figure 51: Western Europe Market Value Share and BPS Analysis by Country, 2025 and 2035
  • Figure 52: Western Europe Market Value Share and BPS Analysis by Data Center Type , 2025 and 2035
  • Figure 53: Western Europe Market Y-o-Y Growth Comparison by Data Center Type , 2025–2035
  • Figure 54: Western Europe Market Attractiveness Analysis by Data Center Type
  • Figure 55: Western Europe Market Value Share and BPS Analysis by Services, 2025 and 2035
  • Figure 56: Western Europe Market Y-o-Y Growth Comparison by Services, 2025–2035
  • Figure 57: Western Europe Market Attractiveness Analysis by Services
  • Figure 58: Western Europe Market Value Share and BPS Analysis by Application, 2025 and 2035
  • Figure 59: Western Europe Market Y-o-Y Growth Comparison by Application, 2025–2035
  • Figure 60: Western Europe Market Attractiveness Analysis by Application
  • Figure 61: Western Europe Market Value Share and BPS Analysis by End Users, 2025 and 2035
  • Figure 62: Western Europe Market Y-o-Y Growth Comparison by End Users, 2025–2035
  • Figure 63: Western Europe Market Attractiveness Analysis by End Users
  • Figure 64: Eastern Europe Market Value Share and BPS Analysis by Country, 2025 and 2035
  • Figure 65: Eastern Europe Market Value Share and BPS Analysis by Data Center Type , 2025 and 2035
  • Figure 66: Eastern Europe Market Y-o-Y Growth Comparison by Data Center Type , 2025–2035
  • Figure 67: Eastern Europe Market Attractiveness Analysis by Data Center Type
  • Figure 68: Eastern Europe Market Value Share and BPS Analysis by Services, 2025 and 2035
  • Figure 69: Eastern Europe Market Y-o-Y Growth Comparison by Services, 2025–2035
  • Figure 70: Eastern Europe Market Attractiveness Analysis by Services
  • Figure 71: Eastern Europe Market Value Share and BPS Analysis by Application, 2025 and 2035
  • Figure 72: Eastern Europe Market Y-o-Y Growth Comparison by Application, 2025–2035
  • Figure 73: Eastern Europe Market Attractiveness Analysis by Application
  • Figure 74: Eastern Europe Market Value Share and BPS Analysis by End Users, 2025 and 2035
  • Figure 75: Eastern Europe Market Y-o-Y Growth Comparison by End Users, 2025–2035
  • Figure 76: Eastern Europe Market Attractiveness Analysis by End Users
  • Figure 77: East Asia Market Value Share and BPS Analysis by Country, 2025 and 2035
  • Figure 78: East Asia Market Value Share and BPS Analysis by Data Center Type , 2025 and 2035
  • Figure 79: East Asia Market Y-o-Y Growth Comparison by Data Center Type , 2025–2035
  • Figure 80: East Asia Market Attractiveness Analysis by Data Center Type
  • Figure 81: East Asia Market Value Share and BPS Analysis by Services, 2025 and 2035
  • Figure 82: East Asia Market Y-o-Y Growth Comparison by Services, 2025–2035
  • Figure 83: East Asia Market Attractiveness Analysis by Services
  • Figure 84: East Asia Market Value Share and BPS Analysis by Application, 2025 and 2035
  • Figure 85: East Asia Market Y-o-Y Growth Comparison by Application, 2025–2035
  • Figure 86: East Asia Market Attractiveness Analysis by Application
  • Figure 87: East Asia Market Value Share and BPS Analysis by End Users, 2025 and 2035
  • Figure 88: East Asia Market Y-o-Y Growth Comparison by End Users, 2025–2035
  • Figure 89: East Asia Market Attractiveness Analysis by End Users
  • Figure 90: South Asia and Pacific Market Value Share and BPS Analysis by Country, 2025 and 2035
  • Figure 91: South Asia and Pacific Market Value Share and BPS Analysis by Data Center Type , 2025 and 2035
  • Figure 92: South Asia and Pacific Market Y-o-Y Growth Comparison by Data Center Type , 2025–2035
  • Figure 93: South Asia and Pacific Market Attractiveness Analysis by Data Center Type
  • Figure 94: South Asia and Pacific Market Value Share and BPS Analysis by Services, 2025 and 2035
  • Figure 95: South Asia and Pacific Market Y-o-Y Growth Comparison by Services, 2025–2035
  • Figure 96: South Asia and Pacific Market Attractiveness Analysis by Services
  • Figure 97: South Asia and Pacific Market Value Share and BPS Analysis by Application, 2025 and 2035
  • Figure 98: South Asia and Pacific Market Y-o-Y Growth Comparison by Application, 2025–2035
  • Figure 99: South Asia and Pacific Market Attractiveness Analysis by Application
  • Figure 100: South Asia and Pacific Market Value Share and BPS Analysis by End Users, 2025 and 2035
  • Figure 101: South Asia and Pacific Market Y-o-Y Growth Comparison by End Users, 2025–2035
  • Figure 102: South Asia and Pacific Market Attractiveness Analysis by End Users
  • Figure 103: Middle East & Africa Market Value Share and BPS Analysis by Country, 2025 and 2035
  • Figure 104: Middle East & Africa Market Value Share and BPS Analysis by Data Center Type , 2025 and 2035
  • Figure 105: Middle East & Africa Market Y-o-Y Growth Comparison by Data Center Type , 2025–2035
  • Figure 106: Middle East & Africa Market Attractiveness Analysis by Data Center Type
  • Figure 107: Middle East & Africa Market Value Share and BPS Analysis by Services, 2025 and 2035
  • Figure 108: Middle East & Africa Market Y-o-Y Growth Comparison by Services, 2025–2035
  • Figure 109: Middle East & Africa Market Attractiveness Analysis by Services
  • Figure 110: Middle East & Africa Market Value Share and BPS Analysis by Application, 2025 and 2035
  • Figure 111: Middle East & Africa Market Y-o-Y Growth Comparison by Application, 2025–2035
  • Figure 112: Middle East & Africa Market Attractiveness Analysis by Application
  • Figure 113: Middle East & Africa Market Value Share and BPS Analysis by End Users, 2025 and 2035
  • Figure 114: Middle East & Africa Market Y-o-Y Growth Comparison by End Users, 2025–2035
  • Figure 115: Middle East & Africa Market Attractiveness Analysis by End Users
  • Figure 116: Global Market – Tier Structure Analysis
  • Figure 117: Global Market – Company Share Analysis
Dashboard
Dashboard
Dashboard
Dashboard
Dashboard
Dashboard

Full Research Suite comprises of:

Market outlook & trends analysis

Market outlook & trends analysis

Interviews & case studies

Interviews & case studies

Strategic recommendations

Strategic recommendations

Vendor profiles & capabilities analysis

Vendor profiles & capabilities analysis

5-year forecasts

5-year forecasts

8 regions and 60+ country-level data splits

8 regions and 60+ country-level data splits

Market segment data splits

Market segment data splits

12 months of continuous data updates

12 months of continuous data updates

DELIVERED AS:

PDF EXCEL ONLINE

Full Research Suite


$5000

$7500

$10000

Buy Report Now
Similar Industry Reports

Similar Industry Reports

Saw Blades Market
Saw Blades Market

Saw Blades Market Size, Share, and Forecast 2025 to 2035

Air Blade Dryer Market

Air Blade Dryer Market Size, Share, and Forecast 2025 to 2035

Wiper Blade Market
Wiper Blade Market

Wiper Blade Market Size and Share Forecast Outlook 2025 to 2035

Grader Blades Market

Grader Blades Market Size and Share Forecast Outlook 2025 to 2035

Hacksaw Blades Market

Hacksaw Blades Market Size and Share Forecast Outlook 2025 to 2035

Turbine Blade Material Market

Turbine Blade Material Market Size and Share Forecast Outlook 2025 to 2035

Razor and Blade Market Share Analysis

Competitive Breakdown of Razor and Blade Providers

Razor and Blade Market

Razor and Blade Market Insights – Growth & Forecast 2024-2034

APAC Wiper Blade Industry

APAC Wiper Blade Industry Size and Share Forecast Outlook 2025 to 2035

Helicopter Blades Market

Helicopter Blades Market Size and Share Forecast Outlook 2025 to 2035

Skin Graft Blades Market

Skin Graft Blades Market

Circular Saw Blade Market

Circular Saw Blade Market Forecast and Outlook 2025 to 2035

Wind Turbine Blade Market

Wind Turbine Blade Market Size and Share Forecast Outlook 2025 to 2035

Wind Turbine Blade Repair Material Market

Wind Turbine Blade Repair Material Market Growth – Trends & Forecast 2024-2034

Aircraft Engine Blade Market

Aircraft Engine Blade Market Size and Share Forecast Outlook 2025 to 2035

Automotive Wiper Blade Market

Automotive Wiper Blade Market Growth – Trends & Forecast 2024 to 2034

Stone Cutting Saw Blades Market

Stone Cutting Saw Blades Market Analysis & Forecast by Blade Type, Blade Diameter, End User, and Region Forecast Through 2035

Offshore Wind Turbine Blade Market

Offshore Wind Turbine Blade Market Size and Share Forecast Outlook 2025 to 2035

Aluminum Casing of the Blade Battery Market

Aluminum Casing of the Blade Battery Market Size and Share Forecast Outlook 2025 to 2035

Woodworking Circular Saw Blades Market

Woodworking Circular Saw Blades Market Size and Share Forecast Outlook 2025 to 2035

Future Market Insights

Blade Server Market

Chat With MaRIA

Chat With

MaRIA

Hi There, I am MaRIA, Your Market Research Intelligence Assistant. How may I help you?