Devulcanization Machine Market Size, Share, and Forecast Outlook 2025 to 2035

The devulcanization machine market is estimated to grow from USD 483.5 million in 2025 to USD 907.6 million by 2035, reflecting a CAGR of 6.5% during the assessment period. The devulcanization machine market is expanding rapidly as industries prioritize rubber recycling to cut costs and meet sustainability goals.
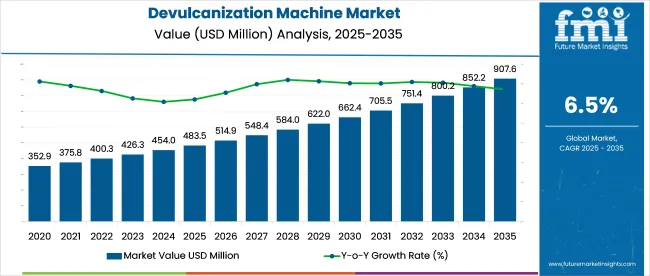
Quick Stats in Devulcanization Machine Market

  • Market Size (2025): USD 483.5 million
  • Market Forecast (2035): USD 907.6 million
  • CAGR (2025 to 2035): 6.5%
  • Top Technology Segment: Mechanical (30% share in 2025)
  • Leading Capacity Range: 50-250 kg/hr (50% share in 2025)
  • Top Growing Country: China (7.0% CAGR)

Devulcanization Machine Market

Advanced systems now recover up to 95% of cross-linked sulfur bonds while retaining the polymer backbone, making the reclaimed rubber suitable for use in tires, gaskets, and industrial flooring. Modern microwave-based machines are delivering energy efficiency gains of up to 40% compared to conventional thermal processes.

In North America, large-scale facilities are processing more than 20,000 tons of rubber annually, with AI-integrated machines improving consistency and reducing waste. Asia-Pacific has increased its devulcanization capacity by over 50% in the past year, with hybrid chemical-mechanical technologies enhancing reclaim quality by 45%.

Tire manufacturers are entering partnerships with recycling plants to track material flow using RFID-tagged tires, pushing material recovery rates above 80%. These developments are fueling demand for high-throughput, precision-controlled machinery that aligns with both ESG targets and rising circular economy benchmarks.

As of 2025, the devulcanization machine market holds a specialized yet crucial share within its broader parent markets. Within the global rubber recycling equipment market, devulcanization machines account for approximately 15% to 20%, driven by growing demand for recycled rubber feedstock. In the tire recycling market, their share stands at 10-12%, as they enable eco-friendly reprocessing of end-of-life tires.

Within the industrial machinery market, devulcanization equipment represents about 1-2%, reflecting its niche application. In the waste management equipment market, its contribution is around 3-4%, given its role in circular economy initiatives. In the sustainable manufacturing technologies market, devulcanization machines hold roughly 5-6%, reflecting increasing adoption by manufacturers seeking greener processes.

Analyzing Devulcanization Machine Market by Top Investment Segments

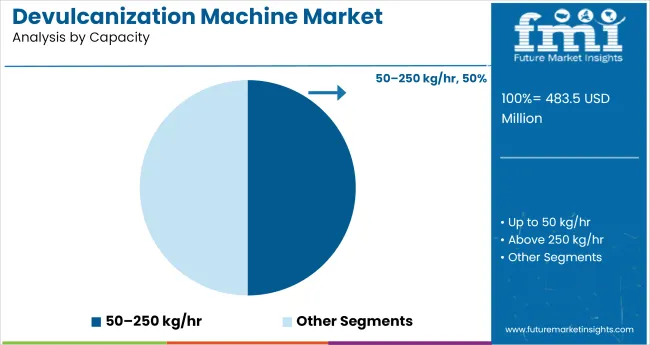
Mechanical technology is set to dominate the devulcanization technology segment with a 30% market share by 2025. Machines with a capacity range of 50-250 kg/hr will lead capacity-based sales with a 50% share.
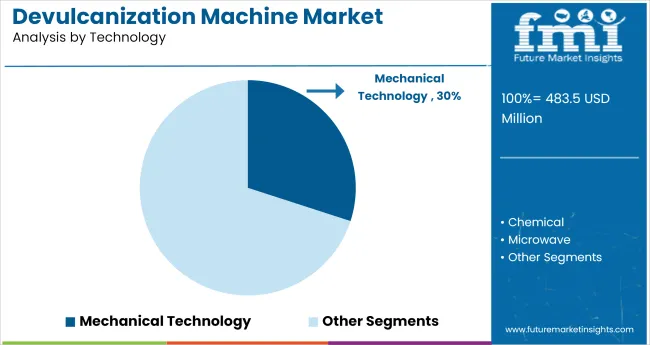
Mechanical Technology to Lead the Technology Segment with 30% Market Share

Devulcanization Machine Market Analysis By Technology

Mechanical devulcanization is expected to account for 30% of global revenue by 2025, driven by its cost-efficiency and widespread compatibility with various rubber feedstocks. Operators prefer mechanical systems due to minimal chemical use, aligning with environmental regulations and circular economy goals.
  • The technology is ideal for processing tire crumb and industrial rubber waste into reusable compounds.
  • Demand is growing across Asia and Europe, where rubber recycling industries are supported by favorable green policies and rising material recovery targets.

50-250 kg/hr Machines to Dominate the Capacity Segment with 50% Market Share

Devulcanization Machine Market Analysis By Capacity

Machines with a capacity of 50-250 kg/hr are projected to contribute 50% of market share by 2025, reflecting high demand from small and mid-sized reclaimers. This capacity range supports continuous processing while offering lower energy consumption and capital investment.
  • Modular units in this category are gaining popularity for their flexibility in pilot projects and decentralized recycling setups.
  • Rubber processors in India, Indonesia, and Latin America are actively investing in this capacity bracket for localized production.

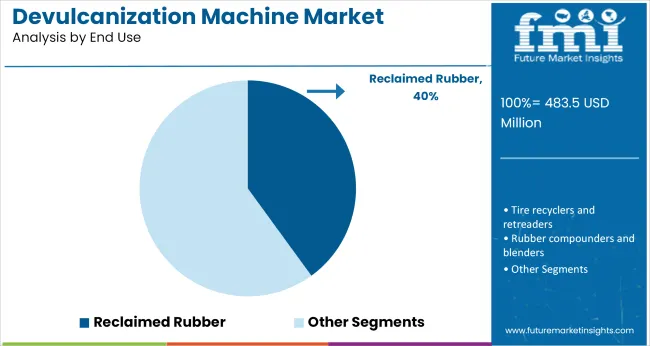
Reclaimed Rubber Manufacturers to Lead the End Use Segment with 40% Market Share

Devulcanization Machine Market Analysis By End Use

Reclaimed rubber manufacturers are anticipated to hold 40% market share by 2025, as they scale up operations to meet circular economy targets. Devulcanization machines are key tools in converting tire scrap and industrial rubber waste into high-quality secondary raw material.

  • End users value the equipment’s role in reducing dependence on virgin rubber and lowering overall production costs.
  • The growing demand for cost-effective and eco-friendly materials in construction, footwear, and automotive sectors supports this trend.

Top Devulcanization Machine Market Dynamics

The market is witnessing significant traction as sustainability regulations and circular economy targets reshape the rubber recycling industry. In 2024, over 1.2 million tons of waste rubber were processed globally using devulcanization technologies.

Energy Efficiency and Emission Control Driving Equipment Design

Manufacturers are focusing on low-emission, energy-optimized machinery to meet global environmental standards. Steam-based and microwave devulcanization systems now account for over 42% of new installations due to lower carbon output. Retrofitting with VOC scrubbers and energy recovery units is being done to meet EU and EPA mandates.

  • Microwave systems preferred in urban units for reduced odor and emissions.
  • VOC controls installed in >65% of machines exported to North America.
  • Steam devulcanizers adopted for consistent quality in high-volume plants.

Customization and Automation Expanding Machine Utility

Automated process controls, modular layouts, and rubber-specific programming are being integrated to handle diverse feedstocks such as butyl, SBR, and NR. In 2024, over 33% of new machines featured AI-assisted process tuning for optimal devulcanization without chain degradation. Batch and continuous models are customized to meet specific throughput needs.
  • AI-based feedback systems deployed to maintain polymer chain integrity.
  • Customized lines configured for EPDM, NR, and nitrile rubber applications.
  • Modular machines installed to scale operations without reconfiguration delays.

Top Countries Innovating, Retrofitting, and Advancing Devulcanization Machine Adoption

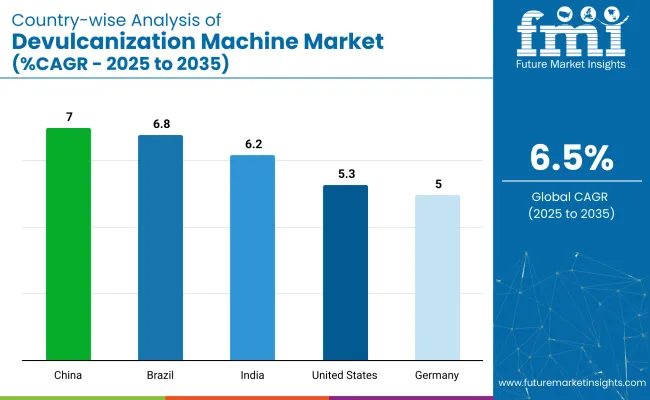
Country Wise Analysis Of Devulcanization Machine Market Cagr 2025 To 2035

Country-wise CAGR Comparison (2025 to 2035)

Countries CAGR (2025 to 2035)
China 7.0%
Brazil 6.8%
India 6.2%
United States 5.3%
Germany 5.0%

The global market is expected to grow at a 6.5% CAGR from 2025 to 2035, yet country-wise growth is shaped by investment volume, end-use rubber recovery rates, and circularity mandates. China leads with a 7.0% CAGR, backed by over USD 400 million in provincial subsidies for tire recycling facilities and annual processing of 3.6 million metric tons of end-of-life rubber.

Over 70% of new devulcanization units sold in 2024 were installed in Shandong and Jiangsu provinces alone. Brazil follows at 6.8%, fueled by federal recycling credits (Reciclagem Brasil program) and 40+ operational plants targeting 150,000 tons of rubber reclamation annually.

India, growing at 6.2%, is scaling batch devulcanization units under the National Resource Efficiency Policy, with Tamil Nadu contributing 28% of the country’s reclaimed rubber capacity. In contrast, the USA (5.3%) and Germany (5.0%) reflect underperformance due to slower retrofit cycles and capped landfill diversion rates, both below 30% for industrial rubber waste.

The report provides insights across 40+ countries. The five below are highlighted for their strategic influence and growth trajectory.

Market Overview for Devulcanization Machines in China

The market in China is forecast to grow at a CAGR of 7.0% through 2035, driven by stringent government mandates on tire recycling under its Circular Economy Promotion Law. Over 330 million waste tires are generated annually, and major industrial zones like Shandong and Guangdong are investing in continuous devulcanization lines.

Manufacturers such as MESNAC and Huahan are deploying energy-efficient, closed-loop systems for reclaimed rubber production. Provincial subsidies and green tax credits are accelerating upgrades among tire shredders and crumb rubber plants.

  • Waste tire recycling quotas creating captive demand for devulcanization lines
  • MESNAC and Huahan expanding production of thermal-mechanical systems
  • Provincial grants supporting green technology retrofits

Demand Outlook for Devulcanization Machines in Brazil

Brazil is expected to grow at a CAGR of 6.8%, fueled by its 200,000+ tons annual waste tire generation and ANIP-backed tire disposal targets. Growth is concentrated in São Paulo and Minas Gerais, where rubber reclaimers are scaling operations to meet growing automotive and construction sector needs.

Local machine builders are innovating microwave and chemical devulcanization systems with improved emission control. Public tenders are including tire-derived rubber in asphalt and flooring contracts, boosting machine utilization across municipal recycling plants.

  • Asphalt and flooring projects using reclaimed rubber under public tenders
  • São Paulo region driving demand for emission-compliant equipment
  • Microwave-based machines gaining preference among mid-sized reclaimers

Growth Forecast for Devulcanization Machines in India

India is projected to grow at a CAGR of 6.2% through 2035, driven by policies under the EPR (Extended Producer Responsibility) framework and the expansion of its retreading and footwear sectors. Tier-2 cities are emerging as centers for decentralized devulcanization, supported by low-cost labor and availability of truck tire waste.

Domestic equipment makers in Gujarat and Punjab are offering modular, diesel-electric hybrid machines suited for mixed rubber input. Support from the Ministry of MSME is encouraging machinery upgrades in small-scale recycling clusters.

  • EPR compliance mandates boosting machinery demand in urban clusters
  • Modular systems built for mixed rubber inputs and low operating costs
  • MSME schemes financing machinery for semi-urban reclaim units

Innovation Trends in Devulcanization Equipment in the United States

The USA market is forecast to grow at a CAGR of 5.3% through 2035, led by rising interest in sustainable rubber sourcing and high-performance recycled elastomers. Large-scale operators in California and Texas are investing in automated devulcanization lines with data monitoring and heat recovery systems.

EPA regulations on VOC emissions are shifting preference toward closed-chamber, non-chemical processes. Reclaimed rubber from devulcanized material is being used in molded parts, roofing membranes, and eco-friendly footwear components.

  • Automated systems with heat recovery improving energy efficiency
  • EPA standards driving shift to non-chemical devulcanization units
  • High-performance reclaimed rubber used in molded product sectors

Technology Outlook for Devulcanization Machines in Germany

The market in Germany is projected to expand at a CAGR of 5.0% through 2035. Growth is supported by EU waste legislation and Germany’s strict rubber recycling directives, which require 100% recovery of post-consumer tire waste. Equipment manufacturers are developing ultrasonic and twin-screw extruder-based machines for precision control and energy efficiency.

Devulcanized rubber is gaining application in sports surfaces, automotive dampers, and sustainable building materials. Federal subsidies are being channeled into R&D for low-emission machinery.
  • Precision devulcanization tech adopted for specialty rubber recovery
  • Twin-screw and ultrasonic machines commercialized by German OEMs
  • Building sector demand rising for reclaimed elastomer composites

Leading Devulcanization Machine Manufacturers

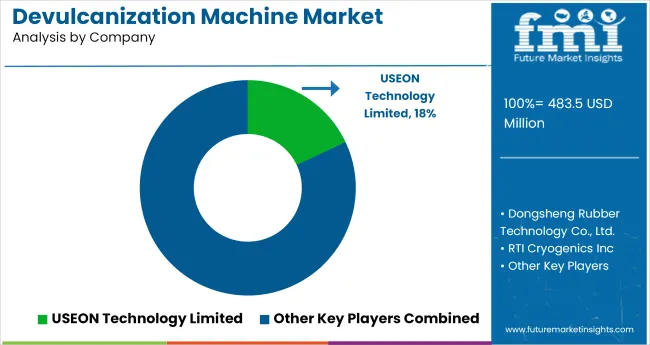
Devulcanization Machine Market Analysis By Company

The market is moderately fragmented, with both established global players and emerging regional firms contributing to technological innovation in rubber recycling. USEON Technology Limited and Dongsheng Rubber Technology Co., Ltd. are among the most recognized, offering continuous devulcanization systems that support high-throughput and energy efficiency.

These companies are widely adopted in the tire and industrial rubber recycling sectors. REP International and RTI Cryogenics Inc. bring specialty solutions for cold and cryogenic devulcanization, catering to industries seeking cleaner and less thermally intensive methods. MARIS and Qingdao Steady Machinery Co., Ltd. focus on twin-screw extruder-based systems, enhancing flexibility in processing various rubber feedstocks.

Recent Devulcanization Machine Industry News

In March 2024, the HEXPOL Group’s compounding division invested in a new mechanical devulcanization line at its Czech Republic facility. The installation will enable in‑house processing of cured rubber scrap, producing several thousand tons of reclaimed rubber annually and advancing its circular economy strategy.

Report Coverage and Scope Summary

Report Attributes Details
Market Size (2025) USD 483.5 million
Projected Market Size (2035) USD 907.6 million
CAGR (2025 to 2035) 6.5%
Base Year for Estimation 2024
Historical Period 2020 to 2024
Projections Period 2025 to 2035
Quantitative Units USD million for market value
Technologies Analyzed (Segment 1) Mechanical, Chemical, Microwave, Others (Ultrasonic, Organic)
Capacities Analyzed (Segment 2) Up to 50 kg/ hr, 50 - 250 kg/ hr, Above 250 kg/ hr
End Uses Analyzed (Segment 3) Reclaimed Rubber Manufacturers, Tire Recyclers & Retreaders, Rubber Compounders & Blenders, Industrial Rubber Goods Manufacturers, Other Specialized Processors
Regions Covered North America, Latin America, Eastern Europe, Western Europe, South Asia & Pacific, East Asia, Middle East & Africa
Countries Covered United States, Canada, Germany, United Kingdom, France, Japan, China, India, South Korea, Brazil
Key Players USEON Technology Limited, Dongsheng Rubber Technology Co., Ltd., RTI Cryogenics Inc, REP International, MARIS, Chun Cheong Rubber Machinery Co., Ltd., Qingdao Steady Machinery Co., Ltd., FONMAR, Julong
Additional Attributes Dollar sales by technology and capacity, growing tire recycling initiatives, rising demand for sustainable rubber processing, and equipment upgrades driven by industrial-scale reclamation projects.

Leading Players in Devulcanization Machine Market

  • USEON Technology Limited
  • Dongsheng Rubber Technology Co., Ltd.
  • RTI Cryogenics Inc
  • REP International
  • MARIS
  • hun Cheong Rubber Machinery Co., Ltd.
  • Qingdao Steady Machinery Co.,Ltd (global rubber machinery)
  • FONMAR
  • Julong

Devulcanization Machine Market Analyzed by Key Investment Segments

By Technology:

The market is segmented by technology into mechanical, chemical, microwave, and others including ultrasonic and organic methods.

By Capacity:

In terms of capacity, the market is divided into units handling up to 50 kg/hr, 50 to 250 kg/hr, and above 250 kg/hr.

By End Use:

Key end users include reclaimed rubber, tire recyclers and retreaders, rubber compounders and blenders, industrial rubber goods, and other specialized processors.

By Region:

Geographically, the market spans North America, Latin America, Eastern Europe, Western Europe, South Asia & Pacific, East Asia, and the Middle East & Africa.

Table of Content

  1. Executive Summary
    • Global Market Outlook
    • Demand-side Trends
    • Supply-side Trends
    • Technology Roadmap Analysis
    • Analysis and Recommendations
  2. Market Overview
    • Market Coverage / Taxonomy
    • Market Definition / Scope / Limitations
  3. Market Background
    • Market Dynamics
      • Drivers
      • Restraints
      • Opportunity
      • Trends
    • Scenario Forecast
      • Demand in Optimistic Scenario
      • Demand in Likely Scenario
      • Demand in Conservative Scenario
    • Opportunity Map Analysis
    • Product Life Cycle Analysis
    • Supply Chain Analysis
      • Supply Side Participants and their Roles
        • Producers
        • Mid-Level Participants (Traders/ Agents/ Brokers)
        • Wholesalers and Distributors
      • Value Added and Value Created at Node in the Supply Chain
      • List of Raw Material Suppliers
      • List of Existing and Potential Buyer’s
    • Investment Feasibility Matrix
    • Value Chain Analysis
      • Profit Margin Analysis
      • Wholesalers and Distributors
      • Retailers
    • PESTLE and Porter’s Analysis
    • Regulatory Landscape
      • By Key Regions
      • By Key Countries
    • Regional Parent Market Outlook
    • Production and Consumption Statistics
    • Import and Export Statistics
  4. Global Market Analysis 2020 to 2024 and Forecast, 2025 to 2035
    • Historical Market Size Value (USD Million) & Volume (Units) Analysis, 2020 to 2024
    • Current and Future Market Size Value (USD Million) & Volume (Units) Projections, 2025 to 2035
      • Y-o-Y Growth Trend Analysis
      • Absolute $ Opportunity Analysis
  5. Global Market Pricing Analysis 2020 to 2024 and Forecast 2025 to 2035
  6. Global Market Analysis 2020 to 2024 and Forecast 2025 to 2035, By Technology
    • Introduction / Key Findings
    • Historical Market Size Value (USD Million) & Volume (Units) Analysis By Technology, 2020 to 2024
    • Current and Future Market Size Value (USD Million) & Volume (Units) Analysis and Forecast By Technology, 2025 to 2035
      • Mechanical
      • Chemical
      • Microwave
      • Others
        • Ultrasonic
        • Organic
    • Y-o-Y Growth Trend Analysis By Technology, 2020 to 2024
    • Absolute $ Opportunity Analysis By Technology, 2025 to 2035
  7. Global Market Analysis 2020 to 2024 and Forecast 2025 to 2035, By Capacity
    • Introduction / Key Findings
    • Historical Market Size Value (USD Million) & Volume (Units) Analysis By Capacity, 2020 to 2024
    • Current and Future Market Size Value (USD Million) & Volume (Units) Analysis and Forecast By Capacity, 2025 to 2035
      • Up to 50 kg/hr
      • 50 to 250 kg/hr
      • Above 250 kg/hr
    • Y-o-Y Growth Trend Analysis By Capacity, 2020 to 2024
    • Absolute $ Opportunity Analysis By Capacity, 2025 to 2035
  8. Global Market Analysis 2020 to 2024 and Forecast 2025 to 2035, By End Use
    • Introduction / Key Findings
    • Historical Market Size Value (USD Million) & Volume (Units) Analysis By End Use, 2020 to 2024
    • Current and Future Market Size Value (USD Million) & Volume (Units) Analysis and Forecast By End Use, 2025 to 2035
      • Reclaimed Rubber Manufacturers
      • Tire Recyclers / Retreaders
      • Rubber Compounders & Blenders
      • Industrial Rubber Goods Manufacturers
      • Others
    • Y-o-Y Growth Trend Analysis By End Use, 2020 to 2024
    • Absolute $ Opportunity Analysis By End Use, 2025 to 2035
  9. Global Market Analysis 2020 to 2024 and Forecast 2025 to 2035, By Region
    • Introduction
    • Historical Market Size Value (USD Million) & Volume (Units) Analysis By Region, 2020 to 2024
    • Current Market Size Value (USD Million) & Volume (Units) Analysis and Forecast By Region, 2025 to 2035
      • North America
      • Latin America
      • Western Europe
      • Eastern Europe
      • East Asia
      • South Asia & Pacific
      • Middle East and Africa
    • Market Attractiveness Analysis By Region
  10. North America Market Analysis 2020 to 2024 and Forecast 2025 to 2035, By Country
    • Historical Market Size Value (USD Million) & Volume (Units) Trend Analysis By Market Taxonomy, 2020 to 2024
    • Market Size Value (USD Million) & Volume (Units) Forecast By Market Taxonomy, 2025 to 2035
      • By Country
        • USA
        • Canada
        • Mexico
      • By Technology
      • By Capacity
      • By End Use
    • Market Attractiveness Analysis
      • By Country
      • By Technology
      • By Capacity
      • By End Use
    • Key Takeaways
  11. Latin America Market Analysis 2020 to 2024 and Forecast 2025 to 2035, By Country
    • Historical Market Size Value (USD Million) & Volume (Units) Trend Analysis By Market Taxonomy, 2020 to 2024
    • Market Size Value (USD Million) & Volume (Units) Forecast By Market Taxonomy, 2025 to 2035
      • By Country
        • Brazil
        • Argentina
        • Rest of LATAM
      • By Technology
      • By Capacity
      • By End Use
    • Market Attractiveness Analysis
      • By Country
      • By Technology
      • By Capacity
      • By End Use
    • Key Takeaways
  12. Western Europe Market Analysis 2020 to 2024 and Forecast 2025 to 2035, By Country
    • Historical Market Size Value (USD Million) & Volume (Units) Trend Analysis By Market Taxonomy, 2020 to 2024
    • Market Size Value (USD Million) & Volume (Units) Forecast By Market Taxonomy, 2025 to 2035
      • By Country
        • Germany
        • Italy
        • France
        • UK
        • Spain
        • BENELUX
        • Nordic
        • Rest of W.Europe
      • By Technology
      • By Capacity
      • By End Use
    • Market Attractiveness Analysis
      • By Country
      • By Technology
      • By Capacity
      • By End Use
    • Key Takeaways
  13. Eastern Europe Market Analysis 2020 to 2024 and Forecast 2025 to 2035, By Country
    • Historical Market Size Value (USD Million) & Volume (Units) Trend Analysis By Market Taxonomy, 2020 to 2024
    • Market Size Value (USD Million) & Volume (Units) Forecast By Market Taxonomy, 2025 to 2035
      • By Country
        • Russia
        • Hungary
        • Poland
        • Balkan & Baltics
        • Rest of E. Europe
      • By Technology
      • By Capacity
      • By End Use
    • Market Attractiveness Analysis
      • By Country
      • By Technology
      • By Capacity
      • By End Use
    • Key Takeaways
  14. East Asia Market Analysis 2020 to 2024 and Forecast 2025 to 2035, By Country
    • Historical Market Size Value (USD Million) & Volume (Units) Trend Analysis By Market Taxonomy, 2020 to 2024
    • Market Size Value (USD Million) & Volume (Units) Forecast By Market Taxonomy, 2025 to 2035
      • By Country
        • China
        • Japan
        • South Korea
      • By Technology
      • By Capacity
      • By End Use
    • Market Attractiveness Analysis
      • By Country
      • By Technology
      • By Capacity
      • By End Use
    • Key Takeaways
  15. South Asia & Pacific Market Analysis 2020 to 2024 and Forecast 2025 to 2035, By Country
    • Historical Market Size Value (USD Million) & Volume (Units) Trend Analysis By Market Taxonomy, 2020 to 2024
    • Market Size Value (USD Million) & Volume (Units) Forecast By Market Taxonomy, 2025 to 2035
      • By Country
        • India
        • Australia & New Zealand
        • ASEAN
        • Rest of SAP
      • By Technology
      • By Capacity
      • By End Use
    • Market Attractiveness Analysis
      • By Country
      • By Technology
      • By Capacity
      • By End Use
    • Key Takeaways
  16. Middle East and Africa Market Analysis 2020 to 2024 and Forecast 2025 to 2035, By Country
    • Historical Market Size Value (USD Million) & Volume (Units) Trend Analysis By Market Taxonomy, 2020 to 2024
    • Market Size Value (USD Million) & Volume (Units) Forecast By Market Taxonomy, 2025 to 2035
      • By Country
        • GCC Countries
        • Northern Africa
        • South Africa
        • Turkiye
        • Rest of MEA
      • By Technology
      • By Capacity
      • By End Use
    • Market Attractiveness Analysis
      • By Country
      • By Technology
      • By Capacity
      • By End Use
    • Key Takeaways
  17. Key Countries Market Analysis
    • USA
      • Pricing Analysis
      • Market Share Analysis, 2024
        • By Technology
        • By Capacity
        • By End Use
    • Canada
      • Pricing Analysis
      • Market Share Analysis, 2024
        • By Technology
        • By Capacity
        • By End Use
    • Brazil
      • Pricing Analysis
      • Market Share Analysis, 2024
        • By Technology
        • By Capacity
        • By End Use
    • Mexico
      • Pricing Analysis
      • Market Share Analysis, 2024
        • By Technology
        • By Capacity
        • By End Use
    • Argentina
      • Pricing Analysis
      • Market Share Analysis, 2024
        • By Technology
        • By Capacity
        • By End Use
  18. Market Structure Analysis
    • Competition Dashboard
    • Competition Benchmarking
    • Market Share Analysis of Top Players
      • By Regional
      • By Technology
      • By Capacity
      • By End Use
  19. Competition Analysis
    • Competition Deep Dive
      • USEON Technology Limited
        • Overview
        • Product Portfolio
        • Profitability by Market Segments (Product/Age /Sales Channel/Region)
        • Sales Footprint
        • Strategy Overview
          • Marketing Strategy
          • Product Strategy
          • Channel Strategy
      • Dongsheng Rubber Technology Co., Ltd.
        • Overview
        • Product Portfolio
        • Profitability by Market Segments (Product/Age /Sales Channel/Region)
        • Sales Footprint
        • Strategy Overview
          • Marketing Strategy
          • Product Strategy
          • Channel Strategy
      • RTI Cryogenics Inc
        • Overview
        • Product Portfolio
        • Profitability by Market Segments (Product/Age /Sales Channel/Region)
        • Sales Footprint
        • Strategy Overview
          • Marketing Strategy
          • Product Strategy
          • Channel Strategy
      • REP International
        • Overview
        • Product Portfolio
        • Profitability by Market Segments (Product/Age /Sales Channel/Region)
        • Sales Footprint
        • Strategy Overview
          • Marketing Strategy
          • Product Strategy
          • Channel Strategy
      • MARIS
        • Overview
        • Product Portfolio
        • Profitability by Market Segments (Product/Age /Sales Channel/Region)
        • Sales Footprint
        • Strategy Overview
          • Marketing Strategy
          • Product Strategy
          • Channel Strategy
      • hun Cheong Rubber Machinery Co., Ltd.
        • Overview
        • Product Portfolio
        • Profitability by Market Segments (Product/Age /Sales Channel/Region)
        • Sales Footprint
        • Strategy Overview
          • Marketing Strategy
          • Product Strategy
          • Channel Strategy
      • Qingdao Steady Machinery Co.,Ltd. (global rubber machinery)
        • Overview
        • Product Portfolio
        • Profitability by Market Segments (Product/Age /Sales Channel/Region)
        • Sales Footprint
        • Strategy Overview
          • Marketing Strategy
          • Product Strategy
          • Channel Strategy
      • FONMAR
        • Overview
        • Product Portfolio
        • Profitability by Market Segments (Product/Age /Sales Channel/Region)
        • Sales Footprint
        • Strategy Overview
          • Marketing Strategy
          • Product Strategy
          • Channel Strategy
      • Julong
        • Overview
        • Product Portfolio
        • Profitability by Market Segments (Product/Age /Sales Channel/Region)
        • Sales Footprint
        • Strategy Overview
          • Marketing Strategy
          • Product Strategy
          • Channel Strategy
  20. Assumptions & Acronyms Used
  21. Research Methodology

List of Tables

  • Table 1: Global Market Value (USD Million) Forecast by Region, 2020 to 2035
  • Table 2: Global Market Volume (Units) Forecast by Region, 2020 to 2035
  • Table 3: Global Market Value (USD Million) Forecast by Technology, 2020 to 2035
  • Table 4: Global Market Volume (Units) Forecast by Technology, 2020 to 2035
  • Table 5: Global Market Value (USD Million) Forecast by Capacity, 2020 to 2035
  • Table 6: Global Market Volume (Units) Forecast by Capacity, 2020 to 2035
  • Table 7: Global Market Value (USD Million) Forecast by End Use, 2020 to 2035
  • Table 8: Global Market Volume (Units) Forecast by End Use, 2020 to 2035
  • Table 9: North America Market Value (USD Million) Forecast by Country, 2020 to 2035
  • Table 10: North America Market Volume (Units) Forecast by Country, 2020 to 2035
  • Table 11: North America Market Value (USD Million) Forecast by Technology, 2020 to 2035
  • Table 12: North America Market Volume (Units) Forecast by Technology, 2020 to 2035
  • Table 13: North America Market Value (USD Million) Forecast by Capacity, 2020 to 2035
  • Table 14: North America Market Volume (Units) Forecast by Capacity, 2020 to 2035
  • Table 15: North America Market Value (USD Million) Forecast by End Use, 2020 to 2035
  • Table 16: North America Market Volume (Units) Forecast by End Use, 2020 to 2035
  • Table 17: Latin America Market Value (USD Million) Forecast by Country, 2020 to 2035
  • Table 18: Latin America Market Volume (Units) Forecast by Country, 2020 to 2035
  • Table 19: Latin America Market Value (USD Million) Forecast by Technology, 2020 to 2035
  • Table 20: Latin America Market Volume (Units) Forecast by Technology, 2020 to 2035
  • Table 21: Latin America Market Value (USD Million) Forecast by Capacity, 2020 to 2035
  • Table 22: Latin America Market Volume (Units) Forecast by Capacity, 2020 to 2035
  • Table 23: Latin America Market Value (USD Million) Forecast by End Use, 2020 to 2035
  • Table 24: Latin America Market Volume (Units) Forecast by End Use, 2020 to 2035
  • Table 25: Western Europe Market Value (USD Million) Forecast by Country, 2020 to 2035
  • Table 26: Western Europe Market Volume (Units) Forecast by Country, 2020 to 2035
  • Table 27: Western Europe Market Value (USD Million) Forecast by Technology, 2020 to 2035
  • Table 28: Western Europe Market Volume (Units) Forecast by Technology, 2020 to 2035
  • Table 29: Western Europe Market Value (USD Million) Forecast by Capacity, 2020 to 2035
  • Table 30: Western Europe Market Volume (Units) Forecast by Capacity, 2020 to 2035
  • Table 31: Western Europe Market Value (USD Million) Forecast by End Use, 2020 to 2035
  • Table 32: Western Europe Market Volume (Units) Forecast by End Use, 2020 to 2035
  • Table 33: Eastern Europe Market Value (USD Million) Forecast by Country, 2020 to 2035
  • Table 34: Eastern Europe Market Volume (Units) Forecast by Country, 2020 to 2035
  • Table 35: Eastern Europe Market Value (USD Million) Forecast by Technology, 2020 to 2035
  • Table 36: Eastern Europe Market Volume (Units) Forecast by Technology, 2020 to 2035
  • Table 37: Eastern Europe Market Value (USD Million) Forecast by Capacity, 2020 to 2035
  • Table 38: Eastern Europe Market Volume (Units) Forecast by Capacity, 2020 to 2035
  • Table 39: Eastern Europe Market Value (USD Million) Forecast by End Use, 2020 to 2035
  • Table 40: Eastern Europe Market Volume (Units) Forecast by End Use, 2020 to 2035
  • Table 41: East Asia Market Value (USD Million) Forecast by Country, 2020 to 2035
  • Table 42: East Asia Market Volume (Units) Forecast by Country, 2020 to 2035
  • Table 43: East Asia Market Value (USD Million) Forecast by Technology, 2020 to 2035
  • Table 44: East Asia Market Volume (Units) Forecast by Technology, 2020 to 2035
  • Table 45: East Asia Market Value (USD Million) Forecast by Capacity, 2020 to 2035
  • Table 46: East Asia Market Volume (Units) Forecast by Capacity, 2020 to 2035
  • Table 47: East Asia Market Value (USD Million) Forecast by End Use, 2020 to 2035
  • Table 48: East Asia Market Volume (Units) Forecast by End Use, 2020 to 2035
  • Table 49: South Asia & Pacific Market Value (USD Million) Forecast by Country, 2020 to 2035
  • Table 50: South Asia & Pacific Market Volume (Units) Forecast by Country, 2020 to 2035
  • Table 51: South Asia & Pacific Market Value (USD Million) Forecast by Technology, 2020 to 2035
  • Table 52: South Asia & Pacific Market Volume (Units) Forecast by Technology, 2020 to 2035
  • Table 53: South Asia & Pacific Market Value (USD Million) Forecast by Capacity, 2020 to 2035
  • Table 54: South Asia & Pacific Market Volume (Units) Forecast by Capacity, 2020 to 2035
  • Table 55: South Asia & Pacific Market Value (USD Million) Forecast by End Use, 2020 to 2035
  • Table 56: South Asia & Pacific Market Volume (Units) Forecast by End Use, 2020 to 2035
  • Table 57: Middle East and Africa Market Value (USD Million) Forecast by Country, 2020 to 2035
  • Table 58: Middle East and Africa Market Volume (Units) Forecast by Country, 2020 to 2035
  • Table 59: Middle East and Africa Market Value (USD Million) Forecast by Technology, 2020 to 2035
  • Table 60: Middle East and Africa Market Volume (Units) Forecast by Technology, 2020 to 2035
  • Table 61: Middle East and Africa Market Value (USD Million) Forecast by Capacity, 2020 to 2035
  • Table 62: Middle East and Africa Market Volume (Units) Forecast by Capacity, 2020 to 2035
  • Table 63: Middle East and Africa Market Value (USD Million) Forecast by End Use, 2020 to 2035
  • Table 64: Middle East and Africa Market Volume (Units) Forecast by End Use, 2020 to 2035

List of Figures

  • Figure 1: Global Market Volume (Units) Forecast 2020 to 2035
  • Figure 2: Global Market Pricing Analysis
  • Figure 3: Global Market Value (USD Million) Forecast 2020 to 2035
  • Figure 4: Global Market Value Share and BPS Analysis by Technology, 2025 and 2035
  • Figure 5: Global Market Y-o-Y Growth Comparison by Technology, 2025 to 2035
  • Figure 6: Global Market Attractiveness Analysis by Technology
  • Figure 7: Global Market Value Share and BPS Analysis by Capacity, 2025 and 2035
  • Figure 8: Global Market Y-o-Y Growth Comparison by Capacity, 2025 to 2035
  • Figure 9: Global Market Attractiveness Analysis by Capacity
  • Figure 10: Global Market Value Share and BPS Analysis by End Use, 2025 and 2035
  • Figure 11: Global Market Y-o-Y Growth Comparison by End Use, 2025 to 2035
  • Figure 12: Global Market Attractiveness Analysis by End Use
  • Figure 13: Global Market Value (USD Million) Share and BPS Analysis by Region, 2025 and 2035
  • Figure 14: Global Market Y-o-Y Growth Comparison by Region, 2025 to 2035
  • Figure 15: Global Market Attractiveness Analysis by Region
  • Figure 16: North America Market Incremental $ Opportunity, 2025 to 2035
  • Figure 17: Latin America Market Incremental $ Opportunity, 2025 to 2035
  • Figure 18: Western Europe Market Incremental $ Opportunity, 2025 to 2035
  • Figure 19: Eastern Europe Market Incremental $ Opportunity, 2025 to 2035
  • Figure 20: East Asia Market Incremental $ Opportunity, 2025 to 2035
  • Figure 21: South Asia & Pacific Market Incremental $ Opportunity, 2025 to 2035
  • Figure 22: Middle East and Africa Market Incremental $ Opportunity, 2025 to 2035
  • Figure 23: North America Market Value Share and BPS Analysis by Country, 2025 and 2035
  • Figure 24: North America Market Value Share and BPS Analysis by Technology, 2025 and 2035
  • Figure 25: North America Market Y-o-Y Growth Comparison by Technology, 2025 to 2035
  • Figure 26: North America Market Attractiveness Analysis by Technology
  • Figure 27: North America Market Value Share and BPS Analysis by Capacity, 2025 and 2035
  • Figure 28: North America Market Y-o-Y Growth Comparison by Capacity, 2025 to 2035
  • Figure 29: North America Market Attractiveness Analysis by Capacity
  • Figure 30: North America Market Value Share and BPS Analysis by End Use, 2025 and 2035
  • Figure 31: North America Market Y-o-Y Growth Comparison by End Use, 2025 to 2035
  • Figure 32: North America Market Attractiveness Analysis by End Use
  • Figure 33: Latin America Market Value Share and BPS Analysis by Country, 2025 and 2035
  • Figure 34: Latin America Market Value Share and BPS Analysis by Technology, 2025 and 2035
  • Figure 35: Latin America Market Y-o-Y Growth Comparison by Technology, 2025 to 2035
  • Figure 36: Latin America Market Attractiveness Analysis by Technology
  • Figure 37: Latin America Market Value Share and BPS Analysis by Capacity, 2025 and 2035
  • Figure 38: Latin America Market Y-o-Y Growth Comparison by Capacity, 2025 to 2035
  • Figure 39: Latin America Market Attractiveness Analysis by Capacity
  • Figure 40: Latin America Market Value Share and BPS Analysis by End Use, 2025 and 2035
  • Figure 41: Latin America Market Y-o-Y Growth Comparison by End Use, 2025 to 2035
  • Figure 42: Latin America Market Attractiveness Analysis by End Use
  • Figure 43: Western Europe Market Value Share and BPS Analysis by Country, 2025 and 2035
  • Figure 44: Western Europe Market Value Share and BPS Analysis by Technology, 2025 and 2035
  • Figure 45: Western Europe Market Y-o-Y Growth Comparison by Technology, 2025 to 2035
  • Figure 46: Western Europe Market Attractiveness Analysis by Technology
  • Figure 47: Western Europe Market Value Share and BPS Analysis by Capacity, 2025 and 2035
  • Figure 48: Western Europe Market Y-o-Y Growth Comparison by Capacity, 2025 to 2035
  • Figure 49: Western Europe Market Attractiveness Analysis by Capacity
  • Figure 50: Western Europe Market Value Share and BPS Analysis by End Use, 2025 and 2035
  • Figure 51: Western Europe Market Y-o-Y Growth Comparison by End Use, 2025 to 2035
  • Figure 52: Western Europe Market Attractiveness Analysis by End Use
  • Figure 53: Eastern Europe Market Value Share and BPS Analysis by Country, 2025 and 2035
  • Figure 54: Eastern Europe Market Value Share and BPS Analysis by Technology, 2025 and 2035
  • Figure 55: Eastern Europe Market Y-o-Y Growth Comparison by Technology, 2025 to 2035
  • Figure 56: Eastern Europe Market Attractiveness Analysis by Technology
  • Figure 57: Eastern Europe Market Value Share and BPS Analysis by Capacity, 2025 and 2035
  • Figure 58: Eastern Europe Market Y-o-Y Growth Comparison by Capacity, 2025 to 2035
  • Figure 59: Eastern Europe Market Attractiveness Analysis by Capacity
  • Figure 60: Eastern Europe Market Value Share and BPS Analysis by End Use, 2025 and 2035
  • Figure 61: Eastern Europe Market Y-o-Y Growth Comparison by End Use, 2025 to 2035
  • Figure 62: Eastern Europe Market Attractiveness Analysis by End Use
  • Figure 63: East Asia Market Value Share and BPS Analysis by Country, 2025 and 2035
  • Figure 64: East Asia Market Value Share and BPS Analysis by Technology, 2025 and 2035
  • Figure 65: East Asia Market Y-o-Y Growth Comparison by Technology, 2025 to 2035
  • Figure 66: East Asia Market Attractiveness Analysis by Technology
  • Figure 67: East Asia Market Value Share and BPS Analysis by Capacity, 2025 and 2035
  • Figure 68: East Asia Market Y-o-Y Growth Comparison by Capacity, 2025 to 2035
  • Figure 69: East Asia Market Attractiveness Analysis by Capacity
  • Figure 70: East Asia Market Value Share and BPS Analysis by End Use, 2025 and 2035
  • Figure 71: East Asia Market Y-o-Y Growth Comparison by End Use, 2025 to 2035
  • Figure 72: East Asia Market Attractiveness Analysis by End Use
  • Figure 73: South Asia & Pacific Market Value Share and BPS Analysis by Country, 2025 and 2035
  • Figure 74: South Asia & Pacific Market Value Share and BPS Analysis by Technology, 2025 and 2035
  • Figure 75: South Asia & Pacific Market Y-o-Y Growth Comparison by Technology, 2025 to 2035
  • Figure 76: South Asia & Pacific Market Attractiveness Analysis by Technology
  • Figure 77: South Asia & Pacific Market Value Share and BPS Analysis by Capacity, 2025 and 2035
  • Figure 78: South Asia & Pacific Market Y-o-Y Growth Comparison by Capacity, 2025 to 2035
  • Figure 79: South Asia & Pacific Market Attractiveness Analysis by Capacity
  • Figure 80: South Asia & Pacific Market Value Share and BPS Analysis by End Use, 2025 and 2035
  • Figure 81: South Asia & Pacific Market Y-o-Y Growth Comparison by End Use, 2025 to 2035
  • Figure 82: South Asia & Pacific Market Attractiveness Analysis by End Use
  • Figure 83: Middle East and Africa Market Value Share and BPS Analysis by Country, 2025 and 2035
  • Figure 84: Middle East and Africa Market Value Share and BPS Analysis by Technology, 2025 and 2035
  • Figure 85: Middle East and Africa Market Y-o-Y Growth Comparison by Technology, 2025 to 2035
  • Figure 86: Middle East and Africa Market Attractiveness Analysis by Technology
  • Figure 87: Middle East and Africa Market Value Share and BPS Analysis by Capacity, 2025 and 2035
  • Figure 88: Middle East and Africa Market Y-o-Y Growth Comparison by Capacity, 2025 to 2035
  • Figure 89: Middle East and Africa Market Attractiveness Analysis by Capacity
  • Figure 90: Middle East and Africa Market Value Share and BPS Analysis by End Use, 2025 and 2035
  • Figure 91: Middle East and Africa Market Y-o-Y Growth Comparison by End Use, 2025 to 2035
  • Figure 92: Middle East and Africa Market Attractiveness Analysis by End Use
  • Figure 93: Global Market - Tier Structure Analysis
  • Figure 94: Global Market - Company Share Analysis

Frequently Asked Questions

What is the current valuation of the devulcanization machine market?

The market is valued at USD 483.5 million in 2025.

What is the growth forecast for the devulcanization machine market?

The market is projected to reach USD 907.6 million by 2035, growing at a CAGR of 6.5%.

Which technology segment dominates the devulcanization machine market?

Mechanical technology leads the market with a 30% share in 2025.

What is the leading capacity segment in the devulcanization machine market?

Machines with a capacity of 50-250 kg/hr hold the top position with a 50% share in 2025.

Which country will register the fastest growth in the devulcanization machine market?

China is forecast to lead with a CAGR of 7.0% from 2025 to 2035.

Explore Similar Insights

Future Market Insights

Devulcanization Machine Market