Reports

- Global Locations -

Headquarters

Future Market Insights, Inc.

Christiana Corporate, 200
Continental Drive, Suite 401,
Newark, Delaware - 19713,
United States

T: +1-845-579-5705

Americas

Future Market Insights, Inc.

616 Corporate Way, Suite 2-9018,
Valley Cottage, NY 10989, United States

T: +1-347-918-3531

MEA

Future Market Insights

1602-6 Jumeirah Bay X2 Tower, Plot No: JLT-PH2-X2A,
Jumeirah Lakes Towers, Dubai,
United Arab Emirates

Europe

Future Market Insights

3rd Floor, 207 Regent Street,
W1B 3HH London
United Kingdom

T: + 44 (0) 20 8123 9659
D: +44 (0) 20 3287 4268

Asia Pacific

Future Market Insights

IndiaLand Global Tech Park, Unit UG-1, Behind Grand HighStreet, Phase 1, Hinjawadi, MH, Pune – 411057, India

Elastic Laminate Market Outlook 2024 to 2034

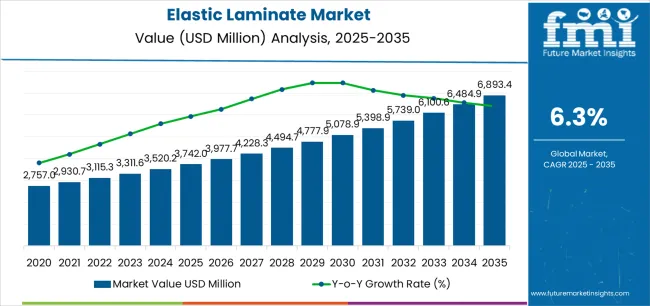
In a recently updated research report on the global elastic laminate market, FMI has estimated that the industry is set to reach a net worth of US$ 5.6 billion in FY 2024. The growth of this industry is driven by the increasing use of elastic laminates by manufacturers of adult incontinence pads, diapers, and feminine care for comfort.

Hereon, the market is anticipated to rise at a 2.7% CAGR over the next decade, with many opportunities arising in developing countries. By 2034, the market is projected to reach US$ 7.3 billion.

Elastic Laminate Market Trends and Analysis

  • Continuous advancements by key players in the market are impelling sales of elastic laminates. Recently, Nitto Denko Corporation obtained Mondi Group’s personal care components business to increase its human life solutions by supporting well-being and good health.
  • Key players are anticipated to invest more in research and development of sustainable material-based elastic laminates by elevating their composition.
  • Constant government initiatives and increasing education levels are raising the demand for feminine care products and diapers.
Attributes Key Insights
Elastic Laminate Market Size (2024E) US$ 5.6 billion
Market Valuation (2034F) US$ 7.3 billion
Value-based CAGR (2024 to 2034) 2.7%

Don't pay for what you don't need

Customize your report by selecting specific countries or regions and save 30%!

Overview of Markets Adjacent to the Core Market

The column below contains briefly discussed trends, opportunities, and drivers regarding core market and allied markets. The allied markets taken include the pharmaceutical plastic packaging market and the packaging laminate market.

Concluding from the following analysis, the core market is seen increasing at a sluggish pace and the scope is rather high in the other two markets. This is inducing players to direct their focus to emerging markets, where growth opportunities are present in abundance.

Core Market:

Attributes Elastic Laminate Industry
CAGR (2024 to 2034) 2.7%
Growth Factor Increasing use of hygiene and medical products
Opportunity Surging research and development activities for the development of biodegradable and recyclable variants
Key Trends Constant government initiatives pushing the demand for feminine care products and diapers

Global Packaging Laminate Market:

Attributes Global Packaging Laminate Market
CAGR (2024 to 2034) 4.3%
Growth Factor Increasing environmental concerns and rising preference for eco-friendly sustainable packaging solutions to lift the demand for packaging laminates
Opportunity Launch of convenience-oriented and innovative solutions for consumer goods creating more opportunities for packaging laminate players
Key Trends The advent of smart packaging to increase engagement, trust, and anti-counterfeiting setting a new trend in this market

Pharmaceutical Plastic Packaging Market:

Attributes Pharmaceutical Plastic Packaging Market
CAGR (2024 to 2034) 5.8%
Growth Factor Rising consumption of medicines and drugs surging the demand for pharmaceutical plastic packaging
Opportunity Increasing pharmaceutical sector to raise prospects for players in pharmaceutical packaging
Key Trends Launch of recyclable products is a recent trend wave, which is expected to stay long in the future as the world population turns environment-conscious

Category-wise Elastic Laminate Market Analysis

Propylene-based Elastomers to Have a Prominent Market Share

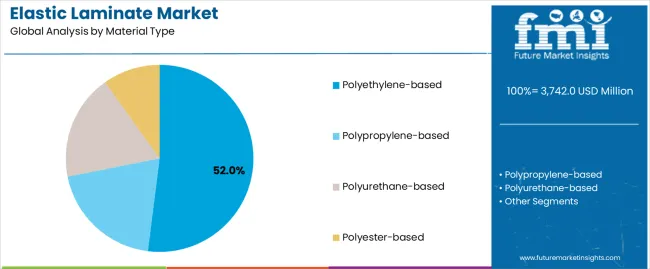
Leading Material Type Propylene-based Elastomers
Value Share (2024) 43.70%

Key players show high preference for propylene-based elastomers as they offer high fabric strength and excellent barrier properties. FMI has estimated that the propylene-based elastomer segment is projected to acquire a 43.70% share in the global market.

Increasing use of propylene-based elastomers in diapers and training pants, adult incontinence products, wipes, and feminine care products is enhancing segment growth.

Hygiene Segment Holds Supremacy as a Leading Application Segment

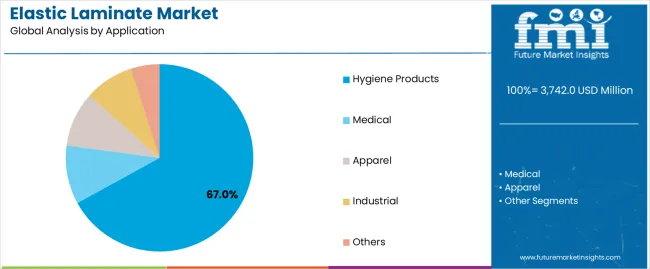
Leading Application Hygiene
Value Share (2024) 81.40%

The hygiene segment is projected to obtain a predominant share of the global market. Accelerating demand for medical and hygiene products that deliver more security, comfort, and discretion is increasing this segment’s share.

Ismail Sutaria
Ismail Sutaria

Principal Consultant

Talk to Analyst

Find your sweet spots for generating winning opportunities in this market.

Global Elastic Laminate Market Demand Analysis by Country

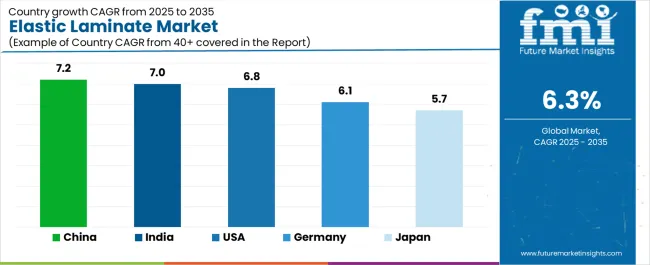
Countries Forecast CAGR (2024 to 2034)
The United States 1.40%
Germany 1.0%
China 4.30%
India 5.60%
Thailand 3.90%

The United States to Experience Limited Adoption of Elastic Laminates as it Reaches Maturity

In North America elastic laminate market, the United States owns an influential share due to its prominence in advanced healthcare practices. As the market is reaching maturity in the region, FMI has estimated United States is anticipated to expand at a CAGR of 1.4% through 2034.

Key players in the region like Nitto Denko Corporation are offering laminates with strong elastic film and soft nonwoven layers for application in tapes. The company develops elastic laminates in various widths or with a pre-perforation in the machine direction to facilitate optimal runability on converting lines.

Increasing pervasiveness of urinary incontinence in the adult population in the United States is raising the demand for adult incontinence diapers. This, along with the growing demand for baby diapers, is projected to continue expanding the regional market in the coming years. This is because elastic laminates find applications in the tapes used in adult incontinence and baby diapers.

New Players in Germany Taking Europe’s Elastic Laminate Market to New Heights

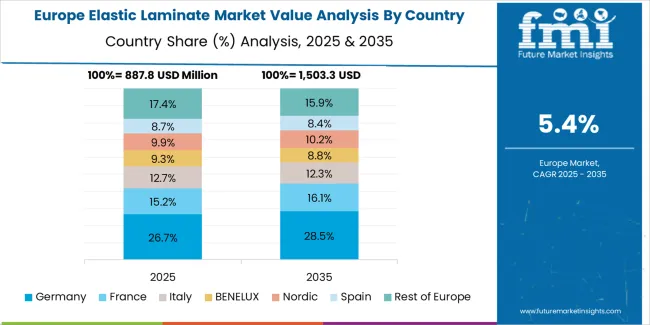
Germany is a key market for elastic laminates in Europe. The country is set to register a CAGR of 1% over the next decade. Like the United States, Germany too is heading for saturation in the global marketplace. However, the existence of established players is Germany is no bar for emerging players.

In May 2022, for instance, Pedilay Care GmbH declared the startup of an elastic nonwoven laminate conversion in Germany. The entrant, with its incorporation, answers the material needs of commercial and research and development customers in the hygiene, medical, and wellness industries.

The company, with the help of its stakeholders, has significantly invested in the production facility. The conversion rate offered by the firm, right in the heart of Europe, is expected to be a valued asset to the industry.

India to Offer Significant Prospects to Elastic Laminate Market Players

The elastic laminate industry in India is expected to head the future of elastic laminate. FMI analysts have estimated that the elastic laminate market is projected to account for 5.6% over the next 10 years.

The excellent stretch qualities of elastic laminates make them useful in the production of adult incontinence products, diapers, and feminine care products, as they enhance the comfort level of these products. The growing market for hygiene and wellness products, thanks to massive population, is attracting investors and stakeholders to India.

Nitto Denko Corporation, a global enterprise and leader in elastic laminate and film technology, also has its footprint in India. The company offers an extensive range of comfortable and soft features that are ideal for baby care products. The entity assists customers in producing and designing diapers with outstanding and lasting comfort.

Development of Performance-enhancing Materials to Drive Growth in China

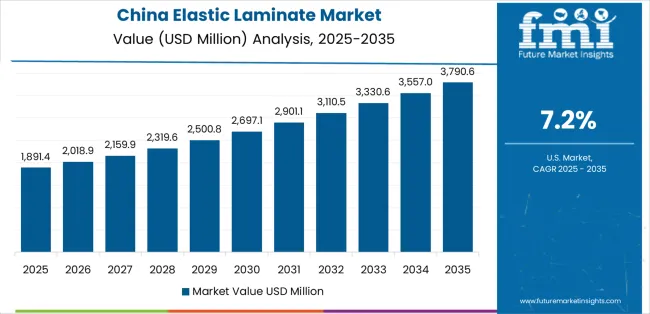
The elastic laminate industry in China is anticipated to expand at a CAGR of 4.3% over the forecast period. Massive demand for this product is coming from hygiene products manufacturers. Their use is crucial for enhancing the fit and performance of adult incontinence products, disposable diapers, and feminine hygiene items.

These laminates are also being extensively used in medical applications, like surgical drapes, wound dressings, and patient gowns. The rapidly expanding healthcare market is thus giving a strong base to the market demand for the core product.

In upcoming years, the market is expected to experience growth on the back of new performance-enhancing materials.

Players in Thailand Partnering with Local Distributors to Increase their Penetration

The elastic laminate industry in Thailand is expected to increase at a 3.9% CAGR over the forecast period. Due to surging demand, key players in the market are offering safe, sustainable, and comfortable solutions for feminine hygiene products, baby diapers, and discreet and dependable solutions for adult incontinence.

Players are further acquiring small associated competent companies to offer innovative products for adult incontinence, baby diapers, medical and femcare applications. By partnering with local distributors, industry participants are increasing their penetration in Thailand.

Key Strategies of the Leading Players

Key players are increasing their production capacity to meet the increasing demand among end users. Apart from this, they are shifting some of their focus from well-to-do countries to developing countries, by expanding their operations and enhancing the cost-effectiveness of the product. This is going to increase accessibility and affordability for products like diapers, adult incontinence pads, etc.

Industry participants are investing in research and development activities to develop surgical masks that offer more comfort. Market players are showcasing their product lines at exhibits to meet potential customers, exchange ideas, and discuss the latest trends and developments.

In addition to these strategies, players also have acquisitions and mergers, collaborations, and partnerships as their go-to tactics.

Get the data you need at a Fraction of the cost

Personalize your report by choosing insights you need
and save 40%!

Profile of Top 2 Key Players

  • Pantex International S.p.A.

Pantex International S.p.A., based in Italy, is a roll goods manufacturer that delivers premium materials for the hygienic market, supported by three technologically advanced film and nonwoven manufacturing plants. The company has production facilities in Italy and UAE to effectively meet the demands of customers in and out of Italy. The firm is equipped with a research and development team that designs and creates customized premium materials to be used in the femcare, adult, and baby care markets.

  • Mondi Group plc

Mondi Group plc, headquartered in the United Kingdom, is a packaging and paper MNC. The company offers a breadth of expertise and offers stretchable elastic laminate innovations. Key operations of the company are in North America, Europe, and Africa. In 2015, the company integrated Ascania Nonwoven Germany GmbH into Mondi’s Consumer Packaging Business Unit. This acquisition enhanced Mondi’s position as a preferred choice for hygiene components like elastic laminates for baby diapers and adult incontinence diapers.

News Covered by FMI on the Latest Market Developments

  • In March 2024, Avient Corporation launched its new Versaflex TF Adhesive Thermoplastic Elastomer (TPE) solutions for textile fabric laminations. The new solutions help maintain the softness, stretchability, and breathability of textile lamination. This facilitates uniform thickness and enhanced appearance in athletic apparel like underwear and sportswear.
  • In April 2023, RKW Group presented its extensive product portfolio of nonwovens and films for medical and hygiene applications at INDEX this year. INDEX offers a great opportunity for business partners to interact and exchange ideas and keep up with the trends in the global industry while focusing on a product range of innovative nonwovens, films, and laminates for medical applications and hygiene products.
  • In May 2022, Pedilay Care GmbH expanded its business portfolio with the acquisition of a new lamination line. The new line not only makes distinct elasticated non-woven laminates to be used for Pedilay’s products. The line also accommodates the anticipated requirements of external clients, with a key focus on wellness, hygiene, and medical industries. To round off its offering, material development capacity, and ancillary testing is available on-site.

Key Coverage in the Global Elastic Laminate Market Research Report

  • Adjacent Study of Elastic Composite Materials Market
  • In-depth Analysis of Elastic Laminate Market by Applications, Material Type, and Structure
  • Exhaustive List of Companies and their Strategies, with a Key Focus on Berry Global, Mondi Group plc, and Exxon Mobil Corporation

Enlisted Below are Some Top Market Players

  • Golden Phoenix Fiberwebs, Inc.
  • Pantex International S.p.A.
  • Neos Italia Srl
  • Mondi Group plc
  • Berry Global Group, Inc.
  • Exxon Mobil Corp
  • Tredegar Corporation
  • Schweitzer-Mauduit International, Inc.
  • Kraton Corporation
  • Aplix S.A.
  • Others

Global Market by Categories

By Material Type:

  • Ethylene-based Elastomers
  • Propylene-based Elastomers
  • Styrene-block Copolymers
  • Others (PET-based)

By Structure:

  • Elastic Strand Based
  • Elastic Film Based
  • Elastic Netting based
  • Elastic Nonwovens Based

By Application:

  • Medical
  • Hygiene
  • Other Applications

By Different Regional Markets are as Follows:

  • North America
  • Europe
  • Asia Pacific
  • Middle East and Africa
  • Latin America

Frequently Asked Questions

What is the Market Valuation of Elastic Laminate Market as of 2024?

Current projections of the elastic laminate market indicate a valuation of US$ 5.6 billion in 2024.

What is the Projected Adoption Rate of Elastic Laminate for the Years Between 2024 to 2034?

Looking ahead to 2034, the current forecast projects a CAGR of 2.7% for the encasement pipe industry.

How Much Revenue this Industry is Expected to Generate by 2034?

FMI predicts the market to reach US$ 7.3 billion by the year 2034.

Which Material Type Holds a Significant Market Share?

Propylene-based elastomers is predicted to hold a significant market share during the forecast period.

Which Country Offers Growth Opportunities?

India is predicted to offer opportunities for investors and stakeholders.

Which Players in the Elastic Laminate Industry are Influential?

Golden Phoenix Fiberwebs, Inc., Pantex International S.p.A., and Neos Italia Srl are powerful players in the elastic laminate industry.

Table of Content

1. Executive Summary

    1.1. Global Market Outlook

    1.2. Demand-side Trends

    1.3. Supply-side Trends

    1.4. Technology Roadmap Analysis

    1.5. Analysis and Recommendations

2. Market Overview

    2.1. Market Coverage / Taxonomy

    2.2. Market Definition / Scope / Limitations

3. Market Background

    3.1. Market Dynamics

        3.1.1. Drivers

        3.1.2. Restraints

        3.1.3. Opportunity

        3.1.4. Trends

    3.2. Scenario Forecast

        3.2.1. Demand in Optimistic Scenario

        3.2.2. Demand in Likely Scenario

        3.2.3. Demand in Conservative Scenario

    3.3. Opportunity Map Analysis

    3.4. Product Life Cycle Analysis

    3.5. Supply Chain Analysis

        3.5.1. Supply Side Participants and their Roles

            3.5.1.1. Manufacturer

            3.5.1.2. Mid-Level Participants

        3.5.2. Value Added and Value Created at Node in the Supply Chain

        3.5.3. List of Raw Material Suppliers

        3.5.4. List of Existing and Potential Buyer’s

    3.6. Investment Feasibility Matrix

    3.7. Value Chain Analysis

        3.7.1. Profit Margin Analysis

    3.8. PESTLE and Porter’s Analysis

    3.9. Regulatory Landscape

        3.9.1. By Key Regions

        3.9.2. By Key Countries

    3.10. Regional Parent Market Outlook

    3.11. Production and Consumption Statistics

    3.12. Import and Export Statistics

4. Global Market Analysis 2019 to 2023 and Forecast, 2024 to 2034

    4.1. Historical Market Size Value (US$ Million) & Volume (Tons) Analysis, 2019 to 2023

    4.2. Current and Future Market Size Value (US$ Million) & Volume (Tons) Projections, 2024 to 2034

        4.2.1. Y-o-Y Growth Trend Analysis

        4.2.2. Absolute $ Opportunity Analysis

5. Global Market Analysis 2019 to 2023 and Forecast 2024 to 2034, By Material Type

    5.1. Introduction / Key Findings

    5.2. Historical Market Size Value (US$ Million) & Volume (Tons) Analysis By Material Type, 2019 to 2023

    5.3. Current and Future Market Size Value (US$ Million) & Volume (Tons) Analysis and Forecast By Material Type, 2024 to 2034

        5.3.1. Ethylene-Based Elastomers

        5.3.2. Propylene-Based Elastomers

        5.3.3. Styrene-Block Copolymers

        5.3.4. Others (PET-based)

    5.4. Y-o-Y Growth Trend Analysis By Material Type, 2019 to 2023

    5.5. Absolute $ Opportunity Analysis By Material Type, 2024 to 2034

6. Global Market Analysis 2019 to 2023 and Forecast 2024 to 2034, By Structure

    6.1. Introduction / Key Findings

    6.2. Historical Market Size Value (US$ Million) & Volume (Tons) Analysis By Structure, 2019 to 2023

    6.3. Current and Future Market Size Value (US$ Million) & Volume (Tons) Analysis and Forecast By Structure, 2024 to 2034

        6.3.1. Elastic Strand Based

        6.3.2. Elastic Film Based

        6.3.3. Elastic Netting based

        6.3.4. Elastic Nonwovens Based

    6.4. Y-o-Y Growth Trend Analysis By Structure, 2019 to 2023

    6.5. Absolute $ Opportunity Analysis By Structure, 2024 to 2034

7. Global Market Analysis 2019 to 2023 and Forecast 2024 to 2034, By Application

    7.1. Introduction / Key Findings

    7.2. Historical Market Size Value (US$ Million) & Volume (Tons) Analysis By Application, 2019 to 2023

    7.3. Current and Future Market Size Value (US$ Million) & Volume (Tons) Analysis and Forecast By Application, 2024 to 2034

        7.3.1. Medical

        7.3.2. Hygiene

        7.3.3. Other Applications

    7.4. Y-o-Y Growth Trend Analysis By Application, 2019 to 2023

    7.5. Absolute $ Opportunity Analysis By Application, 2024 to 2034

8. Global Market Analysis 2019 to 2023 and Forecast 2024 to 2034, By Region

    8.1. Introduction

    8.2. Historical Market Size Value (US$ Million) & Volume (Tons) Analysis By Region, 2019 to 2023

    8.3. Current Market Size Value (US$ Million) & Volume (Tons) Analysis and Forecast By Region, 2024 to 2034

        8.3.1. North America

        8.3.2. Latin America

        8.3.3. Western Europe

        8.3.4. Eastern Europe

        8.3.5. South Asia and Pacific

        8.3.6. East Asia

        8.3.7. Middle East and Africa

    8.4. Market Attractiveness Analysis By Region

9. North America Market Analysis 2019 to 2023 and Forecast 2024 to 2034, By Country

    9.1. Historical Market Size Value (US$ Million) & Volume (Tons) Trend Analysis By Market Taxonomy, 2019 to 2023

    9.2. Market Size Value (US$ Million) & Volume (Tons) Forecast By Market Taxonomy, 2024 to 2034

        9.2.1. By Country

            9.2.1.1. USA

            9.2.1.2. Canada

        9.2.2. By Material Type

        9.2.3. By Structure

        9.2.4. By Application

    9.3. Market Attractiveness Analysis

        9.3.1. By Country

        9.3.2. By Material Type

        9.3.3. By Structure

        9.3.4. By Application

    9.4. Key Takeaways

10. Latin America Market Analysis 2019 to 2023 and Forecast 2024 to 2034, By Country

    10.1. Historical Market Size Value (US$ Million) & Volume (Tons) Trend Analysis By Market Taxonomy, 2019 to 2023

    10.2. Market Size Value (US$ Million) & Volume (Tons) Forecast By Market Taxonomy, 2024 to 2034

        10.2.1. By Country

            10.2.1.1. Brazil

            10.2.1.2. Mexico

            10.2.1.3. Rest of Latin America

        10.2.2. By Material Type

        10.2.3. By Structure

        10.2.4. By Application

    10.3. Market Attractiveness Analysis

        10.3.1. By Country

        10.3.2. By Material Type

        10.3.3. By Structure

        10.3.4. By Application

    10.4. Key Takeaways

11. Western Europe Market Analysis 2019 to 2023 and Forecast 2024 to 2034, By Country

    11.1. Historical Market Size Value (US$ Million) & Volume (Tons) Trend Analysis By Market Taxonomy, 2019 to 2023

    11.2. Market Size Value (US$ Million) & Volume (Tons) Forecast By Market Taxonomy, 2024 to 2034

        11.2.1. By Country

            11.2.1.1. Germany

            11.2.1.2. UK

            11.2.1.3. France

            11.2.1.4. Spain

            11.2.1.5. Italy

            11.2.1.6. Rest of Western Europe

        11.2.2. By Material Type

        11.2.3. By Structure

        11.2.4. By Application

    11.3. Market Attractiveness Analysis

        11.3.1. By Country

        11.3.2. By Material Type

        11.3.3. By Structure

        11.3.4. By Application

    11.4. Key Takeaways

12. Eastern Europe Market Analysis 2019 to 2023 and Forecast 2024 to 2034, By Country

    12.1. Historical Market Size Value (US$ Million) & Volume (Tons) Trend Analysis By Market Taxonomy, 2019 to 2023

    12.2. Market Size Value (US$ Million) & Volume (Tons) Forecast By Market Taxonomy, 2024 to 2034

        12.2.1. By Country

            12.2.1.1. Poland

            12.2.1.2. Russia

            12.2.1.3. Czech Republic

            12.2.1.4. Romania

            12.2.1.5. Rest of Eastern Europe

        12.2.2. By Material Type

        12.2.3. By Structure

        12.2.4. By Application

    12.3. Market Attractiveness Analysis

        12.3.1. By Country

        12.3.2. By Material Type

        12.3.3. By Structure

        12.3.4. By Application

    12.4. Key Takeaways

13. South Asia and Pacific Market Analysis 2019 to 2023 and Forecast 2024 to 2034, By Country

    13.1. Historical Market Size Value (US$ Million) & Volume (Tons) Trend Analysis By Market Taxonomy, 2019 to 2023

    13.2. Market Size Value (US$ Million) & Volume (Tons) Forecast By Market Taxonomy, 2024 to 2034

        13.2.1. By Country

            13.2.1.1. India

            13.2.1.2. Bangladesh

            13.2.1.3. Australia

            13.2.1.4. New Zealand

            13.2.1.5. Rest of South Asia and Pacific

        13.2.2. By Material Type

        13.2.3. By Structure

        13.2.4. By Application

    13.3. Market Attractiveness Analysis

        13.3.1. By Country

        13.3.2. By Material Type

        13.3.3. By Structure

        13.3.4. By Application

    13.4. Key Takeaways

14. East Asia Market Analysis 2019 to 2023 and Forecast 2024 to 2034, By Country

    14.1. Historical Market Size Value (US$ Million) & Volume (Tons) Trend Analysis By Market Taxonomy, 2019 to 2023

    14.2. Market Size Value (US$ Million) & Volume (Tons) Forecast By Market Taxonomy, 2024 to 2034

        14.2.1. By Country

            14.2.1.1. China

            14.2.1.2. Japan

            14.2.1.3. South Korea

        14.2.2. By Material Type

        14.2.3. By Structure

        14.2.4. By Application

    14.3. Market Attractiveness Analysis

        14.3.1. By Country

        14.3.2. By Material Type

        14.3.3. By Structure

        14.3.4. By Application

    14.4. Key Takeaways

15. Middle East and Africa Market Analysis 2019 to 2023 and Forecast 2024 to 2034, By Country

    15.1. Historical Market Size Value (US$ Million) & Volume (Tons) Trend Analysis By Market Taxonomy, 2019 to 2023

    15.2. Market Size Value (US$ Million) & Volume (Tons) Forecast By Market Taxonomy, 2024 to 2034

        15.2.1. By Country

            15.2.1.1. GCC Countries

            15.2.1.2. South Africa

            15.2.1.3. Israel

            15.2.1.4. Rest of MEA

        15.2.2. By Material Type

        15.2.3. By Structure

        15.2.4. By Application

    15.3. Market Attractiveness Analysis

        15.3.1. By Country

        15.3.2. By Material Type

        15.3.3. By Structure

        15.3.4. By Application

    15.4. Key Takeaways

16. Key Countries Market Analysis

    16.1. USA

        16.1.1. Pricing Analysis

        16.1.2. Market Share Analysis, 2023

            16.1.2.1. By Material Type

            16.1.2.2. By Structure

            16.1.2.3. By Application

    16.2. Canada

        16.2.1. Pricing Analysis

        16.2.2. Market Share Analysis, 2023

            16.2.2.1. By Material Type

            16.2.2.2. By Structure

            16.2.2.3. By Application

    16.3. Brazil

        16.3.1. Pricing Analysis

        16.3.2. Market Share Analysis, 2023

            16.3.2.1. By Material Type

            16.3.2.2. By Structure

            16.3.2.3. By Application

    16.4. Mexico

        16.4.1. Pricing Analysis

        16.4.2. Market Share Analysis, 2023

            16.4.2.1. By Material Type

            16.4.2.2. By Structure

            16.4.2.3. By Application

    16.5. Germany

        16.5.1. Pricing Analysis

        16.5.2. Market Share Analysis, 2023

            16.5.2.1. By Material Type

            16.5.2.2. By Structure

            16.5.2.3. By Application

    16.6. UK

        16.6.1. Pricing Analysis

        16.6.2. Market Share Analysis, 2023

            16.6.2.1. By Material Type

            16.6.2.2. By Structure

            16.6.2.3. By Application

    16.7. France

        16.7.1. Pricing Analysis

        16.7.2. Market Share Analysis, 2023

            16.7.2.1. By Material Type

            16.7.2.2. By Structure

            16.7.2.3. By Application

    16.8. Spain

        16.8.1. Pricing Analysis

        16.8.2. Market Share Analysis, 2023

            16.8.2.1. By Material Type

            16.8.2.2. By Structure

            16.8.2.3. By Application

    16.9. Italy

        16.9.1. Pricing Analysis

        16.9.2. Market Share Analysis, 2023

            16.9.2.1. By Material Type

            16.9.2.2. By Structure

            16.9.2.3. By Application

    16.10. Poland

        16.10.1. Pricing Analysis

        16.10.2. Market Share Analysis, 2023

            16.10.2.1. By Material Type

            16.10.2.2. By Structure

            16.10.2.3. By Application

    16.11. Russia

        16.11.1. Pricing Analysis

        16.11.2. Market Share Analysis, 2023

            16.11.2.1. By Material Type

            16.11.2.2. By Structure

            16.11.2.3. By Application

    16.12. Czech Republic

        16.12.1. Pricing Analysis

        16.12.2. Market Share Analysis, 2023

            16.12.2.1. By Material Type

            16.12.2.2. By Structure

            16.12.2.3. By Application

    16.13. Romania

        16.13.1. Pricing Analysis

        16.13.2. Market Share Analysis, 2023

            16.13.2.1. By Material Type

            16.13.2.2. By Structure

            16.13.2.3. By Application

    16.14. India

        16.14.1. Pricing Analysis

        16.14.2. Market Share Analysis, 2023

            16.14.2.1. By Material Type

            16.14.2.2. By Structure

            16.14.2.3. By Application

    16.15. Bangladesh

        16.15.1. Pricing Analysis

        16.15.2. Market Share Analysis, 2023

            16.15.2.1. By Material Type

            16.15.2.2. By Structure

            16.15.2.3. By Application

    16.16. Australia

        16.16.1. Pricing Analysis

        16.16.2. Market Share Analysis, 2023

            16.16.2.1. By Material Type

            16.16.2.2. By Structure

            16.16.2.3. By Application

    16.17. New Zealand

        16.17.1. Pricing Analysis

        16.17.2. Market Share Analysis, 2023

            16.17.2.1. By Material Type

            16.17.2.2. By Structure

            16.17.2.3. By Application

    16.18. China

        16.18.1. Pricing Analysis

        16.18.2. Market Share Analysis, 2023

            16.18.2.1. By Material Type

            16.18.2.2. By Structure

            16.18.2.3. By Application

    16.19. Japan

        16.19.1. Pricing Analysis

        16.19.2. Market Share Analysis, 2023

            16.19.2.1. By Material Type

            16.19.2.2. By Structure

            16.19.2.3. By Application

    16.20. South Korea

        16.20.1. Pricing Analysis

        16.20.2. Market Share Analysis, 2023

            16.20.2.1. By Material Type

            16.20.2.2. By Structure

            16.20.2.3. By Application

    16.21. GCC Countries

        16.21.1. Pricing Analysis

        16.21.2. Market Share Analysis, 2023

            16.21.2.1. By Material Type

            16.21.2.2. By Structure

            16.21.2.3. By Application

    16.22. South Africa

        16.22.1. Pricing Analysis

        16.22.2. Market Share Analysis, 2023

            16.22.2.1. By Material Type

            16.22.2.2. By Structure

            16.22.2.3. By Application

    16.23. Israel

        16.23.1. Pricing Analysis

        16.23.2. Market Share Analysis, 2023

            16.23.2.1. By Material Type

            16.23.2.2. By Structure

            16.23.2.3. By Application

17. Market Structure Analysis

    17.1. Competition Dashboard

    17.2. Competition Benchmarking

    17.3. Market Share Analysis of Top Players

        17.3.1. By Regional

        17.3.2. By Material Type

        17.3.3. By Structure

        17.3.4. By Application

18. Competition Analysis

    18.1. Competition Deep Dive

        18.1.1. Golden Phoenix Fiberwebs, Inc.

            18.1.1.1. Overview

            18.1.1.2. Product Portfolio

            18.1.1.3. Profitability by Market Segments

            18.1.1.4. Sales Footprint

            18.1.1.5. Strategy Overview

                18.1.1.5.1. Marketing Strategy

                18.1.1.5.2. Product Strategy

                18.1.1.5.3. Channel Strategy

        18.1.2. Pantex International S.p.A.

            18.1.2.1. Overview

            18.1.2.2. Product Portfolio

            18.1.2.3. Profitability by Market Segments

            18.1.2.4. Sales Footprint

            18.1.2.5. Strategy Overview

                18.1.2.5.1. Marketing Strategy

                18.1.2.5.2. Product Strategy

                18.1.2.5.3. Channel Strategy

        18.1.3. Neos Italia Srl

            18.1.3.1. Overview

            18.1.3.2. Product Portfolio

            18.1.3.3. Profitability by Market Segments

            18.1.3.4. Sales Footprint

            18.1.3.5. Strategy Overview

                18.1.3.5.1. Marketing Strategy

                18.1.3.5.2. Product Strategy

                18.1.3.5.3. Channel Strategy

        18.1.4. Mondi Group plc

            18.1.4.1. Overview

            18.1.4.2. Product Portfolio

            18.1.4.3. Profitability by Market Segments

            18.1.4.4. Sales Footprint

            18.1.4.5. Strategy Overview

                18.1.4.5.1. Marketing Strategy

                18.1.4.5.2. Product Strategy

                18.1.4.5.3. Channel Strategy

        18.1.5. Berry Global Group, Inc.

            18.1.5.1. Overview

            18.1.5.2. Product Portfolio

            18.1.5.3. Profitability by Market Segments

            18.1.5.4. Sales Footprint

            18.1.5.5. Strategy Overview

                18.1.5.5.1. Marketing Strategy

                18.1.5.5.2. Product Strategy

                18.1.5.5.3. Channel Strategy

        18.1.6. Exxon Mobil Corp

            18.1.6.1. Overview

            18.1.6.2. Product Portfolio

            18.1.6.3. Profitability by Market Segments

            18.1.6.4. Sales Footprint

            18.1.6.5. Strategy Overview

                18.1.6.5.1. Marketing Strategy

                18.1.6.5.2. Product Strategy

                18.1.6.5.3. Channel Strategy

        18.1.7. Tredegar Corporation

            18.1.7.1. Overview

            18.1.7.2. Product Portfolio

            18.1.7.3. Profitability by Market Segments

            18.1.7.4. Sales Footprint

            18.1.7.5. Strategy Overview

                18.1.7.5.1. Marketing Strategy

                18.1.7.5.2. Product Strategy

                18.1.7.5.3. Channel Strategy

        18.1.8. Schweitzer-Mauduit International, Inc.

            18.1.8.1. Overview

            18.1.8.2. Product Portfolio

            18.1.8.3. Profitability by Market Segments

            18.1.8.4. Sales Footprint

            18.1.8.5. Strategy Overview

                18.1.8.5.1. Marketing Strategy

                18.1.8.5.2. Product Strategy

                18.1.8.5.3. Channel Strategy

        18.1.9. Kraton Corporation

            18.1.9.1. Overview

            18.1.9.2. Product Portfolio

            18.1.9.3. Profitability by Market Segments

            18.1.9.4. Sales Footprint

            18.1.9.5. Strategy Overview

                18.1.9.5.1. Marketing Strategy

                18.1.9.5.2. Product Strategy

                18.1.9.5.3. Channel Strategy

        18.1.10. Aplix S.A.

            18.1.10.1. Overview

            18.1.10.2. Product Portfolio

            18.1.10.3. Profitability by Market Segments

            18.1.10.4. Sales Footprint

            18.1.10.5. Strategy Overview

                18.1.10.5.1. Marketing Strategy

                18.1.10.5.2. Product Strategy

                18.1.10.5.3. Channel Strategy

19. Assumptions & Acronyms Used

20. Research Methodology

Don't pay for what you don't need

Customize your report by selecting specific countries or regions and save 30%!

List of Tables

Table 1: Global Market Value (US$ Million) Forecast by Region, 2019 to 2034

Table 2: Global Market Volume (Tons) Forecast by Region, 2019 to 2034

Table 3: Global Market Value (US$ Million) Forecast by Material Type, 2019 to 2034

Table 4: Global Market Volume (Tons) Forecast by Material Type, 2019 to 2034

Table 5: Global Market Value (US$ Million) Forecast by Structure, 2019 to 2034

Table 6: Global Market Volume (Tons) Forecast by Structure, 2019 to 2034

Table 7: Global Market Value (US$ Million) Forecast by Application, 2019 to 2034

Table 8: Global Market Volume (Tons) Forecast by Application, 2019 to 2034

Table 9: North America Market Value (US$ Million) Forecast by Country, 2019 to 2034

Table 10: North America Market Volume (Tons) Forecast by Country, 2019 to 2034

Table 11: North America Market Value (US$ Million) Forecast by Material Type, 2019 to 2034

Table 12: North America Market Volume (Tons) Forecast by Material Type, 2019 to 2034

Table 13: North America Market Value (US$ Million) Forecast by Structure, 2019 to 2034

Table 14: North America Market Volume (Tons) Forecast by Structure, 2019 to 2034

Table 15: North America Market Value (US$ Million) Forecast by Application, 2019 to 2034

Table 16: North America Market Volume (Tons) Forecast by Application, 2019 to 2034

Table 17: Latin America Market Value (US$ Million) Forecast by Country, 2019 to 2034

Table 18: Latin America Market Volume (Tons) Forecast by Country, 2019 to 2034

Table 19: Latin America Market Value (US$ Million) Forecast by Material Type, 2019 to 2034

Table 20: Latin America Market Volume (Tons) Forecast by Material Type, 2019 to 2034

Table 21: Latin America Market Value (US$ Million) Forecast by Structure, 2019 to 2034

Table 22: Latin America Market Volume (Tons) Forecast by Structure, 2019 to 2034

Table 23: Latin America Market Value (US$ Million) Forecast by Application, 2019 to 2034

Table 24: Latin America Market Volume (Tons) Forecast by Application, 2019 to 2034

Table 25: Western Europe Market Value (US$ Million) Forecast by Country, 2019 to 2034

Table 26: Western Europe Market Volume (Tons) Forecast by Country, 2019 to 2034

Table 27: Western Europe Market Value (US$ Million) Forecast by Material Type, 2019 to 2034

Table 28: Western Europe Market Volume (Tons) Forecast by Material Type, 2019 to 2034

Table 29: Western Europe Market Value (US$ Million) Forecast by Structure, 2019 to 2034

Table 30: Western Europe Market Volume (Tons) Forecast by Structure, 2019 to 2034

Table 31: Western Europe Market Value (US$ Million) Forecast by Application, 2019 to 2034

Table 32: Western Europe Market Volume (Tons) Forecast by Application, 2019 to 2034

Table 33: Eastern Europe Market Value (US$ Million) Forecast by Country, 2019 to 2034

Table 34: Eastern Europe Market Volume (Tons) Forecast by Country, 2019 to 2034

Table 35: Eastern Europe Market Value (US$ Million) Forecast by Material Type, 2019 to 2034

Table 36: Eastern Europe Market Volume (Tons) Forecast by Material Type, 2019 to 2034

Table 37: Eastern Europe Market Value (US$ Million) Forecast by Structure, 2019 to 2034

Table 38: Eastern Europe Market Volume (Tons) Forecast by Structure, 2019 to 2034

Table 39: Eastern Europe Market Value (US$ Million) Forecast by Application, 2019 to 2034

Table 40: Eastern Europe Market Volume (Tons) Forecast by Application, 2019 to 2034

Table 41: South Asia and Pacific Market Value (US$ Million) Forecast by Country, 2019 to 2034

Table 42: South Asia and Pacific Market Volume (Tons) Forecast by Country, 2019 to 2034

Table 43: South Asia and Pacific Market Value (US$ Million) Forecast by Material Type, 2019 to 2034

Table 44: South Asia and Pacific Market Volume (Tons) Forecast by Material Type, 2019 to 2034

Table 45: South Asia and Pacific Market Value (US$ Million) Forecast by Structure, 2019 to 2034

Table 46: South Asia and Pacific Market Volume (Tons) Forecast by Structure, 2019 to 2034

Table 47: South Asia and Pacific Market Value (US$ Million) Forecast by Application, 2019 to 2034

Table 48: South Asia and Pacific Market Volume (Tons) Forecast by Application, 2019 to 2034

Table 49: East Asia Market Value (US$ Million) Forecast by Country, 2019 to 2034

Table 50: East Asia Market Volume (Tons) Forecast by Country, 2019 to 2034

Table 51: East Asia Market Value (US$ Million) Forecast by Material Type, 2019 to 2034

Table 52: East Asia Market Volume (Tons) Forecast by Material Type, 2019 to 2034

Table 53: East Asia Market Value (US$ Million) Forecast by Structure, 2019 to 2034

Table 54: East Asia Market Volume (Tons) Forecast by Structure, 2019 to 2034

Table 55: East Asia Market Value (US$ Million) Forecast by Application, 2019 to 2034

Table 56: East Asia Market Volume (Tons) Forecast by Application, 2019 to 2034

Table 57: Middle East and Africa Market Value (US$ Million) Forecast by Country, 2019 to 2034

Table 58: Middle East and Africa Market Volume (Tons) Forecast by Country, 2019 to 2034

Table 59: Middle East and Africa Market Value (US$ Million) Forecast by Material Type, 2019 to 2034

Table 60: Middle East and Africa Market Volume (Tons) Forecast by Material Type, 2019 to 2034

Table 61: Middle East and Africa Market Value (US$ Million) Forecast by Structure, 2019 to 2034

Table 62: Middle East and Africa Market Volume (Tons) Forecast by Structure, 2019 to 2034

Table 63: Middle East and Africa Market Value (US$ Million) Forecast by Application, 2019 to 2034

Table 64: Middle East and Africa Market Volume (Tons) Forecast by Application, 2019 to 2034
Ismail Sutaria
Ismail Sutaria

Principal Consultant

Talk to Analyst

Find your sweet spots for generating winning opportunities in this market.

List of Charts

Figure 1: Global Market Value (US$ Million) by Material Type, 2024 to 2034

Figure 2: Global Market Value (US$ Million) by Structure, 2024 to 2034

Figure 3: Global Market Value (US$ Million) by Application, 2024 to 2034

Figure 4: Global Market Value (US$ Million) by Region, 2024 to 2034

Figure 5: Global Market Value (US$ Million) Analysis by Region, 2019 to 2034

Figure 6: Global Market Volume (Tons) Analysis by Region, 2019 to 2034

Figure 7: Global Market Value Share (%) and BPS Analysis by Region, 2024 to 2034

Figure 8: Global Market Y-o-Y Growth (%) Projections by Region, 2024 to 2034

Figure 9: Global Market Value (US$ Million) Analysis by Material Type, 2019 to 2034

Figure 10: Global Market Volume (Tons) Analysis by Material Type, 2019 to 2034

Figure 11: Global Market Value Share (%) and BPS Analysis by Material Type, 2024 to 2034

Figure 12: Global Market Y-o-Y Growth (%) Projections by Material Type, 2024 to 2034

Figure 13: Global Market Value (US$ Million) Analysis by Structure, 2019 to 2034

Figure 14: Global Market Volume (Tons) Analysis by Structure, 2019 to 2034

Figure 15: Global Market Value Share (%) and BPS Analysis by Structure, 2024 to 2034

Figure 16: Global Market Y-o-Y Growth (%) Projections by Structure, 2024 to 2034

Figure 17: Global Market Value (US$ Million) Analysis by Application, 2019 to 2034

Figure 18: Global Market Volume (Tons) Analysis by Application, 2019 to 2034

Figure 19: Global Market Value Share (%) and BPS Analysis by Application, 2024 to 2034

Figure 20: Global Market Y-o-Y Growth (%) Projections by Application, 2024 to 2034

Figure 21: Global Market Attractiveness by Material Type, 2024 to 2034

Figure 22: Global Market Attractiveness by Structure, 2024 to 2034

Figure 23: Global Market Attractiveness by Application, 2024 to 2034

Figure 24: Global Market Attractiveness by Region, 2024 to 2034

Figure 25: North America Market Value (US$ Million) by Material Type, 2024 to 2034

Figure 26: North America Market Value (US$ Million) by Structure, 2024 to 2034

Figure 27: North America Market Value (US$ Million) by Application, 2024 to 2034

Figure 28: North America Market Value (US$ Million) by Country, 2024 to 2034

Figure 29: North America Market Value (US$ Million) Analysis by Country, 2019 to 2034

Figure 30: North America Market Volume (Tons) Analysis by Country, 2019 to 2034

Figure 31: North America Market Value Share (%) and BPS Analysis by Country, 2024 to 2034

Figure 32: North America Market Y-o-Y Growth (%) Projections by Country, 2024 to 2034

Figure 33: North America Market Value (US$ Million) Analysis by Material Type, 2019 to 2034

Figure 34: North America Market Volume (Tons) Analysis by Material Type, 2019 to 2034

Figure 35: North America Market Value Share (%) and BPS Analysis by Material Type, 2024 to 2034

Figure 36: North America Market Y-o-Y Growth (%) Projections by Material Type, 2024 to 2034

Figure 37: North America Market Value (US$ Million) Analysis by Structure, 2019 to 2034

Figure 38: North America Market Volume (Tons) Analysis by Structure, 2019 to 2034

Figure 39: North America Market Value Share (%) and BPS Analysis by Structure, 2024 to 2034

Figure 40: North America Market Y-o-Y Growth (%) Projections by Structure, 2024 to 2034

Figure 41: North America Market Value (US$ Million) Analysis by Application, 2019 to 2034

Figure 42: North America Market Volume (Tons) Analysis by Application, 2019 to 2034

Figure 43: North America Market Value Share (%) and BPS Analysis by Application, 2024 to 2034

Figure 44: North America Market Y-o-Y Growth (%) Projections by Application, 2024 to 2034

Figure 45: North America Market Attractiveness by Material Type, 2024 to 2034

Figure 46: North America Market Attractiveness by Structure, 2024 to 2034

Figure 47: North America Market Attractiveness by Application, 2024 to 2034

Figure 48: North America Market Attractiveness by Country, 2024 to 2034

Figure 49: Latin America Market Value (US$ Million) by Material Type, 2024 to 2034

Figure 50: Latin America Market Value (US$ Million) by Structure, 2024 to 2034

Figure 51: Latin America Market Value (US$ Million) by Application, 2024 to 2034

Figure 52: Latin America Market Value (US$ Million) by Country, 2024 to 2034

Figure 53: Latin America Market Value (US$ Million) Analysis by Country, 2019 to 2034

Figure 54: Latin America Market Volume (Tons) Analysis by Country, 2019 to 2034

Figure 55: Latin America Market Value Share (%) and BPS Analysis by Country, 2024 to 2034

Figure 56: Latin America Market Y-o-Y Growth (%) Projections by Country, 2024 to 2034

Figure 57: Latin America Market Value (US$ Million) Analysis by Material Type, 2019 to 2034

Figure 58: Latin America Market Volume (Tons) Analysis by Material Type, 2019 to 2034

Figure 59: Latin America Market Value Share (%) and BPS Analysis by Material Type, 2024 to 2034

Figure 60: Latin America Market Y-o-Y Growth (%) Projections by Material Type, 2024 to 2034

Figure 61: Latin America Market Value (US$ Million) Analysis by Structure, 2019 to 2034

Figure 62: Latin America Market Volume (Tons) Analysis by Structure, 2019 to 2034

Figure 63: Latin America Market Value Share (%) and BPS Analysis by Structure, 2024 to 2034

Figure 64: Latin America Market Y-o-Y Growth (%) Projections by Structure, 2024 to 2034

Figure 65: Latin America Market Value (US$ Million) Analysis by Application, 2019 to 2034

Figure 66: Latin America Market Volume (Tons) Analysis by Application, 2019 to 2034

Figure 67: Latin America Market Value Share (%) and BPS Analysis by Application, 2024 to 2034

Figure 68: Latin America Market Y-o-Y Growth (%) Projections by Application, 2024 to 2034

Figure 69: Latin America Market Attractiveness by Material Type, 2024 to 2034

Figure 70: Latin America Market Attractiveness by Structure, 2024 to 2034

Figure 71: Latin America Market Attractiveness by Application, 2024 to 2034

Figure 72: Latin America Market Attractiveness by Country, 2024 to 2034

Figure 73: Western Europe Market Value (US$ Million) by Material Type, 2024 to 2034

Figure 74: Western Europe Market Value (US$ Million) by Structure, 2024 to 2034

Figure 75: Western Europe Market Value (US$ Million) by Application, 2024 to 2034

Figure 76: Western Europe Market Value (US$ Million) by Country, 2024 to 2034

Figure 77: Western Europe Market Value (US$ Million) Analysis by Country, 2019 to 2034

Figure 78: Western Europe Market Volume (Tons) Analysis by Country, 2019 to 2034

Figure 79: Western Europe Market Value Share (%) and BPS Analysis by Country, 2024 to 2034

Figure 80: Western Europe Market Y-o-Y Growth (%) Projections by Country, 2024 to 2034

Figure 81: Western Europe Market Value (US$ Million) Analysis by Material Type, 2019 to 2034

Figure 82: Western Europe Market Volume (Tons) Analysis by Material Type, 2019 to 2034

Figure 83: Western Europe Market Value Share (%) and BPS Analysis by Material Type, 2024 to 2034

Figure 84: Western Europe Market Y-o-Y Growth (%) Projections by Material Type, 2024 to 2034

Figure 85: Western Europe Market Value (US$ Million) Analysis by Structure, 2019 to 2034

Figure 86: Western Europe Market Volume (Tons) Analysis by Structure, 2019 to 2034

Figure 87: Western Europe Market Value Share (%) and BPS Analysis by Structure, 2024 to 2034

Figure 88: Western Europe Market Y-o-Y Growth (%) Projections by Structure, 2024 to 2034

Figure 89: Western Europe Market Value (US$ Million) Analysis by Application, 2019 to 2034

Figure 90: Western Europe Market Volume (Tons) Analysis by Application, 2019 to 2034

Figure 91: Western Europe Market Value Share (%) and BPS Analysis by Application, 2024 to 2034

Figure 92: Western Europe Market Y-o-Y Growth (%) Projections by Application, 2024 to 2034

Figure 93: Western Europe Market Attractiveness by Material Type, 2024 to 2034

Figure 94: Western Europe Market Attractiveness by Structure, 2024 to 2034

Figure 95: Western Europe Market Attractiveness by Application, 2024 to 2034

Figure 96: Western Europe Market Attractiveness by Country, 2024 to 2034

Figure 97: Eastern Europe Market Value (US$ Million) by Material Type, 2024 to 2034

Figure 98: Eastern Europe Market Value (US$ Million) by Structure, 2024 to 2034

Figure 99: Eastern Europe Market Value (US$ Million) by Application, 2024 to 2034

Figure 100: Eastern Europe Market Value (US$ Million) by Country, 2024 to 2034

Figure 101: Eastern Europe Market Value (US$ Million) Analysis by Country, 2019 to 2034

Figure 102: Eastern Europe Market Volume (Tons) Analysis by Country, 2019 to 2034

Figure 103: Eastern Europe Market Value Share (%) and BPS Analysis by Country, 2024 to 2034

Figure 104: Eastern Europe Market Y-o-Y Growth (%) Projections by Country, 2024 to 2034

Figure 105: Eastern Europe Market Value (US$ Million) Analysis by Material Type, 2019 to 2034

Figure 106: Eastern Europe Market Volume (Tons) Analysis by Material Type, 2019 to 2034

Figure 107: Eastern Europe Market Value Share (%) and BPS Analysis by Material Type, 2024 to 2034

Figure 108: Eastern Europe Market Y-o-Y Growth (%) Projections by Material Type, 2024 to 2034

Figure 109: Eastern Europe Market Value (US$ Million) Analysis by Structure, 2019 to 2034

Figure 110: Eastern Europe Market Volume (Tons) Analysis by Structure, 2019 to 2034

Figure 111: Eastern Europe Market Value Share (%) and BPS Analysis by Structure, 2024 to 2034

Figure 112: Eastern Europe Market Y-o-Y Growth (%) Projections by Structure, 2024 to 2034

Figure 113: Eastern Europe Market Value (US$ Million) Analysis by Application, 2019 to 2034

Figure 114: Eastern Europe Market Volume (Tons) Analysis by Application, 2019 to 2034

Figure 115: Eastern Europe Market Value Share (%) and BPS Analysis by Application, 2024 to 2034

Figure 116: Eastern Europe Market Y-o-Y Growth (%) Projections by Application, 2024 to 2034

Figure 117: Eastern Europe Market Attractiveness by Material Type, 2024 to 2034

Figure 118: Eastern Europe Market Attractiveness by Structure, 2024 to 2034

Figure 119: Eastern Europe Market Attractiveness by Application, 2024 to 2034

Figure 120: Eastern Europe Market Attractiveness by Country, 2024 to 2034

Figure 121: South Asia and Pacific Market Value (US$ Million) by Material Type, 2024 to 2034

Figure 122: South Asia and Pacific Market Value (US$ Million) by Structure, 2024 to 2034

Figure 123: South Asia and Pacific Market Value (US$ Million) by Application, 2024 to 2034

Figure 124: South Asia and Pacific Market Value (US$ Million) by Country, 2024 to 2034

Figure 125: South Asia and Pacific Market Value (US$ Million) Analysis by Country, 2019 to 2034

Figure 126: South Asia and Pacific Market Volume (Tons) Analysis by Country, 2019 to 2034

Figure 127: South Asia and Pacific Market Value Share (%) and BPS Analysis by Country, 2024 to 2034

Figure 128: South Asia and Pacific Market Y-o-Y Growth (%) Projections by Country, 2024 to 2034

Figure 129: South Asia and Pacific Market Value (US$ Million) Analysis by Material Type, 2019 to 2034

Figure 130: South Asia and Pacific Market Volume (Tons) Analysis by Material Type, 2019 to 2034

Figure 131: South Asia and Pacific Market Value Share (%) and BPS Analysis by Material Type, 2024 to 2034

Figure 132: South Asia and Pacific Market Y-o-Y Growth (%) Projections by Material Type, 2024 to 2034

Figure 133: South Asia and Pacific Market Value (US$ Million) Analysis by Structure, 2019 to 2034

Figure 134: South Asia and Pacific Market Volume (Tons) Analysis by Structure, 2019 to 2034

Figure 135: South Asia and Pacific Market Value Share (%) and BPS Analysis by Structure, 2024 to 2034

Figure 136: South Asia and Pacific Market Y-o-Y Growth (%) Projections by Structure, 2024 to 2034

Figure 137: South Asia and Pacific Market Value (US$ Million) Analysis by Application, 2019 to 2034

Figure 138: South Asia and Pacific Market Volume (Tons) Analysis by Application, 2019 to 2034

Figure 139: South Asia and Pacific Market Value Share (%) and BPS Analysis by Application, 2024 to 2034

Figure 140: South Asia and Pacific Market Y-o-Y Growth (%) Projections by Application, 2024 to 2034

Figure 141: South Asia and Pacific Market Attractiveness by Material Type, 2024 to 2034

Figure 142: South Asia and Pacific Market Attractiveness by Structure, 2024 to 2034

Figure 143: South Asia and Pacific Market Attractiveness by Application, 2024 to 2034

Figure 144: South Asia and Pacific Market Attractiveness by Country, 2024 to 2034

Figure 145: East Asia Market Value (US$ Million) by Material Type, 2024 to 2034

Figure 146: East Asia Market Value (US$ Million) by Structure, 2024 to 2034

Figure 147: East Asia Market Value (US$ Million) by Application, 2024 to 2034

Figure 148: East Asia Market Value (US$ Million) by Country, 2024 to 2034

Figure 149: East Asia Market Value (US$ Million) Analysis by Country, 2019 to 2034

Figure 150: East Asia Market Volume (Tons) Analysis by Country, 2019 to 2034

Figure 151: East Asia Market Value Share (%) and BPS Analysis by Country, 2024 to 2034

Figure 152: East Asia Market Y-o-Y Growth (%) Projections by Country, 2024 to 2034

Figure 153: East Asia Market Value (US$ Million) Analysis by Material Type, 2019 to 2034

Figure 154: East Asia Market Volume (Tons) Analysis by Material Type, 2019 to 2034

Figure 155: East Asia Market Value Share (%) and BPS Analysis by Material Type, 2024 to 2034

Figure 156: East Asia Market Y-o-Y Growth (%) Projections by Material Type, 2024 to 2034

Figure 157: East Asia Market Value (US$ Million) Analysis by Structure, 2019 to 2034

Figure 158: East Asia Market Volume (Tons) Analysis by Structure, 2019 to 2034

Figure 159: East Asia Market Value Share (%) and BPS Analysis by Structure, 2024 to 2034

Figure 160: East Asia Market Y-o-Y Growth (%) Projections by Structure, 2024 to 2034

Figure 161: East Asia Market Value (US$ Million) Analysis by Application, 2019 to 2034

Figure 162: East Asia Market Volume (Tons) Analysis by Application, 2019 to 2034

Figure 163: East Asia Market Value Share (%) and BPS Analysis by Application, 2024 to 2034

Figure 164: East Asia Market Y-o-Y Growth (%) Projections by Application, 2024 to 2034

Figure 165: East Asia Market Attractiveness by Material Type, 2024 to 2034

Figure 166: East Asia Market Attractiveness by Structure, 2024 to 2034

Figure 167: East Asia Market Attractiveness by Application, 2024 to 2034

Figure 168: East Asia Market Attractiveness by Country, 2024 to 2034

Figure 169: Middle East and Africa Market Value (US$ Million) by Material Type, 2024 to 2034

Figure 170: Middle East and Africa Market Value (US$ Million) by Structure, 2024 to 2034

Figure 171: Middle East and Africa Market Value (US$ Million) by Application, 2024 to 2034

Figure 172: Middle East and Africa Market Value (US$ Million) by Country, 2024 to 2034

Figure 173: Middle East and Africa Market Value (US$ Million) Analysis by Country, 2019 to 2034

Figure 174: Middle East and Africa Market Volume (Tons) Analysis by Country, 2019 to 2034

Figure 175: Middle East and Africa Market Value Share (%) and BPS Analysis by Country, 2024 to 2034

Figure 176: Middle East and Africa Market Y-o-Y Growth (%) Projections by Country, 2024 to 2034

Figure 177: Middle East and Africa Market Value (US$ Million) Analysis by Material Type, 2019 to 2034

Figure 178: Middle East and Africa Market Volume (Tons) Analysis by Material Type, 2019 to 2034

Figure 179: Middle East and Africa Market Value Share (%) and BPS Analysis by Material Type, 2024 to 2034

Figure 180: Middle East and Africa Market Y-o-Y Growth (%) Projections by Material Type, 2024 to 2034

Figure 181: Middle East and Africa Market Value (US$ Million) Analysis by Structure, 2019 to 2034

Figure 182: Middle East and Africa Market Volume (Tons) Analysis by Structure, 2019 to 2034

Figure 183: Middle East and Africa Market Value Share (%) and BPS Analysis by Structure, 2024 to 2034

Figure 184: Middle East and Africa Market Y-o-Y Growth (%) Projections by Structure, 2024 to 2034

Figure 185: Middle East and Africa Market Value (US$ Million) Analysis by Application, 2019 to 2034

Figure 186: Middle East and Africa Market Volume (Tons) Analysis by Application, 2019 to 2034

Figure 187: Middle East and Africa Market Value Share (%) and BPS Analysis by Application, 2024 to 2034

Figure 188: Middle East and Africa Market Y-o-Y Growth (%) Projections by Application, 2024 to 2034

Figure 189: Middle East and Africa Market Attractiveness by Material Type, 2024 to 2034

Figure 190: Middle East and Africa Market Attractiveness by Structure, 2024 to 2034

Figure 191: Middle East and Africa Market Attractiveness by Application, 2024 to 2034

Figure 192: Middle East and Africa Market Attractiveness by Country, 2024 to 2034

Recommendations

Packaging

Laminated Tubes Market

Published : March 2023

Packaging

Laminating Machines Market

Published : October 2022

Explore Packaging Insights

View Reports