Laminated Tubes Market Size, Share, and Forecast Outlook 2025 to 2035

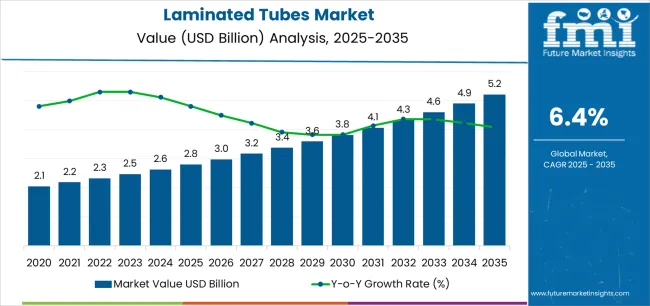
The laminated tubes market is set to expand from USD 3.5 billion in 2025 to USD 5.1 billion by 2035, reflecting a CAGR of 3.9%. Year-on-year (Y-o-Y) growth is expected to average between 3.6% and 4.2% over the forecast period. The market will grow to USD 3.63 billion in 2026 and USD 3.78 billion in 2027, driven by increased demand in oral care, pharmaceuticals, and cosmetics.

Quick Stats of Laminated Tubes Market

  • Laminated Tubes Market Size (2025): USD 3.5 billion
  • Projected Laminated Tubes Market Size (2035): USD 5.1 billion
  • Forecast CAGR of Laminated Tubes Market (2025 to 2035): 3.9
  • Leading Product Segment of Laminated Tubes Market (2025): Aluminum Barrier Laminated (ABL) Tubes - 60% share
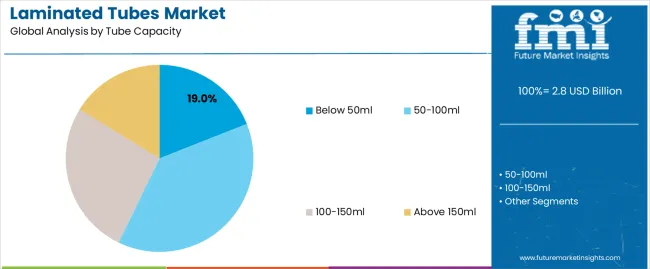
  • Dominant Capacity Segment (2025): 50-100 ml Tubes - 57% share
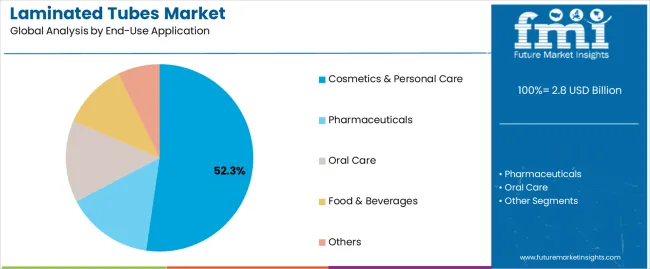
  • Top End-Use Segment (2025): Cosmetics - 42.8% volume share
  • Fastest-Growing Regional Markets: India (CAGR 4.5%), China (4.2%), USA (2.9%)
  • Top Key Players in Laminated Tubes Market: CCL Industries, Inc., Berry Global Group, Inc., Albéa S.A., Hoffman Neopac AG, HuhtamäkiOyj, EsselPropack Limited

Laminated Tubes Market

Metric Value
Industry Size (2025E) USD 3.5 billion
Industry Value (2035F) USD 5.1 billion
CAGR (2025 to 2035) 3.9%

Between 2028 and 2032, laminated tubes gain broader adoption in emerging markets and premium product packaging, with the market reaching USD 4.45 billion by 2032. From 2033 to 2035, rising regulatory pressure and consumer preference for green packaging drive growth in recyclable and mono-material formats. The market rises to USD 4.70 billion in 2033, USD 4.90 billion in 2034, and USD 5.1 billion in 2035. Product innovation and improved material recovery systems are key growth enablers in this period.

The market holds a relatively small but specialized share within its parent markets. While exact percentages vary by region and segment, laminated tubes account for less than 5% of the broader flexible packaging market, which itself is a subset of plastics, aluminum, and adhesives industries. In the global packaging industry (valued at USD 1.2 trillion), laminated tubes represent under 1%, as they are niche products primarily used for cosmetics, pharmaceuticals, and dental care.

The demand is growing at 5-7% CAGR due to ecofriendly trends (recyclable laminates) and premium packaging needs. The market’s reliance on plastics (60% of material cost) and aluminum (20%) means it is highly sensitive to raw material price fluctuations, keeping its overall share modest compared to larger packaging formats like bottles or pouches.

In 2024, HuhtamäkiOyj launched the blueloop™ Tube ONE, a high-barrier laminated tube designed without EVOH (ethylene vinyl alcohol), marking a significant advancement in green packaging. By eliminating EVOH, the tube improves recyclability while maintaining performance standards for product protection and shelf life.

The design also supports cost efficiency, addressing both environmental and economic considerations in packaging development. Innovation reflects the broader industry shift toward mono-material solutions and circular design principles. Recognized with the "Tube of the Year" award, the blueloop™ Tube ONE stands as a benchmark for next-generation laminated tubes. The announcement was made through the company’s official press release.

Analyzing Laminated Tubes Market by Top Investment Segments

Laminated tubes are projected to reach 25.4 billion units by 2025, driven by rising volumes in personal care and OTC pharmaceuticals. ABL tubes lead product share at 60%, while 50-100 ml capacities dominate at 57%. Flip-top caps and 16 mm neck diameters are the preferred standards across key industries.

ABL Tubes to Lead with 60% Share in 2025

Laminated Tubes Market Analysis By Product Type

Aluminum Barrier Laminated (ABL) tubes are expected to account for 60% of global product-type share in 2025 due to their barrier strength and chemical compatibility. ABL tubes remain the preferred choice for aggressive or oxygen-sensitive formulations.

  • EsselPropack supplies 9.4 billion ABL units annually to Colgate, Dabur, and Sanofi
  • Over 83% of all dermatology and medicated ointments in Europe use ABL tubes due to shelf life and migration resistance
  • Montebello Packaging expanded its ABL tube capacity by 17% in 2024, targeting oral care and topical Rx creams

50-100 ml Tubes to Dominate with 57% Volume Share

Laminated Tubes Market Analysis By Capacity

Tubes with 50–100 ml capacity will command 57% of laminated tube volume in 2025. The segment supports daily-use formats across skincare, OTC treatments, and herbal products for both retail and professional use.

  • 64% of laminated tube exports from India fall within this capacity range, led by skincare and pharma brands
  • Beiersdorf, L’Oréal, and Himalaya use 75 ml and 100 ml formats for over 70% of facial care and therapeutic SKUs
  • Flexible filling lines accommodate 50-100 ml tubes at speeds of up to 90 tubes per minute with <2% rejection

Flip Top Closures to Hold 38.9% Market Share

Flip top caps are projected to capture 38.9% of the laminated tube closure market in 2025. Brands favor this format for ease of use, controlled dispensing, and leak prevention across hygiene, skincare, and antiseptic segments.

  • Berry Global manufactures 6.4 billion flip tops annually, supplying Reckitt, Unilever, and Beiersdorf
  • Flip top tubes are used in 91% of facial cleansers in APAC, with over 50% growth since 2020 in baby care SKUs
  • Albéa’s hinge-integrated flip top caps cut leakage incidents by 28% compared to Fez Caps in intensive product testing

16 mm Neck Tubes to Capture 49% of Output

Tubes with a 16 mm neck diameter will make up 49% of total laminated tube production in 2025. This dimension supports high-speed production and universal cap compatibility for large-scale personal care and pharmaceutical use.

  • Colgate standardizes 16 mm necks for 93% of toothpaste SKUs in Southeast Asia and LATAM
  • High-speed fillers achieve 105-115 tubes/min with 16 mm setups, reducing line changeover time by 22%
  • Dabur, Marico, and GSK use this format for herbal pastes, gels, and dermatological actives across multiple markets

Cosmetics Segment to Account for 42.8% Tube Demand

Cosmetic applications will account for 42.8% of laminated tube consumption by volume in 2025. Skincare, haircare, and makeup products are driving high adoption, especially in premium and travel formats.

  • L’Oréal, Estée Lauder, and Unilever use over 3.4 billion laminated tubes per year across global personal care brands
  • 68% of new cosmetic product launches in 2023 utilized laminated tubes under 100 ml, often with decorative laminates
  • Foil-finished laminated tubes grew 26% from 2021 to 2024, mainly driven by demand in prestige skincare and BB creams

Top Laminated Tubes Market Dynamics

Global shipments of laminated tubes reached 8.7 billion units in H1 2025, up 6.4 % from the previous year. Oral care, dermaceuticals, and food packaging accounted for over 79 % of total volumes. Material shifts toward mono-resin formats and growing demand for print-ready surface coatings are reshaping converter operations and cost structures.

End-Use Distribution Drives Format Preferences

Toothpaste applications accounted for 42.1 % of global laminated tube demand in Q1-Q2 2025, followed by cosmetic creams (21.3%) and topical pharmaceuticals (15.8 %). In Europe, 59% of newly specified tubes for pharmacy channels used aluminum barrier laminate (ABL) for extended shelf-life stability.

In contrast, plastic barrier laminates (PBL) made up 66% of personal care formats in Latin America due to cost and branding flexibility. In India and Southeast Asia, single-dose tubes under 20 ml expanded by 12.8% YoY due to growing distribution via OTC outlets and sachet-to-tube upgrades. Tube sizes between 40 and 100 ml remain dominant across cosmetic categories, accounting for 71% of total beauty segment shipments in Q2.

Substrate Costs and Line Compatibility Define Design Choices

FOB pricing for aluminum foil inputs averaged GBP 2,965 per metric ton in May 2025, up 8.6% from February due to reduced export availability from Southeast Asia. EVOH resin pricing rose 6.9 % globally between March and June, pressuring converters in the EU and Turkey. As a result, mono-material plastic laminates made entirely of polyethylene now represent 13.6% of new launches in France, Italy, and the Netherlands.

Across 42 filling lines audited in Q2 2025, only 28% were fully compatible with PE-only laminate formats without nozzle and heat-sealing recalibration. Adhesive lamination is still used in 61% of high-volume contract manufacturing lines in North America, due to its processing reliability for mid-viscosity formulations. Recyclability claim compliance varies: only 32% of laminated tubes launched in Q2 met local recyclability labelling rules across five key EU markets.

Top Countries Producing, Supplying, and Utilizing Laminated Tubes in Cosmetic and Pharmaceutical Applications

Laminated Tubes Market Cagr Analysis By Country

Country CAGR (2025 to 2035)
India 4.5%
China 4.2%
USA 2.9%
Canada 2.5%
UK 1.9%

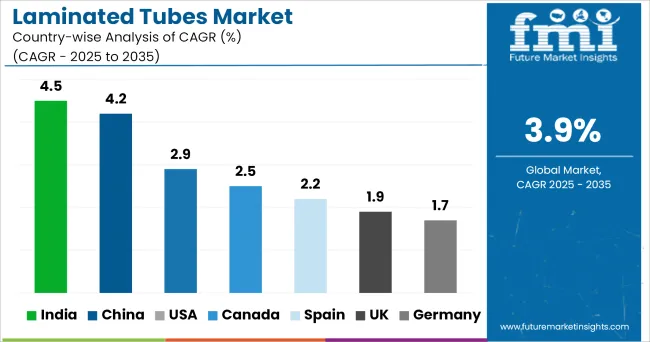
The industry is projected to grow globally at a CAGR of 3.9% between 2025 and 2035. India (BRICS) and China (BRICS) exceed this baseline, registering 4.5% (+0.6 % points) and 4.2% (+0.3) respectively. These growth rates reflect the expanding demand in oral care, topical medications, and beauty segments. In contrast, markets in the OECD cluster are trailing behind.

The United States posts 2.9% (-1.0), Canada follows at 2.5% (-1.4), and the United Kingdom lags further at 1.9% (-2.0). This divergence illustrates slower uptake of laminated formats in traditional packaging hubs, influenced by saturation in personal care applications and the dominance of legacy tube solutions.

The report covers detailed analysis of 40+ countries, with the top five countries shared as a reference.

Market Analysis of Laminated Tubes in the United States

The US laminated tubes market is forecast to grow at a CAGR of 2.9% from 2025 to 2035, falling below the global average of 3.9%. Growth is stabilizing after a 1.8% CAGR from 2020 to 2024, as mature segments like oral care and OTC topicals maintain steady demand.

Innovations are focused on enhancing barrier performance for pharma-grade tubes and aligning with new FDA container closure guidelines. Domestic production is tilting toward shorter production cycles with faster changeover capabilities to cater to niche product launches in DTC health and beauty.

  • Over 46% of all US laminated tubes were for oral care in 2024
  • DTC skincare brands increased laminated tube procurement by 22% year-over-year
  • Converters in North Carolina and Illinois scaled hybrid PBL-ABL production capacity by 17%

Demand Overview of Laminated Tubes Market in the United Kingdom

The UK market is projected to grow at 1.9% CAGR, significantly lower than the global average. This follows a modest 1.2% CAGR in the 2020–2024 period. Demand has remained stable but conservative due to saturation in personal care and oral hygiene formats.

There is incremental growth from recyclable PBL tubes in dermatological and nutraceutical categories. With Extended Producer Responsibility regulations tightening, local producers are investing in mono-material tube structures and barrier film downgauging to meet compliance without disrupting shelf performance.

  • By end-2024, 67% of UK brands used recyclable laminated tubes across oral care
  • Demand for herbal and natural toothpaste tubes rose by 8.1% annually from 2020
  • Tube makers introduced 25% PCR tubes to align with national plastic reduction mandates

Growth Forecast of Laminated Tubes in China

China is expected to grow at a 4.2% CAGR from 2025 to 2035, outperforming the global average. This follows a 3.1% CAGR during 2020–2024. Rapid expansion in the skincare, nutraceutical, and affordable healthcare sectors has driven volume growth.

Converters are heavily investing in fully integrated lamination and printing systems. Smart packaging requirements from e-commerce players and regional brands are driving demand for short-run digital customization. Zhejiang and Jiangsu provinces remain core production zones for barrier tube formats used in mid-tier oral and beauty brands.

  • China produced 9.5 billion laminated tubes in 2024, up 11.4% from 2022
  • Digital printing for tubes grew 37% between 2021 and 2024 due to online retail demand
  • Over 19 new high-speed laminators were installed in Eastern China between 2022 and 2024

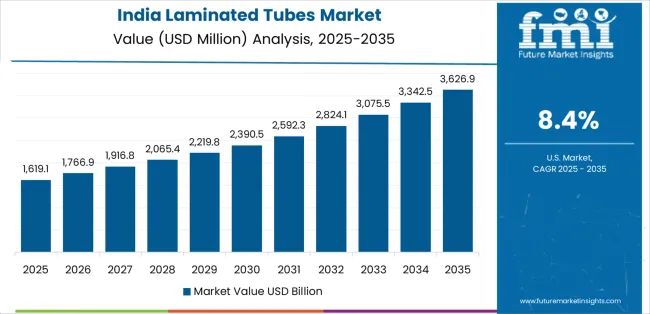
Market Outlook of Laminated Tubes in India

The industry in India is projected to grow at 4.5% CAGR, well above the global average. Growth accelerated from 3.2% in 2020 to 2024, led by strong demand across ayurvedic skincare, oral hygiene, and pharma Ointments.

The shift to flexible packaging in Tier 2 and 3 markets has increased localized tube production. Converters are upgrading to laminated formats that support tamper-proof seals and UV-resistant coatings. Supportive policy measures for biodegradable and recyclable material development are also shaping procurement decisions in pharma and FMCG sectors.

  • In 2024, 61% of toothpaste sold in urban India used laminated tubes
  • Customized tubes with regional branding grew 26% year-on-year in Tier 2 cities
  • INR 560 crore in new capacity investments announced by top 5 tube players in FY24

Development Overview of Laminated Tubes in Canada

Canada’s market is set to expand at 2.5% CAGR, underperforming compared to the global trend. Between 2020 and 2024, growth averaged 1.6%. Recent expansion is focused on recyclable tube variants in oral hygiene and wellness applications. Demand from indie brands has increased for compostable and mono-material tubes, although regulatory clarity is still evolving.

Urban consumers are also responding to clean-label beauty and eco-friendly packaging, spurring demand for matte-laminate and soft-touch finishes. The price sensitivity and small-scale production volumes continue to moderate growth momentum.

  • 43% of health and beauty tubes were recyclable laminated formats by 2024
  • Boutique cosmetic brands increased laminated tube adoption by 14% over two years
  • Compostable laminate demand rose 2.7x between 2021 and 2024, mainly in metro areas

Competitive Analysis

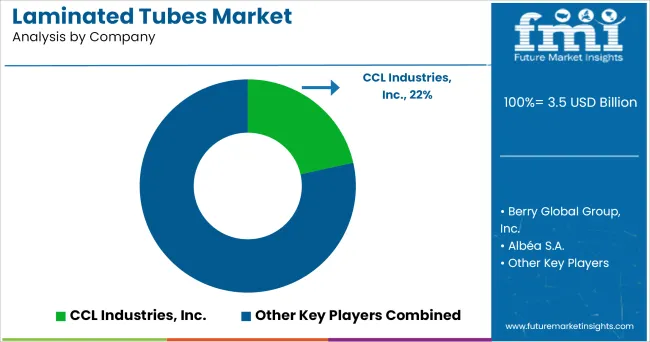
Laminated Tubes Market Analysis By Company

The industry is led by established players like CCL Industries, Berry Global, and Albéa S.A., who strengthen their positions through product innovation and strategic expansions. For example, Albéa introduced high-performance barrier tubes for premium cosmetics, while Berry Global developed cost-efficient, lightweight solutions for diverse applications. Emerging competitors, such as Tubapack A.S. and AntillaPropack, focus on niche segments like pharmaceuticals, offering customized solutions. Companies like EsselPropack and ALLTUB Group leverage vertical integration to optimize production and maintain quality.

Entry barriers include high capital costs for advanced machinery and strict regulatory standards, particularly in food and pharmaceutical packaging. Firms like Hoffman Neopac and Huhtamäki invest heavily in compliance, making it difficult for new entrants. Regional players, including Guangzhou Rego Packing, compete by offering affordable alternatives, while larger manufacturers prioritize R&D and partnerships to dominance.

Recent Industry News

  • In 2024, Amcor acquired Sonoco’s Flexible Packaging Division in a strategic move to expand its laminated tube production capabilities across North America and Europe.
  • In 2024, Huhtamaki launched a fully recyclable mono-material PP tube, eliminating aluminum layers while maintaining high barrier properties for cosmetics and pharmaceuticals.

Leading Players

  • CCL Industries, Inc.
  • Berry Global Group, Inc.
  • Albéa S.A.
  • Hoffman Neopac AG
  • HuhtamäkiOyj
  • EsselPropack Limited
  • ALLTUB Group
  • Montebello Packaging Inc.
  • LINHARDT GmbH & Co. KG.
  • CTL PACK
  • APackaging Group
  • Tubapack A.S.
  • AntillaPropack Inc.
  • Guangzhou Rego Packing Industry Co., Ltd.
  • San Ying Packaging (Jiangsu) Co., Ltd.

Report Scope

Report Attributes Details
Market Size (2025) USD 3.5 billion
Projected Market Size (2035) USD 5.1 billion
CAGR (2025 to 2035) 3.9%
Forecast Period 2025 to 2035
Quantitative Units USD billion (revenue)
Product Type Segmentation Plastic Barrier Laminated Tube (PBL), Ethylene Vinyl Alcohol (EVOH), Polyamide (PA), Polyester, Aluminum Barrier Laminated Tube (ABL)
Neck Diameter Segmentation 13.5 mm, 16 mm, Other customized sizes
Capacity Segmentation Less than 50 ml, 50 to 100 ml, 100 to 150 ml, Above 150 ml
Cap Type Segmentation Stand-up cap, Nozzle cap, Fez cap, Flip top cap, Others
End Use Segmentation Cosmetics (Haircare, Skincare, Body Care, Make-up, Baby Care, Hand Care), Commercial (Sealants & adhesives, Lubricants, Others), Pharmaceuticals (Ointments, Creams), Oral Care, Home & Personal Care, Food, Others (Paints, Crayons, Shoe polish)
Regional Coverage North America, Latin America, East Asia, South Asia & Pacific, Western Europe, Eastern Europe, Middle East & Africa
Country Covered United States, Canada, Germany, United Kingdom, France, Italy, Japan, China, India, Brazil, ASEAN, GCC countries
Leading Companies Profiled CCL Industries, Inc., Berry Global Group, Inc., Albéa S.A., Hoffman Neopac AG, Huhtamäki Oyj , Essel Propack Limited, ALLTUB Group, Montebello Packaging Inc., LINHARDT GmbH & Co. KG., CTL PACK, APackaging Group, Tubapack A.S., Antilla Propack Inc., Guangzhou Rego Packing, San Ying Packaging
Additional Attributes Dollar sales, segmentation by laminate barrier type and capacity, rising demand in cosmetics and pharmaceutical creams, customized packaging for baby care and hand hygiene, increasing use of stand-up and flip top caps, market expansion in Asia-Pacific and Middle East regions

Key Segments

By Product Type:

  • Plastic Barrier Laminated Tube (PBL)
  • Ethylene Vinyl Alcohol (EVOH)
  • Polyamide (PA)
  • Polyester
  • Aluminum Barrier Laminated Tube (ABL)

By Neck Diameter:

  • 13.5 mm
  • 16 mm
  • Other customized sizes

By Capacity:

  • Less than 50 ml
  • 50 to 100 ml
  • 100 to 150 ml
  • Above 150 ml

By Cap Type:

  • Stand-up cap
  • Nozzle cap
  • Fez cap
  • Flip top cap
  • Others

By End Use:

  • Haircare
  • Shampoo
  • Conditioner
  • Hair oil
  • Hair gels
  • Hair color
  • Other hair styling products

By Region:

  • North America
  • Latin America
  • East Asia
  • South Asia & Pacific
  • Western Europe
  • Eastern Europe
  • Middle East & Africa

Table of Content

  1. Executive Summary
    • Global Market Outlook
    • Demand-side Trends
    • Supply-side Trends
    • Technology Roadmap Analysis
    • Analysis and Recommendations
  2. Market Overview
    • Market Coverage/Taxonomy
    • Market Definition/Scope/Limitations
  3. Market Background
    • Market Dynamics
      • Drivers
      • Restraints
      • Opportunity
      • Trends
    • Scenario Forecast
      • Demand in Optimistic Scenario
      • Demand in Likely Scenario
      • Demand in Conservative Scenario
    • Opportunity Map Analysis
    • Product Life Cycle Analysis
    • Supply Chain Analysis
      • Supply Side Participants and their Roles
        • Producers
        • Mid-Level Participants (Traders/ Agents/ Brokers)
        • Wholesalers and Distributors
      • Value Added and Value Created at Node in the Supply Chain
      • List of Raw Material Suppliers
      • List of Existing and Potential Buyer’s
    • Investment Feasibility Matrix
    • Value Chain Analysis
      • Profit Margin Analysis
      • Wholesalers and Distributors
      • Retailers
    • PESTLE and Porter’s Analysis
    • Regulatory Landscape
      • By Key Regions
      • By Key Countries
    • Regional Parent Market Outlook
    • Production and Consumption Statistics
    • Import and Export Statistics
  4. Global Market Analysis 2020 to 2024 and Forecast, 2025 to 2035
    • Historical Market Size Value (USD Billion) & Volume (Mn Units) Analysis, 2020 to 2024
    • Current and Future Market Size Value (USD Billion) & Volume (Mn Units) Projections, 2025 to 2035
      • Y-o-Y Growth Trend Analysis
      • Absolute $ Opportunity Analysis
  5. Global Market Pricing Analysis 2020 to 2024 and Forecast 2025 to 2035
  6. Global Market Analysis 2020 to 2024 and Forecast 2025 to 2035, By Product Type
    • Introduction/Key Findings
    • Historical Market Size Value (USD Billion) & Volume (Mn Units) Analysis By Product Type, 2020 to 2024
    • Current and Future Market Size Value (USD Billion) & Volume (Mn Units) Analysis and Forecast By Product Type, 2025 to 2035
      • Plastic Barrier Laminated Tube (PBL)
        • Ethylene Vinyl Alcohol (EVOH)
        • Polyamide (PA)
        • Polyester (PET)
      • Aluminum Barrier Laminated Tube (ABL)
    • Y-o-Y Growth Trend Analysis By Product Type, 2020 to 2024
    • Absolute $ Opportunity Analysis By Product Type, 2025 to 2035
  7. Global Market Analysis 2020 to 2024 and Forecast 2025 to 2035, By Neck Diameter
    • Introduction/Key Findings
    • Historical Market Size Value (USD Billion) & Volume (Mn Units) Analysis By Neck Diameter, 2020 to 2024
    • Current and Future Market Size Value (USD Billion) & Volume (Mn Units) Analysis and Forecast By Neck Diameter, 2025 to 2035
      • 13.5 mm
      • 16 mm
      • Other customized sizes
    • Y-o-Y Growth Trend Analysis By Neck Diameter, 2020 to 2024
    • Absolute $ Opportunity Analysis By Neck Diameter, 2025 to 2035
  8. Global Market Analysis 2020 to 2024 and Forecast 2025 to 2035, By Capacity
    • Introduction/Key Findings
    • Historical Market Size Value (USD Billion) & Volume (Mn Units) Analysis By Capacity, 2020 to 2024
    • Current and Future Market Size Value (USD Billion) & Volume (Mn Units) Analysis and Forecast By Capacity, 2025 to 2035
      • Less than 50 ml
      • 50 to 100 ml
      • 100 to 150 ml
      • Above 150 ml
    • Y-o-Y Growth Trend Analysis By Capacity, 2020 to 2024
    • Absolute $ Opportunity Analysis By Capacity, 2025 to 2035
  9. Global Market Analysis 2020 to 2024 and Forecast 2025 to 2035, By Cap Type
    • Introduction/Key Findings
    • Historical Market Size Value (USD Billion) & Volume (Mn Units) Analysis By Cap Type, 2020 to 2024
    • Current and Future Market Size Value (USD Billion) & Volume (Mn Units) Analysis and Forecast By Cap Type, 2025 to 2035
      • Stand-up cap
      • Nozzle cap
      • Fez cap
      • Flip-top cap
      • Others
    • Y-o-Y Growth Trend Analysis By Cap Type, 2020 to 2024
    • Absolute $ Opportunity Analysis By Cap Type, 2025 to 2035
  10. Global Market Analysis 2020 to 2024 and Forecast 2025 to 2035, By End Use
    • Introduction/Key Findings
    • Historical Market Size Value (USD Billion) & Volume (Mn Units) Analysis By End Use, 2020 to 2024
    • Current and Future Market Size Value (USD Billion) & Volume (Mn Units) Analysis and Forecast By End Use, 2025 to 2035
      • Cosmetics
        • Haircare
        • Skincare/Facial Care
        • Body Care
        • Make-up
        • Hand Care
      • Commercial
        • Sealants & adhesives
        • Lubricants
        • Others (e.g., specialty grease, pesticides)
      • Pharmaceuticals
        • Ointments
        • Creams
      • Oral Care
        • Toothpaste
        • Tooth gels
        • Whitening creams
        • Others
      • Home & Other Personal Care
        • Laundry gel
        • Toiletries
        • Hand wash gels
        • Others
      • Food
        • Condiments
        • Sauces
        • Purees
        • Others
      • Others
        • Paints
        • Crayons
        • Shoe polish
        • Other niche applications
    • Y-o-Y Growth Trend Analysis By End Use, 2020 to 2024
    • Absolute $ Opportunity Analysis By End Use, 2025 to 2035
  11. Global Market Analysis 2020 to 2024 and Forecast 2025 to 2035, By Region
    • Introduction
    • Historical Market Size Value (USD Billion) & Volume (Mn Units) Analysis By Region, 2020 to 2024
    • Current Market Size Value (USD Billion) & Volume (Mn Units) Analysis and Forecast By Region, 2025 to 2035
      • North America
      • Latin America
      • Western Europe
      • Eastern Europe
      • East Asia
      • South Asia & Pacific
      • Middle East and Africa
    • Market Attractiveness Analysis By Region
  12. North America Market Analysis 2020 to 2024 and Forecast 2025 to 2035, By Country
    • Historical Market Size Value (USD Billion) & Volume (Mn Units) Trend Analysis By Market Taxonomy, 2020 to 2024
    • Market Size Value (USD Billion) & Volume (Mn Units) Forecast By Market Taxonomy, 2025 to 2035
      • By Country
        • USA
        • Canada
        • Mexico
      • By Product Type
      • By Neck Diameter
      • By Capacity
      • By Cap Type
      • By End Use
    • Market Attractiveness Analysis
      • By Country
      • By Product Type
      • By Neck Diameter
      • By Capacity
      • By Cap Type
      • By End Use
    • Key Takeaways
  13. Latin America Market Analysis 2020 to 2024 and Forecast 2025 to 2035, By Country
    • Historical Market Size Value (USD Billion) & Volume (Mn Units) Trend Analysis By Market Taxonomy, 2020 to 2024
    • Market Size Value (USD Billion) & Volume (Mn Units) Forecast By Market Taxonomy, 2025 to 2035
      • By Country
        • Brazil
        • Argentina
        • Rest of LATAM
      • By Product Type
      • By Neck Diameter
      • By Capacity
      • By Cap Type
      • By End Use
    • Market Attractiveness Analysis
      • By Country
      • By Product Type
      • By Neck Diameter
      • By Capacity
      • By Cap Type
      • By End Use
    • Key Takeaways
  14. Western Europe Market Analysis 2020 to 2024 and Forecast 2025 to 2035, By Country
    • Historical Market Size Value (USD Billion) & Volume (Mn Units) Trend Analysis By Market Taxonomy, 2020 to 2024
    • Market Size Value (USD Billion) & Volume (Mn Units) Forecast By Market Taxonomy, 2025 to 2035
      • By Country
        • Germany
        • Italy
        • France
        • UK
        • Spain
        • BENELUX
        • Nordic
        • Rest of W.Europe
      • By Product Type
      • By Neck Diameter
      • By Capacity
      • By Cap Type
      • By End Use
    • Market Attractiveness Analysis
      • By Country
      • By Product Type
      • By Neck Diameter
      • By Capacity
      • By Cap Type
      • By End Use
    • Key Takeaways
  15. Eastern Europe Market Analysis 2020 to 2024 and Forecast 2025 to 2035, By Country
    • Historical Market Size Value (USD Billion) & Volume (Mn Units) Trend Analysis By Market Taxonomy, 2020 to 2024
    • Market Size Value (USD Billion) & Volume (Mn Units) Forecast By Market Taxonomy, 2025 to 2035
      • By Country
        • Russia
        • Hungary
        • Poland
        • Balkan & Baltics
        • Rest of E. Europe
      • By Product Type
      • By Neck Diameter
      • By Capacity
      • By Cap Type
      • By End Use
    • Market Attractiveness Analysis
      • By Country
      • By Product Type
      • By Neck Diameter
      • By Capacity
      • By Cap Type
      • By End Use
    • Key Takeaways
  16. East Asia Market Analysis 2020 to 2024 and Forecast 2025 to 2035, By Country
    • Historical Market Size Value (USD Billion) & Volume (Mn Units) Trend Analysis By Market Taxonomy, 2020 to 2024
    • Market Size Value (USD Billion) & Volume (Mn Units) Forecast By Market Taxonomy, 2025 to 2035
      • By Country
        • China
        • Japan
        • South Korea
      • By Product Type
      • By Neck Diameter
      • By Capacity
      • By Cap Type
      • By End Use
    • Market Attractiveness Analysis
      • By Country
      • By Product Type
      • By Neck Diameter
      • By Capacity
      • By Cap Type
      • By End Use
    • Key Takeaways
  17. South Asia & Pacific Market Analysis 2020 to 2024 and Forecast 2025 to 2035, By Country
    • Historical Market Size Value (USD Billion) & Volume (Mn Units) Trend Analysis By Market Taxonomy, 2020 to 2024
    • Market Size Value (USD Billion) & Volume (Mn Units) Forecast By Market Taxonomy, 2025 to 2035
      • By Country
        • India
        • Australia & New Zealand
        • ASEAN
        • Rest of SAP
      • By Product Type
      • By Neck Diameter
      • By Capacity
      • By Cap Type
      • By End Use
    • Market Attractiveness Analysis
      • By Country
      • By Product Type
      • By Neck Diameter
      • By Capacity
      • By Cap Type
      • By End Use
    • Key Takeaways
  18. Middle East and Africa Market Analysis 2020 to 2024 and Forecast 2025 to 2035, By Country
    • Historical Market Size Value (USD Billion) & Volume (Mn Units) Trend Analysis By Market Taxonomy, 2020 to 2024
    • Market Size Value (USD Billion) & Volume (Mn Units) Forecast By Market Taxonomy, 2025 to 2035
      • By Country
        • GCC Countries
        • Northern Africa
        • South Africa
        • Turkiye
        • Rest of MEA
      • By Product Type
      • By Neck Diameter
      • By Capacity
      • By Cap Type
      • By End Use
    • Market Attractiveness Analysis
      • By Country
      • By Product Type
      • By Neck Diameter
      • By Capacity
      • By Cap Type
      • By End Use
    • Key Takeaways
  19. Key Countries Market Analysis
    • USA
      • Pricing Analysis
      • Market Share Analysis, 2024
        • By Product Type
        • By Neck Diameter
        • By Capacity
        • By Cap Type
        • By End Use
    • Canada
      • Pricing Analysis
      • Market Share Analysis, 2024
        • By Product Type
        • By Neck Diameter
        • By Capacity
        • By Cap Type
        • By End Use
    • Brazil
      • Pricing Analysis
      • Market Share Analysis, 2024
        • By Product Type
        • By Neck Diameter
        • By Capacity
        • By Cap Type
        • By End Use
    • Mexico
      • Pricing Analysis
      • Market Share Analysis, 2024
        • By Product Type
        • By Neck Diameter
        • By Capacity
        • By Cap Type
        • By End Use
    • Argentina
      • Pricing Analysis
      • Market Share Analysis, 2024
        • By Product Type
        • By Neck Diameter
        • By Capacity
        • By Cap Type
        • By End Use
  20. Market Structure Analysis
    • Competition Dashboard
    • Competition Benchmarking
    • Market Share Analysis of Top Players
      • By Regional
      • By Product Type
      • By Neck Diameter
      • By Capacity
      • By Cap Type
      • By End Use
  21. Competition Analysis
    • Competition Deep Dive
      • CCL Industries, Inc.
        • Overview
        • Product Portfolio
        • Profitability by Market Segments (Product/Age /Sales Channel/Region)
        • Sales Footprint
        • Strategy Overview
          • Marketing Strategy
          • Product Strategy
          • Channel Strategy
      • Berry Global Group, Inc.
        • Overview
        • Product Portfolio
        • Profitability by Market Segments (Product/Age /Sales Channel/Region)
        • Sales Footprint
        • Strategy Overview
          • Marketing Strategy
          • Product Strategy
          • Channel Strategy
      • Albéa S.A.
        • Overview
        • Product Portfolio
        • Profitability by Market Segments (Product/Age /Sales Channel/Region)
        • Sales Footprint
        • Strategy Overview
          • Marketing Strategy
          • Product Strategy
          • Channel Strategy
      • Hoffman Neopac AG
        • Overview
        • Product Portfolio
        • Profitability by Market Segments (Product/Age /Sales Channel/Region)
        • Sales Footprint
        • Strategy Overview
          • Marketing Strategy
          • Product Strategy
          • Channel Strategy
      • Huhtamäki Oyj
        • Overview
        • Product Portfolio
        • Profitability by Market Segments (Product/Age /Sales Channel/Region)
        • Sales Footprint
        • Strategy Overview
          • Marketing Strategy
          • Product Strategy
          • Channel Strategy
      • Essel Propack Limited
        • Overview
        • Product Portfolio
        • Profitability by Market Segments (Product/Age /Sales Channel/Region)
        • Sales Footprint
        • Strategy Overview
          • Marketing Strategy
          • Product Strategy
          • Channel Strategy
      • ALLTUB Group
        • Overview
        • Product Portfolio
        • Profitability by Market Segments (Product/Age /Sales Channel/Region)
        • Sales Footprint
        • Strategy Overview
          • Marketing Strategy
          • Product Strategy
          • Channel Strategy
      • Montebello Packaging Inc.
        • Overview
        • Product Portfolio
        • Profitability by Market Segments (Product/Age /Sales Channel/Region)
        • Sales Footprint
        • Strategy Overview
          • Marketing Strategy
          • Product Strategy
          • Channel Strategy
      • LINHARDT GmbH & Co. KG.
        • Overview
        • Product Portfolio
        • Profitability by Market Segments (Product/Age /Sales Channel/Region)
        • Sales Footprint
        • Strategy Overview
          • Marketing Strategy
          • Product Strategy
          • Channel Strategy
      • CTL PACK
        • Overview
        • Product Portfolio
        • Profitability by Market Segments (Product/Age /Sales Channel/Region)
        • Sales Footprint
        • Strategy Overview
          • Marketing Strategy
          • Product Strategy
          • Channel Strategy
      • APackaging Group
        • Overview
        • Product Portfolio
        • Profitability by Market Segments (Product/Age /Sales Channel/Region)
        • Sales Footprint
        • Strategy Overview
          • Marketing Strategy
          • Product Strategy
          • Channel Strategy
      • Tubapack A.S.
        • Overview
        • Product Portfolio
        • Profitability by Market Segments (Product/Age /Sales Channel/Region)
        • Sales Footprint
        • Strategy Overview
          • Marketing Strategy
          • Product Strategy
          • Channel Strategy
      • Antilla Propack Inc.
        • Overview
        • Product Portfolio
        • Profitability by Market Segments (Product/Age /Sales Channel/Region)
        • Sales Footprint
        • Strategy Overview
          • Marketing Strategy
          • Product Strategy
          • Channel Strategy
      • Guangzhou Rego Packing Industry Co., Ltd.
        • Overview
        • Product Portfolio
        • Profitability by Market Segments (Product/Age /Sales Channel/Region)
        • Sales Footprint
        • Strategy Overview
          • Marketing Strategy
          • Product Strategy
          • Channel Strategy
      • San Ying Packaging (Jiangsu) Co., Ltd.
        • Overview
        • Product Portfolio
        • Profitability by Market Segments (Product/Age /Sales Channel/Region)
        • Sales Footprint
        • Strategy Overview
          • Marketing Strategy
          • Product Strategy
          • Channel Strategy
  22. Assumptions & Acronyms Used
  23. Research Methodology

List of Tables

  • Table 1: Global Value (USD Billion) Forecast by Region, 2020-2035
  • Table 2: Global Volume (Mn Units) Forecast by Region, 2020-2035
  • Table 3: Global Value (USD Billion) Forecast by Product Type, 2020-2035
  • Table 4: Global Volume (Mn Units) Forecast by Product Type, 2020-2035
  • Table 5: Global Value (USD Billion) Forecast by Neck Diameter, 2020-2035
  • Table 6: Global Volume (Mn Units) Forecast by Neck Diameter, 2020-2035
  • Table 7: Global Value (USD Billion) Forecast by Capacity, 2020-2035
  • Table 8: Global Volume (Mn Units) Forecast by Capacity, 2020-2035
  • Table 9: Global Value (USD Billion) Forecast by Cap Type, 2020-2035
  • Table 10: Global Volume (Mn Units) Forecast by Cap Type, 2020-2035
  • Table 11: Global Value (USD Billion) Forecast by End Use, 2020-2035
  • Table 12: Global Volume (Mn Units) Forecast by End Use, 2020-2035
  • Table 13: North America Value (USD Billion) Forecast by Country, 2020-2035
  • Table 14: North America Volume (Mn Units) Forecast by Country, 2020-2035
  • Table 15: North America Value (USD Billion) Forecast by Product Type, 2020-2035
  • Table 16: North America Volume (Mn Units) Forecast by Product Type, 2020-2035
  • Table 17: North America Value (USD Billion) Forecast by Neck Diameter, 2020-2035
  • Table 18: North America Volume (Mn Units) Forecast by Neck Diameter, 2020-2035
  • Table 19: North America Value (USD Billion) Forecast by Capacity, 2020-2035
  • Table 20: North America Volume (Mn Units) Forecast by Capacity, 2020-2035
  • Table 21: North America Value (USD Billion) Forecast by Cap Type, 2020-2035
  • Table 22: North America Volume (Mn Units) Forecast by Cap Type, 2020-2035
  • Table 23: North America Value (USD Billion) Forecast by End Use, 2020-2035
  • Table 24: North America Volume (Mn Units) Forecast by End Use, 2020-2035
  • Table 25: Latin America Value (USD Billion) Forecast by Country, 2020-2035
  • Table 26: Latin America Volume (Mn Units) Forecast by Country, 2020-2035
  • Table 27: Latin America Value (USD Billion) Forecast by Product Type, 2020-2035
  • Table 28: Latin America Volume (Mn Units) Forecast by Product Type, 2020-2035
  • Table 29: Latin America Value (USD Billion) Forecast by Neck Diameter, 2020-2035
  • Table 30: Latin America Volume (Mn Units) Forecast by Neck Diameter, 2020-2035
  • Table 31: Latin America Value (USD Billion) Forecast by Capacity, 2020-2035
  • Table 32: Latin America Volume (Mn Units) Forecast by Capacity, 2020-2035
  • Table 33: Latin America Value (USD Billion) Forecast by Cap Type, 2020-2035
  • Table 34: Latin America Volume (Mn Units) Forecast by Cap Type, 2020-2035
  • Table 35: Latin America Value (USD Billion) Forecast by End Use, 2020-2035
  • Table 36: Latin America Volume (Mn Units) Forecast by End Use, 2020-2035
  • Table 37: Western Europe Value (USD Billion) Forecast by Country, 2020-2035
  • Table 38: Western Europe Volume (Mn Units) Forecast by Country, 2020-2035
  • Table 39: Western Europe Value (USD Billion) Forecast by Product Type, 2020-2035
  • Table 40: Western Europe Volume (Mn Units) Forecast by Product Type, 2020-2035
  • Table 41: Western Europe Value (USD Billion) Forecast by Neck Diameter, 2020-2035
  • Table 42: Western Europe Volume (Mn Units) Forecast by Neck Diameter, 2020-2035
  • Table 43: Western Europe Value (USD Billion) Forecast by Capacity, 2020-2035
  • Table 44: Western Europe Volume (Mn Units) Forecast by Capacity, 2020-2035
  • Table 45: Western Europe Value (USD Billion) Forecast by Cap Type, 2020-2035
  • Table 46: Western Europe Volume (Mn Units) Forecast by Cap Type, 2020-2035
  • Table 47: Western Europe Value (USD Billion) Forecast by End Use, 2020-2035
  • Table 48: Western Europe Volume (Mn Units) Forecast by End Use, 2020-2035
  • Table 49: Eastern Europe Value (USD Billion) Forecast by Country, 2020-2035
  • Table 50: Eastern Europe Volume (Mn Units) Forecast by Country, 2020-2035
  • Table 51: Eastern Europe Value (USD Billion) Forecast by Product Type, 2020-2035
  • Table 52: Eastern Europe Volume (Mn Units) Forecast by Product Type, 2020-2035
  • Table 53: Eastern Europe Value (USD Billion) Forecast by Neck Diameter, 2020-2035
  • Table 54: Eastern Europe Volume (Mn Units) Forecast by Neck Diameter, 2020-2035
  • Table 55: Eastern Europe Value (USD Billion) Forecast by Capacity, 2020-2035
  • Table 56: Eastern Europe Volume (Mn Units) Forecast by Capacity, 2020-2035
  • Table 57: Eastern Europe Value (USD Billion) Forecast by Cap Type, 2020-2035
  • Table 58: Eastern Europe Volume (Mn Units) Forecast by Cap Type, 2020-2035
  • Table 59: Eastern Europe Value (USD Billion) Forecast by End Use, 2020-2035
  • Table 60: Eastern Europe Volume (Mn Units) Forecast by End Use, 2020-2035
  • Table 61: East Asia Value (USD Billion) Forecast by Country, 2020-2035
  • Table 62: East Asia Volume (Mn Units) Forecast by Country, 2020-2035
  • Table 63: East Asia Value (USD Billion) Forecast by Product Type, 2020-2035
  • Table 64: East Asia Volume (Mn Units) Forecast by Product Type, 2020-2035
  • Table 65: East Asia Value (USD Billion) Forecast by Neck Diameter, 2020-2035
  • Table 66: East Asia Volume (Mn Units) Forecast by Neck Diameter, 2020-2035
  • Table 67: East Asia Value (USD Billion) Forecast by Capacity, 2020-2035
  • Table 68: East Asia Volume (Mn Units) Forecast by Capacity, 2020-2035
  • Table 69: East Asia Value (USD Billion) Forecast by Cap Type, 2020-2035
  • Table 70: East Asia Volume (Mn Units) Forecast by Cap Type, 2020-2035
  • Table 71: East Asia Value (USD Billion) Forecast by End Use, 2020-2035
  • Table 72: East Asia Volume (Mn Units) Forecast by End Use, 2020-2035
  • Table 73: South Asia & Pacific Value (USD Billion) Forecast by Country, 2020-2035
  • Table 74: South Asia & Pacific Volume (Mn Units) Forecast by Country, 2020-2035
  • Table 75: South Asia & Pacific Value (USD Billion) Forecast by Product Type, 2020-2035
  • Table 76: South Asia & Pacific Volume (Mn Units) Forecast by Product Type, 2020-2035
  • Table 77: South Asia & Pacific Value (USD Billion) Forecast by Neck Diameter, 2020-2035
  • Table 78: South Asia & Pacific Volume (Mn Units) Forecast by Neck Diameter, 2020-2035
  • Table 79: South Asia & Pacific Value (USD Billion) Forecast by Capacity, 2020-2035
  • Table 80: South Asia & Pacific Volume (Mn Units) Forecast by Capacity, 2020-2035
  • Table 81: South Asia & Pacific Value (USD Billion) Forecast by Cap Type, 2020-2035
  • Table 82: South Asia & Pacific Volume (Mn Units) Forecast by Cap Type, 2020-2035
  • Table 83: South Asia & Pacific Value (USD Billion) Forecast by End Use, 2020-2035
  • Table 84: South Asia & Pacific Volume (Mn Units) Forecast by End Use, 2020-2035
  • Table 85: Middle East and Africa Value (USD Billion) Forecast by Country, 2020-2035
  • Table 86: Middle East and Africa Volume (Mn Units) Forecast by Country, 2020-2035
  • Table 87: Middle East and Africa Value (USD Billion) Forecast by Product Type, 2020-2035
  • Table 88: Middle East and Africa Volume (Mn Units) Forecast by Product Type, 2020-2035
  • Table 89: Middle East and Africa Value (USD Billion) Forecast by Neck Diameter, 2020-2035
  • Table 90: Middle East and Africa Volume (Mn Units) Forecast by Neck Diameter, 2020-2035
  • Table 91: Middle East and Africa Value (USD Billion) Forecast by Capacity, 2020-2035
  • Table 92: Middle East and Africa Volume (Mn Units) Forecast by Capacity, 2020-2035
  • Table 93: Middle East and Africa Value (USD Billion) Forecast by Cap Type, 2020-2035
  • Table 94: Middle East and Africa Volume (Mn Units) Forecast by Cap Type, 2020-2035
  • Table 95: Middle East and Africa Value (USD Billion) Forecast by End Use, 2020-2035
  • Table 96: Middle East and Africa Volume (Mn Units) Forecast by End Use, 2020-2035
  •  

List of Figures

  • Figure 1: Global Volume (Mn Units) Forecast 2020-2035
  • Figure 2: Global Pricing Analysis
  • Figure 3: Global Value (USD Billion) Forecast 2020-2035
  • Figure 4: Global Value Share and BPS Analysis by Product Type, 2025 and 2035
  • Figure 5: Global Y-o-Y Growth Comparison by Product Type, 2025-2035
  • Figure 6: Global Attractiveness Analysis by Product Type
  • Figure 7: Global Value Share and BPS Analysis by Neck Diameter, 2025 and 2035
  • Figure 8: Global Y-o-Y Growth Comparison by Neck Diameter, 2025-2035
  • Figure 9: Global Attractiveness Analysis by Neck Diameter
  • Figure 10: Global Value Share and BPS Analysis by Capacity, 2025 and 2035
  • Figure 11: Global Y-o-Y Growth Comparison by Capacity, 2025-2035
  • Figure 12: Global Attractiveness Analysis by Capacity
  • Figure 13: Global Value Share and BPS Analysis by Cap Type, 2025 and 2035
  • Figure 14: Global Y-o-Y Growth Comparison by Cap Type, 2025-2035
  • Figure 15: Global Attractiveness Analysis by Cap Type
  • Figure 16: Global Value Share and BPS Analysis by End Use, 2025 and 2035
  • Figure 17: Global Y-o-Y Growth Comparison by End Use, 2025-2035
  • Figure 18: Global Attractiveness Analysis by End Use
  • Figure 19: Global Value (USD Billion) Share and BPS Analysis by Region, 2025 and 2035
  • Figure 20: Global Y-o-Y Growth Comparison by Region, 2025-2035
  • Figure 21: Global Attractiveness Analysis by Region
  • Figure 22: North America Incremental $ Opportunity, 2025-2035
  • Figure 23: Latin America Incremental $ Opportunity, 2025-2035
  • Figure 24: Western Europe Incremental $ Opportunity, 2025-2035
  • Figure 25: Eastern Europe Incremental $ Opportunity, 2025-2035
  • Figure 26: East Asia Incremental $ Opportunity, 2025-2035
  • Figure 27: South Asia & Pacific Incremental $ Opportunity, 2025-2035
  • Figure 28: Middle East and Africa Incremental $ Opportunity, 2025-2035
  • Figure 29: North America Laminated Tubes Market  Value Share and BPS Analysis by Country, 2025 and 2035
  • Figure 30: North America Value Share and BPS Analysis by Product Type, 2025 and 2035
  • Figure 31: North America Y-o-Y Growth Comparison by Product Type, 2025-2035
  • Figure 32: North America Attractiveness Analysis by Product Type
  • Figure 33: North America Value Share and BPS Analysis by Neck Diameter, 2025 and 2035
  • Figure 34: North America Laminated Tubes Market  Y-o-Y Growth Comparison by Neck Diameter, 2025-2035
  • Figure 35: North America Attractiveness Analysis by Neck Diameter
  • Figure 36: North America Value Share and BPS Analysis by Capacity, 2025 and 2035
  • Figure 37: North America Y-o-Y Growth Comparison by Capacity, 2025-2035
  • Figure 38: North America Attractiveness Analysis by Capacity
  • Figure 39: North America Value Share and BPS Analysis by Cap Type, 2025 and 2035
  • Figure 40: North America Y-o-Y Growth Comparison by Cap Type, 2025-2035
  • Figure 41: North America Attractiveness Analysis by Cap Type
  • Figure 42: North America Value Share and BPS Analysis by End Use, 2025 and 2035
  • Figure 43: North America Y-o-Y Growth Comparison by End Use, 2025-2035
  • Figure 44: North America Attractiveness Analysis by End Use
  • Figure 45: Latin America Value Share and BPS Analysis by Country, 2025 and 2035
  • Figure 46: Latin America Value Share and BPS Analysis by Product Type, 2025 and 2035
  • Figure 47: Latin America Y-o-Y Growth Comparison by Product Type, 2025-2035
  • Figure 48: Latin America Attractiveness Analysis by Product Type
  • Figure 49: Latin America Value Share and BPS Analysis by Neck Diameter, 2025 and 2035
  • Figure 50: Latin America Y-o-Y Growth Comparison by Neck Diameter, 2025-2035
  • Figure 51: Latin America Attractiveness Analysis by Neck Diameter
  • Figure 52: Latin America Value Share and BPS Analysis by Capacity, 2025 and 2035
  • Figure 53: Latin America Y-o-Y Growth Comparison by Capacity, 2025-2035
  • Figure 54: Latin America Attractiveness Analysis by Capacity
  • Figure 55: Latin America Value Share and BPS Analysis by Cap Type, 2025 and 2035
  • Figure 56: Latin America Y-o-Y Growth Comparison by Cap Type, 2025-2035
  • Figure 57: Latin America Attractiveness Analysis by Cap Type
  • Figure 58: Latin America Value Share and BPS Analysis by End Use, 2025 and 2035
  • Figure 59: Latin America Y-o-Y Growth Comparison by End Use, 2025-2035
  • Figure 60: Latin America Attractiveness Analysis by End Use
  • Figure 61: Western Europe Value Share and BPS Analysis by Country, 2025 and 2035
  • Figure 62: Western Europe Value Share and BPS Analysis by Product Type, 2025 and 2035
  • Figure 63: Western Europe Y-o-Y Growth Comparison by Product Type, 2025-2035
  • Figure 64: Western Europe Attractiveness Analysis by Product Type
  • Figure 65: Western Europe Value Share and BPS Analysis by Neck Diameter, 2025 and 2035
  • Figure 66: Western Europe Y-o-Y Growth Comparison by Neck Diameter, 2025-2035
  • Figure 67: Western Europe Attractiveness Analysis by Neck Diameter
  • Figure 68: Western Europe Value Share and BPS Analysis by Capacity, 2025 and 2035
  • Figure 69: Western Europe Y-o-Y Growth Comparison by Capacity, 2025-2035
  • Figure 70: Western Europe Attractiveness Analysis by Capacity
  • Figure 71: Western Europe Value Share and BPS Analysis by Cap Type, 2025 and 2035
  • Figure 72: Western Europe Y-o-Y Growth Comparison by Cap Type, 2025-2035
  • Figure 73: Western Europe Attractiveness Analysis by Cap Type
  • Figure 74: Western Europe Value Share and BPS Analysis by End Use, 2025 and 2035
  • Figure 75: Western Europe Y-o-Y Growth Comparison by End Use, 2025-2035
  • Figure 76: Western Europe Attractiveness Analysis by End Use
  • Figure 77: Eastern Europe Value Share and BPS Analysis by Country, 2025 and 2035
  • Figure 78: Eastern Europe Value Share and BPS Analysis by Product Type, 2025 and 2035
  • Figure 79: Eastern Europe Y-o-Y Growth Comparison by Product Type, 2025-2035
  • Figure 80: Eastern Europe Attractiveness Analysis by Product Type
  • Figure 81: Eastern Europe Value Share and BPS Analysis by Neck Diameter, 2025 and 2035
  • Figure 82: Eastern Europe Y-o-Y Growth Comparison by Neck Diameter, 2025-2035
  • Figure 83: Eastern Europe Attractiveness Analysis by Neck Diameter
  • Figure 84: Eastern Europe Value Share and BPS Analysis by Capacity, 2025 and 2035
  • Figure 85: Eastern Europe Y-o-Y Growth Comparison by Capacity, 2025-2035
  • Figure 86: Eastern Europe Attractiveness Analysis by Capacity
  • Figure 87: Eastern Europe Value Share and BPS Analysis by Cap Type, 2025 and 2035
  • Figure 88: Eastern Europe Y-o-Y Growth Comparison by Cap Type, 2025-2035
  • Figure 89: Eastern Europe Attractiveness Analysis by Cap Type
  • Figure 90: Eastern Europe Value Share and BPS Analysis by End Use, 2025 and 2035
  • Figure 91: Eastern Europe Y-o-Y Growth Comparison by End Use, 2025-2035
  • Figure 92: Eastern Europe Attractiveness Analysis by End Use
  • Figure 93: East Asia Value Share and BPS Analysis by Country, 2025 and 2035
  • Figure 94: East Asia Value Share and BPS Analysis by Product Type, 2025 and 2035
  • Figure 95: East Asia Y-o-Y Growth Comparison by Product Type, 2025-2035
  • Figure 96: East Asia Attractiveness Analysis by Product Type
  • Figure 97: East Asia Value Share and BPS Analysis by Neck Diameter, 2025 and 2035
  • Figure 98: East Asia Y-o-Y Growth Comparison by Neck Diameter, 2025-2035
  • Figure 99: East Asia Attractiveness Analysis by Neck Diameter
  • Figure 100: East Asia Value Share and BPS Analysis by Capacity, 2025 and 2035
  • Figure 101: East Asia Y-o-Y Growth Comparison by Capacity, 2025-2035
  • Figure 102: East Asia Attractiveness Analysis by Capacity
  • Figure 103: East Asia Value Share and BPS Analysis by Cap Type, 2025 and 2035
  • Figure 104: East Asia Y-o-Y Growth Comparison by Cap Type, 2025-2035
  • Figure 105: East Asia Attractiveness Analysis by Cap Type
  • Figure 106: East Asia Value Share and BPS Analysis by End Use, 2025 and 2035
  • Figure 107: East Asia Y-o-Y Growth Comparison by End Use, 2025-2035
  • Figure 108: East Asia Attractiveness Analysis by End Use
  • Figure 109: South Asia & Pacific Value Share and BPS Analysis by Country, 2025 and 2035
  • Figure 110: South Asia & Pacific Value Share and BPS Analysis by Product Type, 2025 and 2035
  • Figure 111: South Asia & Pacific Y-o-Y Growth Comparison by Product Type, 2025-2035
  • Figure 112: South Asia & Pacific Attractiveness Analysis by Product Type
  • Figure 113: South Asia & Pacific Value Share and BPS Analysis by Neck Diameter, 2025 and 2035
  • Figure 114: South Asia & Pacific Y-o-Y Growth Comparison by Neck Diameter, 2025-2035
  • Figure 115: South Asia & Pacific Attractiveness Analysis by Neck Diameter
  • Figure 116: South Asia & Pacific Value Share and BPS Analysis by Capacity, 2025 and 2035
  • Figure 117: South Asia & Pacific Y-o-Y Growth Comparison by Capacity, 2025-2035
  • Figure 118: South Asia & Pacific Attractiveness Analysis by Capacity
  • Figure 119: South Asia & Pacific Value Share and BPS Analysis by Cap Type, 2025 and 2035
  • Figure 120: South Asia & Pacific Y-o-Y Growth Comparison by Cap Type, 2025-2035
  • Figure 121: South Asia & Pacific Attractiveness Analysis by Cap Type
  • Figure 122: South Asia & Pacific Value Share and BPS Analysis by End Use, 2025 and 2035
  • Figure 123: South Asia & Pacific Y-o-Y Growth Comparison by End Use, 2025-2035
  • Figure 124: South Asia & Pacific Attractiveness Analysis by End Use
  • Figure 125: Middle East and Africa Value Share and BPS Analysis by Country, 2025 and 2035
  • Figure 126: Middle East and Africa Value Share and BPS Analysis by Product Type, 2025 and 2035
  • Figure 127: Middle East and Africa Y-o-Y Growth Comparison by Product Type, 2025-2035
  • Figure 128: Middle East and Africa Attractiveness Analysis by Product Type
  • Figure 129: Middle East and Africa Value Share and BPS Analysis by Neck Diameter, 2025 and 2035
  • Figure 130: Middle East and Africa Y-o-Y Growth Comparison by Neck Diameter, 2025-2035
  • Figure 131: Middle East and Africa Attractiveness Analysis by Neck Diameter
  • Figure 132: Middle East and Africa Value Share and BPS Analysis by Capacity, 2025 and 2035
  • Figure 133: Middle East and Africa Y-o-Y Growth Comparison by Capacity, 2025-2035
  • Figure 134: Middle East and Africa Attractiveness Analysis by Capacity
  • Figure 135: Middle East and Africa Value Share and BPS Analysis by Cap Type, 2025 and 2035
  • Figure 136: Middle East and Africa Y-o-Y Growth Comparison by Cap Type, 2025-2035
  • Figure 137: Middle East and Africa Attractiveness Analysis by Cap Type
  • Figure 138: Middle East and Africa Value Share and BPS Analysis by End Use, 2025 and 2035
  • Figure 139: Middle East and Africa Y-o-Y Growth Comparison by End Use, 2025-2035
  • Figure 140: Middle East and Africa Attractiveness Analysis by End Use
  • Figure 141: Global - Tier Structure Analysis
  • Figure 142: Global - Company Share Analysis
     

Frequently Asked Questions

What is the projected market size of laminated tubes by 2035?

The industry is expected to reach USD 5.1 billion by 2035, up from USD 3.5 billion in 2025.

What is the forecasted CAGR for the laminated tubes market from 2025 to 2035?

The market is projected to grow at a CAGR of 3.9% during the forecast period.

Which product type will lead the market in 2025?

Aluminum Barrier Laminated (ABL) tubes will account for 60% of global product share in 2025.

What tube capacity segment will dominate the market by 2025?

Tubes with 50-100 ml capacity will hold 57% of laminated tube volume in 2025.

Which end-use segment will consume the most laminated tubes in 2025?

The cosmetics segment will account for 42.8% of laminated tube demand by volume in 2025.

Explore Similar Insights

Future Market Insights

Laminated Tubes Market