Silk Laminated Paper Market Size, Share, and Forecast Outlook 2025 to 2035

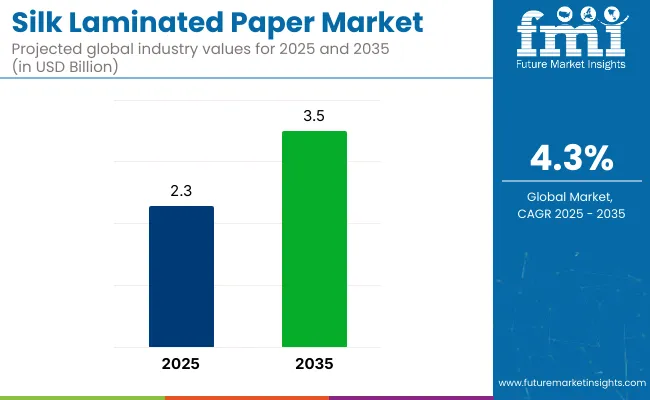
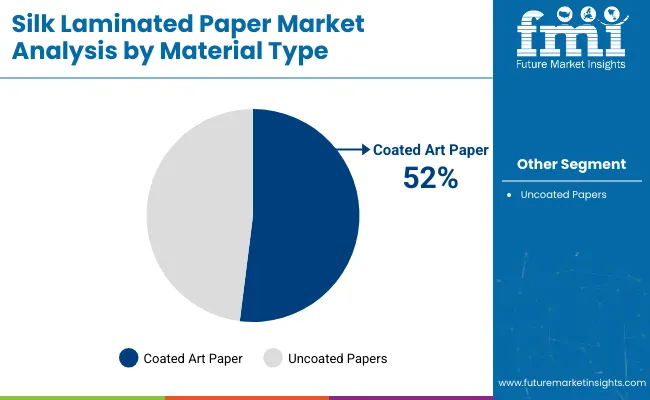
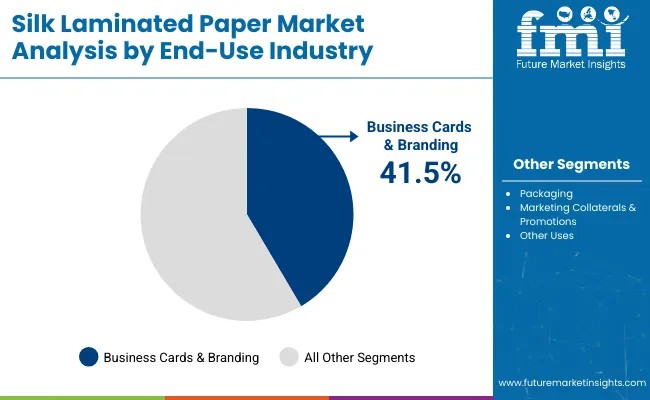
The silk laminated paper market is valued at USD 2.3 billion and is projected to reach USD 3.5 billion by 2035, growing at a CAGR of 4.3%. Coated art paper will continue to be the leading material, capturing 52% of the industry in 2025. The demand for laminated paper in business cards and branding will remain strong, accounting for 41.5% of total industry demand. As companies shift toward premium, durable, and eco-friendly materials for packaging and promotional materials, the silk laminated paper industry will experience steady growth.
Quick Stats for Silk Laminated Paper Market

  • Market Value (2025): USD 2.3 billion
  • Forecast Value (2035): USD 3.5 billion
  • Forecast CAGR: 4.3%
  • Leading Segment: Coated art paper (52% share)
  • Key Growth Region: Asia Pacific (India)
  • Key Players: Laminate Technologies, Tekra, Arkwright Advanced Coating, Inc., Dura-Fibre, LLC., Multiplastics Limited, LGR Packaging, Lam Pro

Silk Laminated Paper Market

The increasing use of silk laminated sheets in sectors like packaging and promotions will continue to support industry expansion, especially in emerging economies such as India and China, where the demand for high-quality, durable packaging solutions is rising. The focus on enhancing product aesthetics and the rise in brand-conscious consumer behavior will also contribute to the continued growth of the industry.

Analyzing Silk Laminated Paper Market by Top Investment Segments

The industry is driven by coated art paper in the material segment, business cards & branding in the end-use segment, and 200-300 gsm thickness for durability and premium feel. These segments are expected to maintain dominance, with steady growth supported by increasing demand for high-quality, visually appealing, and eco-friendly printed materials.

Coated Art Paper to dominate the material segment

Coated art paper is expected to dominate the material segment in 2025, capturing 52% of the industry share. Known for its smooth finish and superior printability, coated art paper is widely used in premium packaging, business cards, and promotional materials.
  • Companies like Durafibre and Henan Jianwei Paper Co., Ltd. are focusing on enhancing the quality and maintainability of coated art paper, making it the preferred choice for high-end applications.
  • The demand for aesthetically appealing and durable products in sectors like marketing and branding will continue to drive the growth of coated art paper.

Silk Laminated Paper Market Analysis By Material Type

Business Cards & Branding will lead the end-use sector

Business cards and branding are expected to account for 41.5% of the silk laminated paper industry in 2025. As businesses seek premium, durable, and visually appealing materials to represent their brand, silk laminated paper continues to be a popular choice for business cards and marketing collateral.
  • The high-quality finish and vibrant colors of silk laminated paper make it ideal for businesses looking to make a lasting impression.
  • Companies such as Sierra Coating Technologies and RELYCO are capitalizing on this demand by offering customized solutions for branding, further strengthening the growth of this segment.

Silk Laminated Paper Market Analysis By End Use Industry

200-300 gsm Thickness to remain Preferred

The 200-300 gsm thickness segment will hold the largest share in the silk laminated paper industry, representing 45% in 2025. This thickness range is preferred for applications such as business cards, promotional materials, and packaging, where durability and a premium feel are essential.

  • The versatility of 200-300 gsm paper allows it to be used in a variety of end-use applications while maintaining an attractive, professional appearance.
  • As the demand for higher-quality printed materials increases in industries such as marketing and branding, this thickness segment is expected to continue leading the industry through 2035.

Top Silk Laminated Paper Market Dynamics

The industry is driven by the increasing demand for premium, eco-conscious products, particularly in business cards, branding, and packaging. However, raw material price fluctuations present challenges for manufacturers. As eco-responsibility and eco-friendly production become key trends, these dynamics will shape the industry's growth over the coming years.

Rising demand for premium and eco-conscious paper solutions

The demand for silk laminated paper is growing as businesses and consumers increasingly prefer high-quality, eco-conscious products for branding and packaging. Coated art paper and premium finishes are especially in demand for business cards, marketing materials, and promotional packaging. As eco-responsibility becomes a growing priority for industries, manufacturers are turning to eco-friendly production methods to meet industry expectations. This shift toward premium and eco-conscious materials is driving industry growth across key regions.

Raw material price fluctuations are affecting growth

Fluctuations in raw material prices, especially for coated art paper and specialty finishes, are posing challenges to manufacturers in the industry. These price changes can impact production costs, affecting the profitability of manufacturers. As the demand for eco-friendly materials rises, companies must navigate these price fluctuations while meeting customer expectations for premium quality. Managing raw material costs will be crucial for maintaining profitability and competitiveness in the industry.

Analyzing Top Countries Manufacturing, Distributing, and Supplying Silk Laminated Paper

The industry is growing steadily across the United States, the United Kingdom, China, India, and Japan, driven by strong demand in business cards, branding, and premium packaging. Coated art paper remains the dominant material, and eco-responsibility trends are supporting industry expansion. China and India are expected to experience the fastest growth, driven by increasing industrial demand.
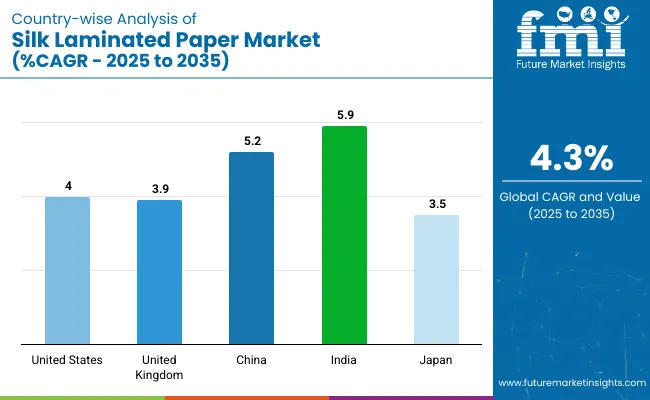
Country Wise Analysis Of Silk Laminated Paper Market Cagr 2025 To 2035

Countries CAGR (2025 to 2035)
United States 4%
United Kingdom 3.9%
China 5.2%
India 5.9%
Japan 3.5%

An overview of the United States laminated paper market growth

The industry in the United States is expected to grow at a CAGR of 4%, supported by continued demand from marketing, packaging, and branding sectors. The USA is the largest industry for silk laminated paper, with a growing demand for premium materials used in business cards, branding, and promotional materials.

  • Coated art paper remains the material of choice, and with the increasing focus on eco-responsibility, manufacturers are investing in eco-friendly solutions.
  • Companies such as Durafibre and Sierra Coating Technologies are expanding their product offerings to cater to the rising need for durable and aesthetically appealing paper.

In-depth analysis of the United Kingdom silk laminated paper industry sales

With a CAGR of 3.9%, the industry in United Kingdom is expected to continue expanding, fueled by increasing demand for premium business cards, branded marketing materials, and eco-conscious packaging solutions in various industries. The UK is experiencing steady growth in the industry, driven by demand from the premium packaging, marketing, and promotional materials sectors.

  • The focus on eco-responsibility is growing, with increasing consumer preference for eco-friendly and high-quality products.
  • Coated art paper remains the leading material, and manufacturers like RELYCO are innovating to offer durable, eco-conscious options.

China’s growing silk laminated paper industry potential

With a projected CAGR of 5.2%, China’s industry is expected to maintain strong growth, particularly in the packaging and branding sectors, as the demand for high-quality, durable paper increases across multiple industries.

  • China is experiencing rapid growth in the silk laminated paper industry, with strong demand for high-quality materials in branding, packaging, and marketing. The demand for coated art paper, especially in premium packaging and promotional materials, is rising due to increased urbanization and industrial growth.
  • Companies like Henan Jianwei Paper Co., Ltd. are focusing on enhancing the quality and eco-responsibility of their products.

India’s increasing demand for silk laminated paper

Companies like Omkar Paper are tapping into the growing industry by offering eco-conscious, high-quality options. India is projected to grow at a CAGR of 5.9%, with increased demand from the agriculture, manufacturing, and retail sectors. India’s silk laminated paper industry is expected to grow rapidly, driven by the rising demand for premium materials in business cards, packaging, and promotional products.

  • Coated art paper is expected to dominate, with increasing adoption in branding and packaging applications.
  • As the Indian economy expands and consumer demand for high-quality, eco-friendly products rises, the industry is expected to see continued growth.

Japan’s growing silk laminated paper industry outlook

With a projected CAGR of 3.5%, Japan’s industry is expected to continue expanding, driven by both local demand for premium products and increasing export opportunities in the Asia-Pacific region.Japan is seeing steady demand for silk laminated paper, especially for premium materials used in business cards, branding, and promotional items.
  • The industry is driven by a focus on high-quality printing and packaging solutions, with a preference for durability and aesthetic appeal.
  • Companies such as Nihon Matai Co. Ltd. are focused on offering high-quality, eco-friendly products to meet the growing demand.

Leading Silk Laminated Paper Suppliers

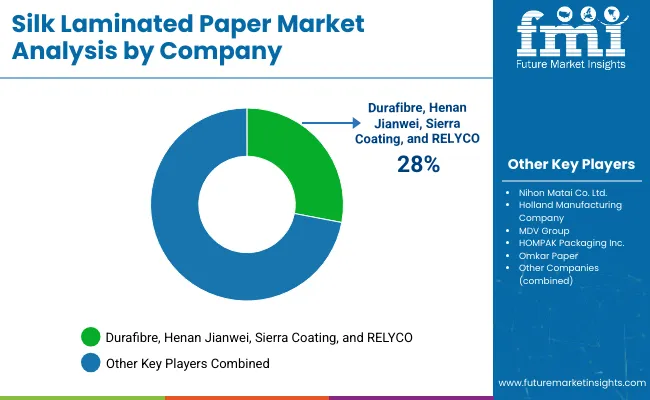
Silk Laminated Paper Market Analysis By Company

The industry is characterized by a mix of leading suppliers and emerging players who focus on enhancing product offerings through innovation and strategic initiatives. Key players such as Laminate Technologies, Tekra, and Arkwright Advanced Coating, Inc. are leveraging advanced R&D to introduce new and improved products.

These companies are heavily investing in creating eco-friendly and green solutions, responding to increasing consumer demand for environmentally responsible packaging. For instance, Dura-Fibre, LLC. Focuses on providing high-quality laminated papers with a strong emphasis on performance and durability. New product launches and continuous technological advancements are key strategies driving their position.

The market is fragmented, with numerous small and medium-sized enterprises entering the space, although consolidation is visible with some mergers and acquisitions. Entry barriers include significant capital investment in research, production, and technology, making it challenging for new entrants. However, as companies continue to innovate and cater to diverse industry needs, the competitive landscape remains dynamic and growth-oriented.

Recent Industry News

The industry has been witnessing a shift towards eco-responsibility and innovation. Companies are increasingly focusing on developing eco-friendly materials and enhancing the durability and aesthetics of their products. For instance, advancements in coating technologies have led to the creation of silk laminated papers that are not only visually appealing but also resistant to wear and environmental factors.

Additionally, the demand for premium packaging solutions has driven the adoption of silk laminated paper in various applications, including business cards, promotional materials, and packaging. These trends indicate a growing emphasis on quality, eco-responsibility, and functionality in the industry.

Report Scope of the Industry

Report Attributes Details
Current Total Industry Size (2025) USD 2.3 billion
Projected Industry Size (2035) USD 3.5 billion
CAGR (2025 to 2035) 4.3%
Base Year for Estimation 2024
Historical Period 2020 to 2024
Projections Period 2025 to 2035
Quantitative Units USD billion for value and thousand tons for volume
Material Types Analyzed Coated Art Paper, Uncoated Papers
End-Use Segmentation Business Cards & Branding, Packaging, Market ing Collaterals & Promotions, Other Uses
Thickness Segmentation 200 - 300 gsm, 300 - 400 gsm, Above 400 gsm
Regions Covered North America, Europe, Asia Pacific, Latin America, Middle East and Africa
Countries Covered United States, Canada, Mexico, Brazil, Argentina, Germany, France, United Kingdom, Italy, Spain, Netherlands, China, India, Japan, South Korea, Australia, New Zealand, GCC Countries, South Africa
Key Players Influencing the Industry Laminate Technologies, Tekra, Arkwright Advanced Coating, Inc., Dura-Fibre, LLC., Multiplastics Limited, LGR Packaging, Lam Pro, Inc., Bell Laminates, Specialty Laminates, and D&K Group.
Additional Attributes Dollar sales by material type, end-use, and thickness, growing demand in premium packaging applications, adoption in ecofriendly and eco-friendly packaging trends, regional differences in silk laminated paper adoption, innovation in design and functionality in market ing collaterals.

Leading Players

  • Laminate Technologies
  • Tekra
  • Arkwright Advanced Coating, Inc.
  • Dura-Fibre, LLC.
  • Multiplastics Limited
  • LGR Packaging
  • Lam Pro, Inc
  • Bell laminates
  • Specialty Laminates
  • D&K Group

Key Segments Studied in the Industry

By Material Type:

The industry is segmented into coated art paper and uncoated papers.

By End-Use Industry:

The industry is segmented into business cards & branding, packaging, marketing collaterals & promotions, and other uses.

By Thickness:

The industry is segmented into 200-300 gsm, 300-400 gsm, and above 400 gsm.

By Region:

The industry is segmented into North America, Europe, Asia Pacific, Latin America, and Middle East & Africa.

Table of Content

  1. Executive Summary
    • Global Market Outlook
    • Demand-side Trends
    • Supply-side Trends
    • Technology Roadmap Analysis
    • Analysis and Recommendations
  2. Market Overview
    • Market Coverage / Taxonomy
    • Market Definition / Scope / Limitations
  3. Market Background
    • Market Dynamics
      • Drivers
      • Restraints
      • Opportunity
      • Trends
    • Scenario Forecast
      • Demand in Optimistic Scenario
      • Demand in Likely Scenario
      • Demand in Conservative Scenario
    • Opportunity Map Analysis
    • Product Life Cycle Analysis
    • Supply Chain Analysis
      • Supply Side Participants and their Roles
        • Producers
        • Mid-Level Participants (Traders/ Agents/ Brokers)
        • Wholesalers and Distributors
      • Value Added and Value Created at Node in the Supply Chain
      • List of Raw Material Suppliers
      • List of Existing and Potential Buyer’s
    • Investment Feasibility Matrix
    • Value Chain Analysis
      • Profit Margin Analysis
      • Wholesalers and Distributors
      • Retailers
    • PESTLE and Porter’s Analysis
    • Regulatory Landscape
      • By Key Regions
      • By Key Countries
    • Regional Parent Market Outlook
    • Production and Consumption Statistics
    • Import and Export Statistics
  4. Global Market Analysis 2020 to 2024 and Forecast, 2025 to 2035
    • Historical Market Size Value (USD Billion) & Volume (Million units) Analysis, 2020 to 2024
    • Current and Future Market Size Value (USD Billion) & Volume (Million units) Projections, 2025 to 2035
      • Y-o-Y Growth Trend Analysis
      • Absolute $ Opportunity Analysis
  5. Global Market Pricing Analysis 2020 to 2024 and Forecast 2025 to 2035
  6. Global Market Analysis 2020 to 2024 and Forecast 2025 to 2035, By Material Type
    • Introduction / Key Findings
    • Historical Market Size Value (USD Billion) & Volume (Million units) Analysis By Material Type, 2020 to 2024
    • Current and Future Market Size Value (USD Billion) & Volume (Million units) Analysis and Forecast By Material Type, 2025 to 2035
      • Coated Art Paper
      • Uncoated Papers
    • Y-o-Y Growth Trend Analysis By Material Type, 2020 to 2024
    • Absolute $ Opportunity Analysis By Material Type, 2025 to 2035
  7. Global Market Analysis 2020 to 2024 and Forecast 2025 to 2035, By End-Use Industry
    • Introduction / Key Findings
    • Historical Market Size Value (USD Billion) & Volume (Million units) Analysis By End-Use Industry, 2020 to 2024
    • Current and Future Market Size Value (USD Billion) & Volume (Million units) Analysis and Forecast By End-Use Industry, 2025 to 2035
      • Business Cards & Branding
      • Packaging
      • Marketing Collaterals & Promotions
      • Other Uses
    • Y-o-Y Growth Trend Analysis By End-Use Industry, 2020 to 2024
    • Absolute $ Opportunity Analysis By End-Use Industry, 2025 to 2035
  8. Global Market Analysis 2020 to 2024 and Forecast 2025 to 2035, By Thickness
    • Introduction / Key Findings
    • Historical Market Size Value (USD Billion) & Volume (Million units) Analysis By Thickness, 2020 to 2024
    • Current and Future Market Size Value (USD Billion) & Volume (Million units) Analysis and Forecast By Thickness, 2025 to 2035
      • 200–300 GSM
      • 300–400 GSM
      • Above 400 GSM
    • Y-o-Y Growth Trend Analysis By Thickness, 2020 to 2024
    • Absolute $ Opportunity Analysis By Thickness, 2025 to 2035
  9. Global Market Analysis 2020 to 2024 and Forecast 2025 to 2035, By Region
    • Introduction
    • Historical Market Size Value (USD Billion) & Volume (Million units) Analysis By Region, 2020 to 2024
    • Current Market Size Value (USD Billion) & Volume (Million units) Analysis and Forecast By Region, 2025 to 2035
      • North America
      • Latin America
      • Europe
      • East Asia
      • South Asia
      • Oceania
      • MEA
    • Market Attractiveness Analysis By Region
  10. North America Market Analysis 2020 to 2024 and Forecast 2025 to 2035, By Country
    • Historical Market Size Value (USD Billion) & Volume (Million units) Trend Analysis By Market Taxonomy, 2020 to 2024
    • Market Size Value (USD Billion) & Volume (Million units) Forecast By Market Taxonomy, 2025 to 2035
      • By Country
        • USA
        • Canada
      • By Material Type
      • By End-Use Industry
      • By Thickness
    • Market Attractiveness Analysis
      • By Country
      • By Material Type
      • By End-Use Industry
      • By Thickness
    • Key Takeaways
  11. Latin America Market Analysis 2020 to 2024 and Forecast 2025 to 2035, By Country
    • Historical Market Size Value (USD Billion) & Volume (Million units) Trend Analysis By Market Taxonomy, 2020 to 2024
    • Market Size Value (USD Billion) & Volume (Million units) Forecast By Market Taxonomy, 2025 to 2035
      • By Country
        • Brazil
        • Mexico
        • Argentina
        • Chile
        • Peru
        • Rest of Latin America
      • By Material Type
      • By End-Use Industry
      • By Thickness
    • Market Attractiveness Analysis
      • By Country
      • By Material Type
      • By End-Use Industry
      • By Thickness
    • Key Takeaways
  12. Europe Market Analysis 2020 to 2024 and Forecast 2025 to 2035, By Country
    • Historical Market Size Value (USD Billion) & Volume (Million units) Trend Analysis By Market Taxonomy, 2020 to 2024
    • Market Size Value (USD Billion) & Volume (Million units) Forecast By Market Taxonomy, 2025 to 2035
      • By Country
        • Germany
        • Italy
        • France
        • UK
        • Spain
        • Russia
        • BENELUX
        • Rest of Europe
      • By Material Type
      • By End-Use Industry
      • By Thickness
    • Market Attractiveness Analysis
      • By Country
      • By Material Type
      • By End-Use Industry
      • By Thickness
    • Key Takeaways
  13. East Asia Market Analysis 2020 to 2024 and Forecast 2025 to 2035, By Country
    • Historical Market Size Value (USD Billion) & Volume (Million units) Trend Analysis By Market Taxonomy, 2020 to 2024
    • Market Size Value (USD Billion) & Volume (Million units) Forecast By Market Taxonomy, 2025 to 2035
      • By Country
        • China
        • Japan
        • South Korea
      • By Material Type
      • By End-Use Industry
      • By Thickness
    • Market Attractiveness Analysis
      • By Country
      • By Material Type
      • By End-Use Industry
      • By Thickness
    • Key Takeaways
  14. South Asia Market Analysis 2020 to 2024 and Forecast 2025 to 2035, By Country
    • Historical Market Size Value (USD Billion) & Volume (Million units) Trend Analysis By Market Taxonomy, 2020 to 2024
    • Market Size Value (USD Billion) & Volume (Million units) Forecast By Market Taxonomy, 2025 to 2035
      • By Country
        • India
        • Thailand
        • Malaysia
        • Indonesia
        • Rest of South Asia
      • By Material Type
      • By End-Use Industry
      • By Thickness
    • Market Attractiveness Analysis
      • By Country
      • By Material Type
      • By End-Use Industry
      • By Thickness
    • Key Takeaways
  15. Oceania Market Analysis 2020 to 2024 and Forecast 2025 to 2035, By Country
    • Historical Market Size Value (USD Billion) & Volume (Million units) Trend Analysis By Market Taxonomy, 2020 to 2024
    • Market Size Value (USD Billion) & Volume (Million units) Forecast By Market Taxonomy, 2025 to 2035
      • By Country
        • Australia
        • New Zealand
      • By Material Type
      • By End-Use Industry
      • By Thickness
    • Market Attractiveness Analysis
      • By Country
      • By Material Type
      • By End-Use Industry
      • By Thickness
    • Key Takeaways
  16. MEA Market Analysis 2020 to 2024 and Forecast 2025 to 2035, By Country
    • Historical Market Size Value (USD Billion) & Volume (Million units) Trend Analysis By Market Taxonomy, 2020 to 2024
    • Market Size Value (USD Billion) & Volume (Million units) Forecast By Market Taxonomy, 2025 to 2035
      • By Country
        • GCC
        • Rest of MEA
      • By Material Type
      • By End-Use Industry
      • By Thickness
    • Market Attractiveness Analysis
      • By Country
      • By Material Type
      • By End-Use Industry
      • By Thickness
    • Key Takeaways
  17. Key Countries Market Analysis
    • USA
      • Pricing Analysis
      • Market Share Analysis, 2024
        • By Material Type
        • By End-Use Industry
        • By Thickness
    • Canada
      • Pricing Analysis
      • Market Share Analysis, 2024
        • By Material Type
        • By End-Use Industry
        • By Thickness
    • Brazil
      • Pricing Analysis
      • Market Share Analysis, 2024
        • By Material Type
        • By End-Use Industry
        • By Thickness
    • Mexico
      • Pricing Analysis
      • Market Share Analysis, 2024
        • By Material Type
        • By End-Use Industry
        • By Thickness
    • Argentina
      • Pricing Analysis
      • Market Share Analysis, 2024
        • By Material Type
        • By End-Use Industry
        • By Thickness
  18. Market Structure Analysis
    • Competition Dashboard
    • Competition Benchmarking
    • Market Share Analysis of Top Players
      • By Regional
      • By Material Type
      • By End-Use Industry
      • By Thickness
  19. Competition Analysis
    • Competition Deep Dive
      • Durafibre
        • Overview
        • Product Portfolio
        • Profitability by Market Segments (Product/Age /Sales Channel/Region)
        • Sales Footprint
        • Strategy Overview
          • Marketing Strategy
          • Product Strategy
          • Channel Strategy
      • Henan Jianwei Paper Co., Ltd.
        • Overview
        • Product Portfolio
        • Profitability by Market Segments (Product/Age /Sales Channel/Region)
        • Sales Footprint
        • Strategy Overview
          • Marketing Strategy
          • Product Strategy
          • Channel Strategy
      • Sierra Coating Technologies
        • Overview
        • Product Portfolio
        • Profitability by Market Segments (Product/Age /Sales Channel/Region)
        • Sales Footprint
        • Strategy Overview
          • Marketing Strategy
          • Product Strategy
          • Channel Strategy
      • RELYCO
        • Overview
        • Product Portfolio
        • Profitability by Market Segments (Product/Age /Sales Channel/Region)
        • Sales Footprint
        • Strategy Overview
          • Marketing Strategy
          • Product Strategy
          • Channel Strategy
      • Nihon Matai Co. Ltd.
        • Overview
        • Product Portfolio
        • Profitability by Market Segments (Product/Age /Sales Channel/Region)
        • Sales Footprint
        • Strategy Overview
          • Marketing Strategy
          • Product Strategy
          • Channel Strategy
      • Holland Manufacturing Company
        • Overview
        • Product Portfolio
        • Profitability by Market Segments (Product/Age /Sales Channel/Region)
        • Sales Footprint
        • Strategy Overview
          • Marketing Strategy
          • Product Strategy
          • Channel Strategy
      • MDV Group
        • Overview
        • Product Portfolio
        • Profitability by Market Segments (Product/Age /Sales Channel/Region)
        • Sales Footprint
        • Strategy Overview
          • Marketing Strategy
          • Product Strategy
          • Channel Strategy
      • HOMPAK Packaging Inc.
        • Overview
        • Product Portfolio
        • Profitability by Market Segments (Product/Age /Sales Channel/Region)
        • Sales Footprint
        • Strategy Overview
          • Marketing Strategy
          • Product Strategy
          • Channel Strategy
      • Omkar Paper
        • Overview
        • Product Portfolio
        • Profitability by Market Segments (Product/Age /Sales Channel/Region)
        • Sales Footprint
        • Strategy Overview
          • Marketing Strategy
          • Product Strategy
          • Channel Strategy
      • Lathikasri Packaging
        • Overview
        • Product Portfolio
        • Profitability by Market Segments (Product/Age /Sales Channel/Region)
        • Sales Footprint
        • Strategy Overview
          • Marketing Strategy
          • Product Strategy
          • Channel Strategy
  20. Assumptions & Acronyms Used
  21. Research Methodology

List of Tables

  • Table 1: Global Market Value (USD Billion) Forecast by Region, 2020 to 2035
  • Table 2: Global Market Volume (Million units) Forecast by Region, 2020 to 2035
  • Table 3: Global Market Value (USD Billion) Forecast by Material Type, 2020 to 2035
  • Table 4: Global Market Volume (Million units) Forecast by Material Type, 2020 to 2035
  • Table 5: Global Market Value (USD Billion) Forecast by End-Use Industry, 2020 to 2035
  • Table 6: Global Market Volume (Million units) Forecast by End-Use Industry, 2020 to 2035
  • Table 7: Global Market Value (USD Billion) Forecast by Thickness, 2020 to 2035
  • Table 8: Global Market Volume (Million units) Forecast by Thickness, 2020 to 2035
  • Table 9: North America Market Value (USD Billion) Forecast by Country, 2020 to 2035
  • Table 10: North America Market Volume (Million units) Forecast by Country, 2020 to 2035
  • Table 11: North America Market Value (USD Billion) Forecast by Material Type, 2020 to 2035
  • Table 12: North America Market Volume (Million units) Forecast by Material Type, 2020 to 2035
  • Table 13: North America Market Value (USD Billion) Forecast by End-Use Industry, 2020 to 2035
  • Table 14: North America Market Volume (Million units) Forecast by End-Use Industry, 2020 to 2035
  • Table 15: North America Market Value (USD Billion) Forecast by Thickness, 2020 to 2035
  • Table 16: North America Market Volume (Million units) Forecast by Thickness, 2020 to 2035
  • Table 17: Latin America Market Value (USD Billion) Forecast by Country, 2020 to 2035
  • Table 18: Latin America Market Volume (Million units) Forecast by Country, 2020 to 2035
  • Table 19: Latin America Market Value (USD Billion) Forecast by Material Type, 2020 to 2035
  • Table 20: Latin America Market Volume (Million units) Forecast by Material Type, 2020 to 2035
  • Table 21: Latin America Market Value (USD Billion) Forecast by End-Use Industry, 2020 to 2035
  • Table 22: Latin America Market Volume (Million units) Forecast by End-Use Industry, 2020 to 2035
  • Table 23: Latin America Market Value (USD Billion) Forecast by Thickness, 2020 to 2035
  • Table 24: Latin America Market Volume (Million units) Forecast by Thickness, 2020 to 2035
  • Table 25: Europe Market Value (USD Billion) Forecast by Country, 2020 to 2035
  • Table 26: Europe Market Volume (Million units) Forecast by Country, 2020 to 2035
  • Table 27: Europe Market Value (USD Billion) Forecast by Material Type, 2020 to 2035
  • Table 28: Europe Market Volume (Million units) Forecast by Material Type, 2020 to 2035
  • Table 29: Europe Market Value (USD Billion) Forecast by End-Use Industry, 2020 to 2035
  • Table 30: Europe Market Volume (Million units) Forecast by End-Use Industry, 2020 to 2035
  • Table 31: Europe Market Value (USD Billion) Forecast by Thickness, 2020 to 2035
  • Table 32: Europe Market Volume (Million units) Forecast by Thickness, 2020 to 2035
  • Table 33: East Asia Market Value (USD Billion) Forecast by Country, 2020 to 2035
  • Table 34: East Asia Market Volume (Million units) Forecast by Country, 2020 to 2035
  • Table 35: East Asia Market Value (USD Billion) Forecast by Material Type, 2020 to 2035
  • Table 36: East Asia Market Volume (Million units) Forecast by Material Type, 2020 to 2035
  • Table 37: East Asia Market Value (USD Billion) Forecast by End-Use Industry, 2020 to 2035
  • Table 38: East Asia Market Volume (Million units) Forecast by End-Use Industry, 2020 to 2035
  • Table 39: East Asia Market Value (USD Billion) Forecast by Thickness, 2020 to 2035
  • Table 40: East Asia Market Volume (Million units) Forecast by Thickness, 2020 to 2035
  • Table 41: South Asia Market Value (USD Billion) Forecast by Country, 2020 to 2035
  • Table 42: South Asia Market Volume (Million units) Forecast by Country, 2020 to 2035
  • Table 43: South Asia Market Value (USD Billion) Forecast by Material Type, 2020 to 2035
  • Table 44: South Asia Market Volume (Million units) Forecast by Material Type, 2020 to 2035
  • Table 45: South Asia Market Value (USD Billion) Forecast by End-Use Industry, 2020 to 2035
  • Table 46: South Asia Market Volume (Million units) Forecast by End-Use Industry, 2020 to 2035
  • Table 47: South Asia Market Value (USD Billion) Forecast by Thickness, 2020 to 2035
  • Table 48: South Asia Market Volume (Million units) Forecast by Thickness, 2020 to 2035
  • Table 49: Oceania Market Value (USD Billion) Forecast by Country, 2020 to 2035
  • Table 50: Oceania Market Volume (Million units) Forecast by Country, 2020 to 2035
  • Table 51: Oceania Market Value (USD Billion) Forecast by Material Type, 2020 to 2035
  • Table 52: Oceania Market Volume (Million units) Forecast by Material Type, 2020 to 2035
  • Table 53: Oceania Market Value (USD Billion) Forecast by End-Use Industry, 2020 to 2035
  • Table 54: Oceania Market Volume (Million units) Forecast by End-Use Industry, 2020 to 2035
  • Table 55: Oceania Market Value (USD Billion) Forecast by Thickness, 2020 to 2035
  • Table 56: Oceania Market Volume (Million units) Forecast by Thickness, 2020 to 2035
  • Table 57: MEA Market Value (USD Billion) Forecast by Country, 2020 to 2035
  • Table 58: MEA Market Volume (Million units) Forecast by Country, 2020 to 2035
  • Table 59: MEA Market Value (USD Billion) Forecast by Material Type, 2020 to 2035
  • Table 60: MEA Market Volume (Million units) Forecast by Material Type, 2020 to 2035
  • Table 61: MEA Market Value (USD Billion) Forecast by End-Use Industry, 2020 to 2035
  • Table 62: MEA Market Volume (Million units) Forecast by End-Use Industry, 2020 to 2035
  • Table 63: MEA Market Value (USD Billion) Forecast by Thickness, 2020 to 2035
  • Table 64: MEA Market Volume (Million units) Forecast by Thickness, 2020 to 2035

List of Figures

  • Figure 1: Global Market Volume (Million units) Forecast 2020 to 2035
  • Figure 2: Global Market Pricing Analysis
  • Figure 3: Global Market Value (USD Billion) Forecast 2020 to 2035
  • Figure 4: Global Market Value Share and BPS Analysis by Material Type, 2025 and 2035
  • Figure 5: Global Market Y-o-Y Growth Comparison by Material Type, 2025 to 2035
  • Figure 6: Global Market Attractiveness Analysis by Material Type
  • Figure 7: Global Market Value Share and BPS Analysis by End-Use Industry, 2025 and 2035
  • Figure 8: Global Market Y-o-Y Growth Comparison by End-Use Industry, 2025 to 2035
  • Figure 9: Global Market Attractiveness Analysis by End-Use Industry
  • Figure 10: Global Market Value Share and BPS Analysis by Thickness, 2025 and 2035
  • Figure 11: Global Market Y-o-Y Growth Comparison by Thickness, 2025 to 2035
  • Figure 12: Global Market Attractiveness Analysis by Thickness
  • Figure 13: Global Market Value (USD Billion) Share and BPS Analysis by Region, 2025 and 2035
  • Figure 14: Global Market Y-o-Y Growth Comparison by Region, 2025 to 2035
  • Figure 15: Global Market Attractiveness Analysis by Region
  • Figure 16: North America Market Incremental $ Opportunity, 2025 to 2035
  • Figure 17: Latin America Market Incremental $ Opportunity, 2025 to 2035
  • Figure 18: Europe Market Incremental $ Opportunity, 2025 to 2035
  • Figure 19: East Asia Market Incremental $ Opportunity, 2025 to 2035
  • Figure 20: South Asia Market Incremental $ Opportunity, 2025 to 2035
  • Figure 21: Oceania Market Incremental $ Opportunity, 2025 to 2035
  • Figure 22: MEA Market Incremental $ Opportunity, 2025 to 2035
  • Figure 23: North America Market Value Share and BPS Analysis by Country, 2025 and 2035
  • Figure 24: North America Market Value Share and BPS Analysis by Material Type, 2025 and 2035
  • Figure 25: North America Market Y-o-Y Growth Comparison by Material Type, 2025 to 2035
  • Figure 26: North America Market Attractiveness Analysis by Material Type
  • Figure 27: North America Market Value Share and BPS Analysis by End-Use Industry, 2025 and 2035
  • Figure 28: North America Market Y-o-Y Growth Comparison by End-Use Industry, 2025 to 2035
  • Figure 29: North America Market Attractiveness Analysis by End-Use Industry
  • Figure 30: North America Market Value Share and BPS Analysis by Thickness, 2025 and 2035
  • Figure 31: North America Market Y-o-Y Growth Comparison by Thickness, 2025 to 2035
  • Figure 32: North America Market Attractiveness Analysis by Thickness
  • Figure 33: Latin America Market Value Share and BPS Analysis by Country, 2025 and 2035
  • Figure 34: Latin America Market Value Share and BPS Analysis by Material Type, 2025 and 2035
  • Figure 35: Latin America Market Y-o-Y Growth Comparison by Material Type, 2025 to 2035
  • Figure 36: Latin America Market Attractiveness Analysis by Material Type
  • Figure 37: Latin America Market Value Share and BPS Analysis by End-Use Industry, 2025 and 2035
  • Figure 38: Latin America Market Y-o-Y Growth Comparison by End-Use Industry, 2025 to 2035
  • Figure 39: Latin America Market Attractiveness Analysis by End-Use Industry
  • Figure 40: Latin America Market Value Share and BPS Analysis by Thickness, 2025 and 2035
  • Figure 41: Latin America Market Y-o-Y Growth Comparison by Thickness, 2025 to 2035
  • Figure 42: Latin America Market Attractiveness Analysis by Thickness
  • Figure 43: Europe Market Value Share and BPS Analysis by Country, 2025 and 2035
  • Figure 44: Europe Market Value Share and BPS Analysis by Material Type, 2025 and 2035
  • Figure 45: Europe Market Y-o-Y Growth Comparison by Material Type, 2025 to 2035
  • Figure 46: Europe Market Attractiveness Analysis by Material Type
  • Figure 47: Europe Market Value Share and BPS Analysis by End-Use Industry, 2025 and 2035
  • Figure 48: Europe Market Y-o-Y Growth Comparison by End-Use Industry, 2025 to 2035
  • Figure 49: Europe Market Attractiveness Analysis by End-Use Industry
  • Figure 50: Europe Market Value Share and BPS Analysis by Thickness, 2025 and 2035
  • Figure 51: Europe Market Y-o-Y Growth Comparison by Thickness, 2025 to 2035
  • Figure 52: Europe Market Attractiveness Analysis by Thickness
  • Figure 53: East Asia Market Value Share and BPS Analysis by Country, 2025 and 2035
  • Figure 54: East Asia Market Value Share and BPS Analysis by Material Type, 2025 and 2035
  • Figure 55: East Asia Market Y-o-Y Growth Comparison by Material Type, 2025 to 2035
  • Figure 56: East Asia Market Attractiveness Analysis by Material Type
  • Figure 57: East Asia Market Value Share and BPS Analysis by End-Use Industry, 2025 and 2035
  • Figure 58: East Asia Market Y-o-Y Growth Comparison by End-Use Industry, 2025 to 2035
  • Figure 59: East Asia Market Attractiveness Analysis by End-Use Industry
  • Figure 60: East Asia Market Value Share and BPS Analysis by Thickness, 2025 and 2035
  • Figure 61: East Asia Market Y-o-Y Growth Comparison by Thickness, 2025 to 2035
  • Figure 62: East Asia Market Attractiveness Analysis by Thickness
  • Figure 63: South Asia Market Value Share and BPS Analysis by Country, 2025 and 2035
  • Figure 64: South Asia Market Value Share and BPS Analysis by Material Type, 2025 and 2035
  • Figure 65: South Asia Market Y-o-Y Growth Comparison by Material Type, 2025 to 2035
  • Figure 66: South Asia Market Attractiveness Analysis by Material Type
  • Figure 67: South Asia Market Value Share and BPS Analysis by End-Use Industry, 2025 and 2035
  • Figure 68: South Asia Market Y-o-Y Growth Comparison by End-Use Industry, 2025 to 2035
  • Figure 69: South Asia Market Attractiveness Analysis by End-Use Industry
  • Figure 70: South Asia Market Value Share and BPS Analysis by Thickness, 2025 and 2035
  • Figure 71: South Asia Market Y-o-Y Growth Comparison by Thickness, 2025 to 2035
  • Figure 72: South Asia Market Attractiveness Analysis by Thickness
  • Figure 73: Oceania Market Value Share and BPS Analysis by Country, 2025 and 2035
  • Figure 74: Oceania Market Value Share and BPS Analysis by Material Type, 2025 and 2035
  • Figure 75: Oceania Market Y-o-Y Growth Comparison by Material Type, 2025 to 2035
  • Figure 76: Oceania Market Attractiveness Analysis by Material Type
  • Figure 77: Oceania Market Value Share and BPS Analysis by End-Use Industry, 2025 and 2035
  • Figure 78: Oceania Market Y-o-Y Growth Comparison by End-Use Industry, 2025 to 2035
  • Figure 79: Oceania Market Attractiveness Analysis by End-Use Industry
  • Figure 80: Oceania Market Value Share and BPS Analysis by Thickness, 2025 and 2035
  • Figure 81: Oceania Market Y-o-Y Growth Comparison by Thickness, 2025 to 2035
  • Figure 82: Oceania Market Attractiveness Analysis by Thickness
  • Figure 83: MEA Market Value Share and BPS Analysis by Country, 2025 and 2035
  • Figure 84: MEA Market Value Share and BPS Analysis by Material Type, 2025 and 2035
  • Figure 85: MEA Market Y-o-Y Growth Comparison by Material Type, 2025 to 2035
  • Figure 86: MEA Market Attractiveness Analysis by Material Type
  • Figure 87: MEA Market Value Share and BPS Analysis by End-Use Industry, 2025 and 2035
  • Figure 88: MEA Market Y-o-Y Growth Comparison by End-Use Industry, 2025 to 2035
  • Figure 89: MEA Market Attractiveness Analysis by End-Use Industry
  • Figure 90: MEA Market Value Share and BPS Analysis by Thickness, 2025 and 2035
  • Figure 91: MEA Market Y-o-Y Growth Comparison by Thickness, 2025 to 2035
  • Figure 92: MEA Market Attractiveness Analysis by Thickness
  • Figure 93: Global Market - Tier Structure Analysis
  • Figure 94: Global Market - Company Share Analysis

Frequently Asked Questions

What is the projected industry size of the silk laminated paper industry by 2035?

The global industry is projected to reach USD 3.5 billion by 2035.

What is the estimated size of the silk laminated paper industry in 2025?

The industry is expected to be valued at USD 2.3 billion in 2025.

Which material segment will dominate the silk laminated paper industry?

Coated art paper is expected to dominate the material segment, accounting for 52% of the industry share in 2025.

Which end-use industry holds the largest share in the silk laminated paper industry?

Business cards & branding will hold the largest share, accounting for 41.5% of the industry demand in 2025.

Which thickness segment will lead the silk laminated paper industry?

The 200-300 gsm thickness segment will dominate, holding 45% of the industry share in 2025.

Explore Plastic Packaging Insights

Future Market Insights

Silk Laminated Paper Market