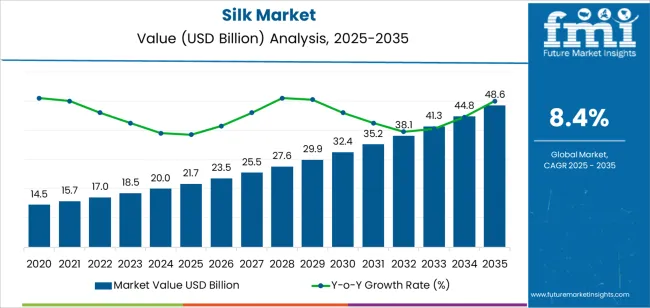
The silk market is witnessing stable expansion, primarily driven by increasing consumer inclination toward premium natural fibers and growing demand from the textile and apparel industries. Silk’s superior tensile strength, sheen, and luxurious feel continue to position it as a high-value material across global fashion and furnishing applications.
The market benefits from advancements in sericulture techniques and government initiatives supporting sustainable silk production, especially in Asia-Pacific, which remains the leading production hub. Rising awareness regarding eco-friendly and biodegradable fibers is further stimulating adoption as consumers shift away from synthetic alternatives.
Additionally, the integration of silk in non-traditional applications such as cosmetics, medical sutures, and home décor is enhancing market diversification. As supply chain efficiency improves and global fashion trends favor natural fabrics, the silk market is expected to maintain steady growth, supported by technological innovations in spinning and dyeing that enhance product quality and yield.

| Metric | Value |
|---|---|
| Silk Market Estimated Value in (2025 E) | USD 21.7 billion |
| Silk Market Forecast Value in (2035 F) | USD 48.6 billion |
| Forecast CAGR (2025 to 2035) | 8.4% |
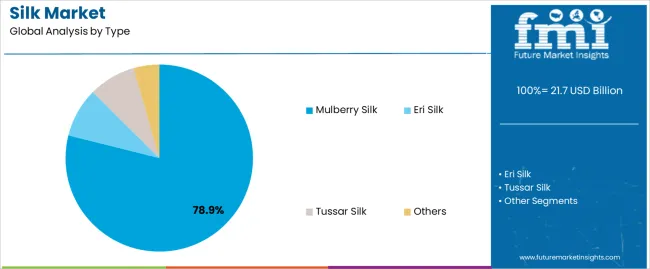
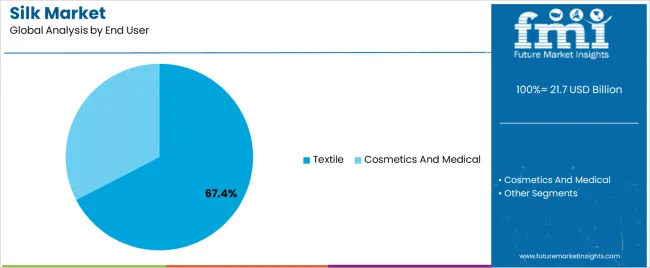
The market is segmented by Type and End User and region. By Type, the market is divided into Mulberry Silk, Eri Silk, Tussar Silk, and Others. In terms of End User, the market is classified into Textile and Cosmetics And Medical. Regionally, the market is classified into North America, Latin America, Western Europe, Eastern Europe, Balkan & Baltic Countries, Russia & Belarus, Central Asia, East Asia, South Asia & Pacific, and the Middle East & Africa.

The mulberry silk segment leads the type category, accounting for approximately 78.90% share of the global silk market. Its dominance is attributed to superior fiber quality, consistent texture, and widespread use in apparel and luxury textiles. Mulberry silk production benefits from a well-established sericulture ecosystem, particularly in China and India, which collectively contribute the majority of global supply.
The fiber’s high strength, smoothness, and natural luster make it the preferred choice for premium clothing and upholstery fabrics. Additionally, its compatibility with diverse dyeing and weaving techniques enhances its value across high-end fashion and interior design sectors.
With increasing emphasis on sustainability and natural fiber sourcing, mulberry silk continues to outperform other types due to its controlled cultivation and refined processing techniques. The segment’s prominence is expected to persist as demand for quality-driven and eco-conscious textiles remains strong globally.

The textile segment dominates the end-user category, contributing approximately 67.40% share of the silk market. This dominance is driven by silk’s extensive application in apparel, luxury fashion, and home furnishing fabrics. The segment benefits from rising disposable incomes and growing consumer preference for high-quality natural fibers in both traditional and contemporary designs.
Silk’s versatility across clothing, scarves, ties, and decorative fabrics enhances its demand among designers and manufacturers alike. Continuous innovation in silk blending and finishing techniques has improved durability and texture, broadening usage in everyday apparel while retaining its premium appeal.
Additionally, the resurgence of traditional handloom and artisanal silk products in key Asian markets supports long-term growth. With expanding global textile trade and heightened focus on sustainable material sourcing, the textile segment is projected to remain the largest contributor to silk consumption.
Emerging markets, particularly in Asia Pacific regions such as China, India, and Southeast Asia, are witnessing growing demand for silk products due to rising disposable incomes and increasing fashion consciousness among consumers.
The scope for silk rose at a 9.6% CAGR between 2020 and 2025. The global market is anticipated to grow at a moderate CAGR of 8.4% over the forecast period 2025 to 2035.
The silk market likely experienced steady demand growth during the historical period, driven by factors such as rising disposable incomes, fashion trends, and the increasing popularity of silk products in both traditional and emerging markets.
Advances in sericulture technology, silk processing techniques, and textile manufacturing likely contributed to improved silk quality, production efficiency, and cost effectiveness.
The silk market may have expanded into new geographical regions and diversified product offerings to meet evolving consumer preferences and market demands. Trade agreements, tariff policies, and market liberalization measures may have influenced global trade flows and market dynamics in the silk industry.
The forecast projections of the market anticipate continued growth in the silk market driven by factors such as population growth, urbanization, and changing consumer lifestyles. Innovation in silk blends, textile technologies, and product applications is expected to drive product differentiation, market competitiveness, and consumer interest in silk products.
The adoption of digital technologies, e-commerce platforms, and online retailing channels is likely to reshape the silk market landscape, enabling market players to reach a wider audience and enhance customer engagement.
Silk is often associated with luxury due to its softness, luster, and durability. The demand for luxury fabrics like silk is expected to increase, as disposable incomes rise globally, especially in emerging economies.
Silk production involves labor intensive processes, including silkworm rearing, cocoon harvesting, and silk extraction. High production costs, including labor costs, feed costs, and energy expenses, can impact the profitability of silk farming and manufacturing operations.
The below table showcases revenues in terms of the top 5 leading countries, spearheaded by Korea and Japan. The countries are expected to lead the market through 2035.
| Countries | Forecast CAGRs from 2025 to 2035 |
|---|---|
| The United States | 8.5% |
| China | 9.0% |
| The United Kingdom | 9.2% |
| Japan | 9.4% |
| Korea | 9.5% |
The silk market in the United States expected to expand at a CAGR of 8.5% through 2035. The country has a large consumer base with a growing appreciation for luxury textiles.
Silk is often perceived as a premium fabric associated with elegance and sophistication, making it desirable among consumers seeking high quality clothing, accessories, and home furnishings.
The fashion industry in the United States sets global trends and drives demand for premium textiles, including silk. American designers and fashion houses frequently incorporate silk fabrics into their collections, contributing to the popularity of silk garments and accessories among consumers in the market.
The silk market in the United Kingdom is anticipated to expand at a CAGR of 9.2% through 2035. There is a growing trend towards sustainability and ethical fashion in the country, driven by consumer demand for environmentally friendly and socially responsible products.
Sustainable silk production methods, such as organic silk farming and cruelty free silk harvesting, align with the values of environmentally conscious consumers and contribute to the growth of the silk market.
The United Kingdom has a well-developed e-commerce infrastructure and a growing online retail market. E-commerce platforms and digital marketplaces offer a convenient and accessible channel for British consumers to purchase silk products from domestic and international brands, driving growth in the online silk market.
Silk trends in China are taking a turn for the better. A 9.0% CAGR is forecast for the country from 2025 to 2035. The country has a long standing tradition of silk production, dating back to ancient times.
Silk weaving techniques and craftsmanship have been passed down through generations, contributing to the preservation and promotion of traditional silk making skills and heritage practices. The appreciation for rich history and cultural significance of silk enhances its desirability and market appeal in China.
The rapid economic growth and rising affluence of China have led to increased consumer spending power and a growing demand for luxury goods and premium textiles. Chinese consumers have greater purchasing power to invest in high quality silk products for clothing, home furnishings, and gift giving purposes, as disposable incomes rise.
The silk market in Japan is poised to expand at a CAGR of 9.4% through 2035. The country is renowned for its high quality silk products, including kimono fabrics, obi sashes, and traditional textiles.
Japanese silk is prized for its softness, luster, and superior craftsmanship, making it highly desirable among domestic consumers and international markets seeking premium silk products.
Japan has a strong tradition of craftsmanship and artisanal skills, which are applied to the production of silk textiles and garments. Traditional silk weaving, dyeing, and embroidery techniques are passed down through generations, preserving cultural heritage and promoting the artistry of Japanese silk craftsmanship.
The silk market in Korea is anticipated to expand at a CAGR of 9.5% through 2035. Rich cultural heritage and tourist attractions in the country, including silk museums, traditional villages, and cultural festivals, attract visitors from around the world who seek immersive experiences and authentic encounters with Korean culture.
Tourism related activities and souvenir purchases contribute to the demand for silk products and support the growth of the silk market in the country. Korean manufacturers are known for their innovation in textile blending and product development.
They create fabrics with enhanced properties such as stretch, durability, or moisture wicking capabilities, by blending silk with other fibers such as cotton, polyester, or spandex. The innovative silk blends cater to diverse consumer needs and expand the application scope of silk in various industries including fashion, sportswear, and technical textiles.
The below table highlights how eri silk segment is projected to lead the market in terms of type, and is expected to account for a CAGR of 8.2% through 2035. Based on end user, the textile segment is expected to account for a CAGR of 8.0% through 2035.
| Category | CAGR through 2035 |
|---|---|
| Eri Silk | 8.2% |
| Textile | 8.0% |
Based on type, the eri silk segment is expected to continue dominating the silk market. Increasing concerns about animal welfare and cruelty free production practices have prompted consumers to seek alternatives to conventional silk that involve the killing of silkworms during the harvesting process
. Eri silk, which allows the silkworms to live out their natural life cycle, appeals to consumers who prioritize ethical and humane treatment of animals.
Eri silk possesses unique characteristics and qualities that differentiate it from other types of silk. It is known for its softness, warmth, and durability, making it suitable for a wide range of textile applications including clothing, accessories, home furnishings, and upholstery. The distinctive texture and natural color variations of Eri silk add to its appeal among consumers and designers.
In terms of end user, the textile segment is expected to continue dominating the silk market. Silk has long been associated with luxury, elegance, and prestige in the textile industry.
The textile segment, including luxury fashion houses, designer brands, and high end retailers, drives the demand for silk fabrics and garments due to their inherent qualities such as softness, luster, and drapability.
The textile segment drives demand for silk fabrics and garments by shaping fashion and design trends in the global marketplace.
Fashion designers, trend forecasters, and textile experts influence consumer preferences and purchasing decisions through runway shows, fashion collections, and design collaborations that showcase silk as a desirable and fashionable material.

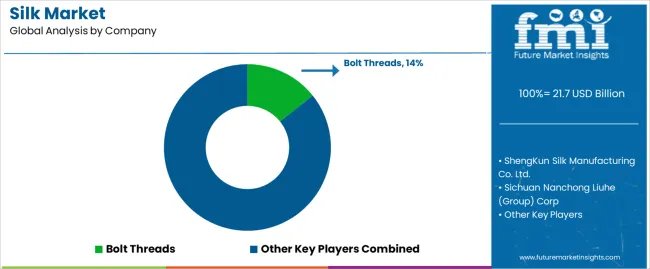
The competitive landscape of the silk market is characterized by a diverse range of players operating across the silk value chain, including silk producers, manufacturers, distributors, and retailers. The players compete based on factors such as product quality, innovation, pricing, distribution channels, and brand reputation.
Company Portfolio
| Attribute | Details |
|---|---|
| Estimated Market Size in 2025 | USD 20.0 billion |
| Projected Market Valuation in 2035 | USD 44.6 billion |
| Value-based CAGR 2025 to 2035 | 8.4% |
| Forecast Period | 2025 to 2035 |
| Historical Data Available for | 2020 to 2025 |
| Market Analysis | Value in USD billion |
| Key Regions Covered | North America; Latin America; Western Europe; Eastern Europe; South Asia and Pacific; East Asia; The Middle East & Africa |
| Key Market Segments Covered | Type, End User, Region |
| Key Countries Profiled | The United States, Canada, Brazil, Mexico, Germany, France, France, Spain, Italy, Russia, Poland, Czech Republic, Romania, India, Bangladesh, Australia, New Zealand, China, Japan, South Korea, GCC countries, South Africa, Israel |
| Key Companies Profiled | Bolt Threads; ShengKun Silk Manufacturing Co. Ltd.; Sichuan Nanchong Liuhe (Group) Corp; Anhui Silk Co. Ltd; Zhejiang Jiaxin Silk Co., Ltd; Wujiang First Textile Co., Ltd.; Wujiang Wanshiyi Silk Co. Ltd.; Jiangsu Sutong Cocoon And Silk Co; Amsilk GmbH; Libas Textiles Ltd. |
The global silk market is estimated to be valued at USD 21.7 billion in 2025.
The market size for the silk market is projected to reach USD 48.6 billion by 2035.
The silk market is expected to grow at a 8.4% CAGR between 2025 and 2035.
The key product types in silk market are mulberry silk, eri silk, tussar silk and others.
In terms of end user, textile segment to command 67.4% share in the silk market in 2025.


Our Research Products

The "Full Research Suite" delivers actionable market intel, deep dives on markets or technologies, so clients act faster, cut risk, and unlock growth.

The Leaderboard benchmarks and ranks top vendors, classifying them as Established Leaders, Leading Challengers, or Disruptors & Challengers.

Locates where complements amplify value and substitutes erode it, forecasting net impact by horizon

We deliver granular, decision-grade intel: market sizing, 5-year forecasts, pricing, adoption, usage, revenue, and operational KPIs—plus competitor tracking, regulation, and value chains—across 60 countries broadly.

Spot the shifts before they hit your P&L. We track inflection points, adoption curves, pricing moves, and ecosystem plays to show where demand is heading, why it is changing, and what to do next across high-growth markets and disruptive tech

Real-time reads of user behavior. We track shifting priorities, perceptions of today’s and next-gen services, and provider experience, then pace how fast tech moves from trial to adoption, blending buyer, consumer, and channel inputs with social signals (#WhySwitch, #UX).

Partner with our analyst team to build a custom report designed around your business priorities. From analysing market trends to assessing competitors or crafting bespoke datasets, we tailor insights to your needs.
Supplier Intelligence
Discovery & Profiling
Capacity & Footprint
Performance & Risk
Compliance & Governance
Commercial Readiness
Who Supplies Whom
Scorecards & Shortlists
Playbooks & Docs
Category Intelligence
Definition & Scope
Demand & Use Cases
Cost Drivers
Market Structure
Supply Chain Map
Trade & Policy
Operating Norms
Deliverables
Buyer Intelligence
Account Basics
Spend & Scope
Procurement Model
Vendor Requirements
Terms & Policies
Entry Strategy
Pain Points & Triggers
Outputs
Pricing Analysis
Benchmarks
Trends
Should-Cost
Indexation
Landed Cost
Commercial Terms
Deliverables
Brand Analysis
Positioning & Value Prop
Share & Presence
Customer Evidence
Go-to-Market
Digital & Reputation
Compliance & Trust
KPIs & Gaps
Outputs
Full Research Suite comprises of:
Market outlook & trends analysis
Interviews & case studies
Strategic recommendations
Vendor profiles & capabilities analysis
5-year forecasts
8 regions and 60+ country-level data splits
Market segment data splits
12 months of continuous data updates
DELIVERED AS:
PDF EXCEL ONLINE
Silky Matte Film Market Size and Share Forecast Outlook 2025 to 2035
Silk Laminated Paper Market Analysis - Size, Share, and Forecast Outlook 2025 to 2035
Silk Protein Market Analysis - Sericin & Fibroin Forecast 2024-2034
Spider Silk Fibers Market Size and Share Forecast Outlook 2025 to 2035
Spider Silk Fabric Market Size and Share Forecast Outlook 2025 to 2035
Mimetic Silk Protein Formulas Market Size and Share Forecast Outlook 2025 to 2035
Hydrolyzed Silk Proteins Market Analysis - Size, Share, and Forecast Outlook 2025 to 2035
Synthetic Spider Silk Proteins Market Analysis - Size, Share, and Forecast Outlook 2025 to 2035

Thank you!
You will receive an email from our Business Development Manager. Please be sure to check your SPAM/JUNK folder too.
Chat With
MaRIA