Silky Matte Film Market
Silky Matte Film Market By Material (PP, PVC, BOPP, and BOPET), By Product Type (Laminated, and Non-Laminated), By End Use (Food & Beverage, Packaging, Automobile, Pharmaceutical, Printing, Textile, Electrical & Electronics, and Personal Care & Cosmetics) & Regional Forecast till 2033
FMI Digs Deep into the Increasing Number of Printing, Food Packaging and Luxury Packaging Driving the Growth of the Silky Matte Film Market. Read the Report to Find Investment Opportunities in the Industry
Silky Matte Film Market Outlook
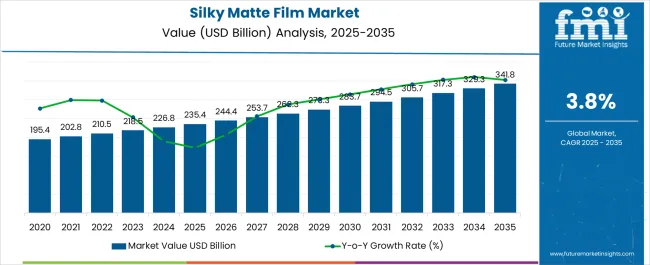
The silky matte film market size is projected to be worth US$ 218.5 million in 2023. The market is likely to surpass US$ 317.3 million by 2033 at a CAGR of 3.8% during the forecast period. The silky matte film has outstanding scuff resistance and bind strength with paper and various flexible packaging laminates. It is suitable for use in post-lamination processes such as foil stamping and UV spot coating. It also has a high transmittance, which improves reverse printability. Due to its excellent frictional qualities, its package has superior shelf stability. The film has an extrusion-coated surface with low temperature melting resin, allowing for heat and pressure lamination of the film to paper products. BOPP silky matte film creates a luxurious appearance and enhances the looks of books cover, food packaging, cosmetics packaging and other printed material.
Drivers Propelling the Demand for Silky Matte Film include:
- The growing adoption of matte film in paper printing, visiting cards, commercial posters driving the market growth
- The material used for manufacturing silky matte film is non-toxic, and it preserves image color, which keeps the packaging of products fresh for a longer period. Thus, the sales of the product are increasing with time.
- The increasing demand for luxury packaging and the demand for eco-friendly packaging solutions with matte finished silky film material driving the market growth.
- This film provides cosmetic tangible and excellent scratch and scuff resistance & applied as wet wipes bags, liquor boxes, and corporate brochures which increasing the market demand.
Challenges for Companies /Manufacturers in the Silky Matte Film Market:
- The increasing plastic pollution throughout the world, the scope of plastic-based matte film will be reduced, slowing the growth rate of the silky matte films market.
- The high raw material price and supply chain will also function as market restraints, further challenging the silky matte film market's growth rate.
Opportunities in the Silky Matte Film Industry:
- The rise in demand for silky matte films in the graphics and printing industry is expanding the business of major players in the market. The silky matte films are used in various applications such as book covers, posters, etc. which can boost the growth of new entrants in the market.
- Industry dynamic developments, such as the implementation of new regulatory efforts, have compelled manufacturers to develop innovative packaging solutions.
- Increasing concern about the usage of biodegradable matte film and its influence on the environment have also prompted filmmakers to seek environmentally safe and secure alternatives.
- The increased number of strategic agreements and rising new markets will also increase the market's profitable potential.
- The demand for silky matte films is growing in various regions globally, and expansion in the operation of companies in the emerging market can drive the growth of companies.
Latest Trends in the Silky Matte Film Market:
- The companies are focusing on increasing the sustainability of products, which can reduce the impact of the environment on the product.
- The trend of customization and personalization is boosting the growth. Consumers are demanding customized packaging for their products.
- The rise in the e-commerce sector is increasing the demand for silky matte films, due to rise in packaging industry.
Attribute | Details |
---|---|
Silky Matte film Market Size (2023) | US$ 218.5 million |
Silky Matte film Market Projected Size (2033) | US$ 317.3 million |
Value CAGR (2023 to 2033) | 3.8% |
Don't pay for what you don't need
Customize your report by selecting specific countries or regions and save 30%!
2018 to 2022 Silky Matte Film Demand Outlook Compared to 2023 to 2033 Forecast
From 2018 to 2022, the global silky matte film market experienced a CAGR of 2.8%, reaching a market size of US$ 210.5 million in 2022.
Concerns have been raised regarding the propensity of plastic matte films to promote the flow of vapors and gases, which can degrade the consistency of novel coatings and barrier films addressing the health of packaging goods. Matte films, for example, are increasingly used in digital packaging to improve the shelf-life of the product and provide a clear indicator of its quality and status.
From 2018 to 2022, with the rise in number of applications of the product in various industry, the market growth can be seen. Also, with the eco-friendly properties of silky matte films, the demand in e-commerce sector is increasing.
Future Forecast for Silky Matte Film Industry
Looking ahead, the global silky matte film industry is expected to rise at a CAGR of 3.8% from 2023 to 2033. During the forecast period, the market size is expected to reach US$ 317.3 million.
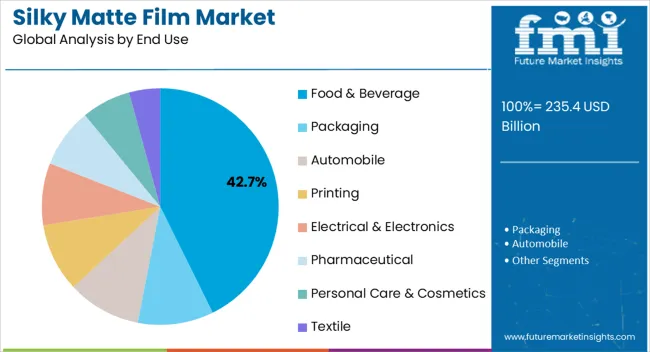
End Use industries such as food & beverage, personal care, pharmaceuticals, automotive and other end use industries are increasing adopting the silky matte film. The current growth of e-commerce sector is boosting the market, which indirectly boost the growth of market in emerging economies. North America region is expected to dominate the market. The strong presence of key players in North America is boosting the market growth.
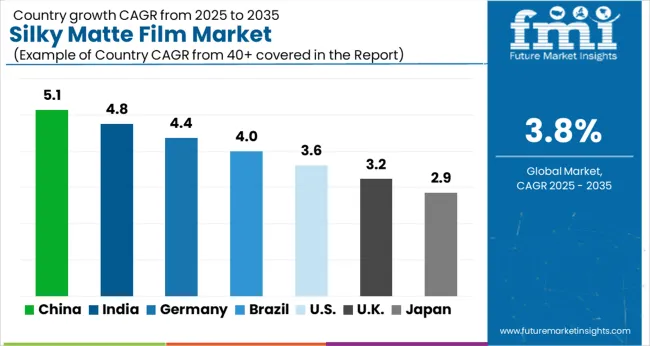
Comparative View of the Silky Matte Film Market
Silky Matte Film Market:
Attributes | Silky Matte Film Market |
---|---|
CAGR (2023 to 2033) | 3.8% |
Market Value (2033) | US$ 317.3 million |
Opportunity | The rise in demand for silky matte films in the graphics and printing industry is expanding the business of major players in the market. |
Key Trends | The trend of customization and personalization is boosting the growth. Consumers are demanding customized packaging for their products. |
Bundling Film Market:
Attributes | Bundling Film Market |
---|---|
CAGR (2023 to 2033) | 4.9% |
Market Value (2033) | US$ 22 billion |
Opportunity | The increasing demand for bundling film goods from various industries such as food and drinks, chemicals, and pharmaceuticals is also a major opportunity for the market. |
Key Trends | Biodegradable materials have developed as a market trend, allowing the shrink bundling film industry to devise effective tactics and identify the target market. |
Country-Wise Insights
Silky Matte Film Market to Surge in Unites States Amid the Rising Key Players.
Country | United States |
---|---|
Market Size (US$ million) by End of Forecast Period (2033) | US$ 46.8 million |
CAGR % 2023 to End of Forecast (2033) | 3.3% |
The silky matte film industry in the United States is expected to reach a market share of US$ 43.8 billion by 2033, expanding at a CAGR of 3.3%. The rise of the packaging sector and consumption of packaged foods is driving the growth of United States market. This increase can be attributed to the rising use of these films in surface coatings to prevent photocopying across the United States. Nowadays, some companies in the United States use film as a security printing medium on top of official papers such as passports and driver's licenses, which aids in the prevention of counterfeiting and duplication.
Get the data you need at a Fraction of the cost
Personalize your report by choosing insights you need
and save 40%!
Category-Wise Insights
Which Material Type Segment to Dominate Silky Matte Film Industry?
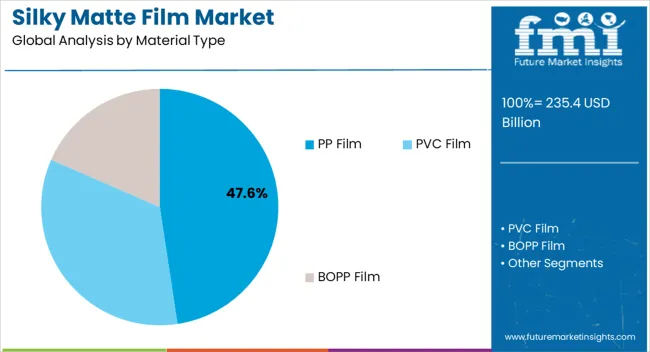
The BOPP segment is expected to dominate the silky matte film industry with a CAGR of 3.1% from 2022 to 2033. BOPP silky matte film has a surface and hot melt adhesive layer by extrusion coating. These films have some luxurious features such as excellent resistance to tear and elongation, matte surface suitable UV spot varnishing foil stamping which is useful for any type of packaging.
How the Laminated Segment Driving the Silky Matte Film Market?
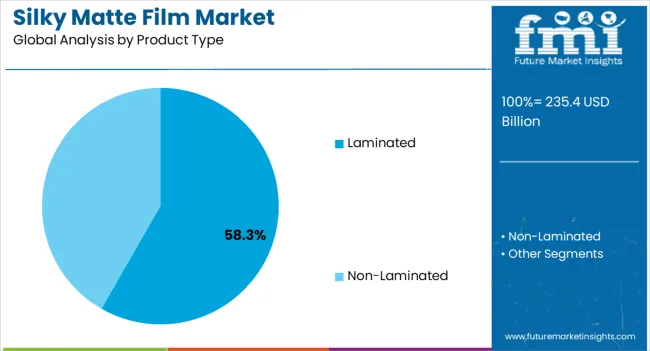
The laminated segment is expected to dominate the silky matte film industry with a CAGR of 4.0% from 2022 to 2033. Laminated silky matte film conceals tiny flaws in packaging materials and adds a tactile sense to the box, making it more appealing to touch and hold. Matte lamination lowers glare and reflection, making it excellent for materials that will be viewed under bright lighting or in direct sunlight.
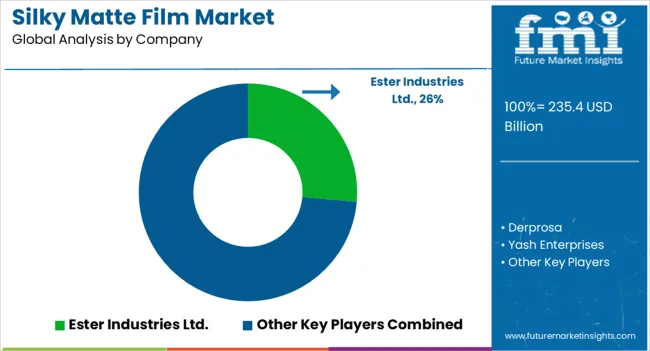
How Key Players Stay Competitive in the Silky Matte Film Industry?
The silky matte film industry is highly competitive, with new entrants trying to gain market share. The major key players are focusing on research and development which can help to keep them updated with latest technologies and trends.
Key Strategies Adopted by the Players:
- Strategic Partnerships and Collaborations
The new entrants are collaborating to gain competitive advantage, and gain access to latest technologies. The major key players are adopting these strategies to enter new markets.
- Increasing Product Efficiency and Accuracy
The major key players are focusing on product innovations, and develop market opportunities. This can eventually increase the adoption rate of the silky matte film.
- Expansion into Emerging Markets
The major key players are investing and expanding their channels into the emerging economies which can help them gain market position. And will help them to increase their customer base. The companies are also investing in research and development to increase the application of product in different industries.
Key Players in the Silky Matte Film Industry
- Ester Industries Ltd.
- Derprosa
- Yash Enterprises
- Waterfall LLC
- Sol Control
- R.P.C Associates
- S-one labels & Packaging
- Namo Packaging Solution Pvt. Ltd
- Henan Foils
- Kingchuan Packaging
- Kshatriya Impex Private Limited
- Shanghai CN Industries ltd
- KDX Composite Material Co.,Ltd.
- KDX America
- Zhejiang Yiya New Materials Co.,Ltd.
- Pragati Corpotration
Segmentation Analysis of the Silky Matte Film Market
By Material Type:
- PP Film
- PVC Film
- BOPP Film
By Product Type:
- Laminated
- Non-Laminated
By End Use:
- Food & Beverage
- Packaging
- Automobile
- Printing
- Electrical & Electronics
- Pharmaceutical
- Personal Care & Cosmetics
- Textile
By Region:
- North America
- Latin America
- East Asia
- South Asia & Pacific
- Western Europe
- Eastern Europe
- Central Asia
- Russia & Belarus
- Balkan & Baltic Countries
- Middle East and Africa (MEA)
Frequently Asked Questions
What is the Market's Potential for Growth?
The market is expected to thrive at a 3.8% CAGR through 2033.
What is the Current Silky Matte Film Market Value?
In 2023, the market is predicted to be worth US$ 218.5 million.
What is the Estimated Market Size by 2033?
By 2033, the market is estimated to attain US$ 317.3 million.
How Did the Market Perform from 2018 to 2022?
The market evolved at a 2.8% CAGR between 2018 and 2022.
Which Material Type is Ideal for Market?
With a CAGR of 3.1%, the BOPP category is predicted to dominate the industry.
What is the Future Outlook of the United States Market?
The silky matte film industry in the United States is poised to expand at a 3.3% CAGR.
Table of Content
1. Executive Summary 1.1. Global Market Outlook 1.2. Market Analysis 1.3. Analysis and Recommendations 2. Market Overview 2.1. Market Coverage / Taxonomy 2.2. Market Definition / Scope / Limitations 3. Key Market Trends 3.1. Key Trends Impacting the Market 3.2. Sustainable Trends 3.3. Technological Trends 3.4. Product Innovation / Development Trends 4. Key Success Factors 4.1. Product Adoption / Usage Analysis 4.2. Product USPs / Features 4.3. Strategic Promotional Strategies 4.4. Go-to-market Strategies 5. Global Market Demand Analysis 2018 to 2022 and Forecast, 2023 to 2033 5.1. Historical Market Volume (Tons) Analysis, 2018 to 2022 5.2. Current and Future Market Volume (Tons) Projections, 2023 to 2033 5.3. Y-o-Y Growth Trend Analysis 6. Global Market - Pricing Analysis 6.1. Regional Pricing Analysis 6.2. Global Average Pricing Analysis Benchmark 7. Global Market Demand (in Value or Size in US$ Million) Analysis 2018 to 2022 and Forecast, 2023 to 2033 7.1. Historical Market Value (US$ Million) Analysis, 2018 to 2022 7.2. Current and Future Market Value (US$ Million) Projections, 2023 to 2033 7.2.1. Y-o-Y Growth Trend Analysis 7.2.2. Absolute $ Opportunity Analysis 8. Market Background 8.1. Global Market Overview 8.2. Forecast Factors - Relevance & Impact 8.3. Value Chain Analysis & Profitability Margin 8.3.1. Exhaustive List of Raw Suppliers 8.3.2. Exhaustive List of Manufacturers/Converters/Distributors 8.3.3. Exhaustive List of Brand Owners/ Customer Base 8.4. Case-based Scenario – Impact Assessment 8.4.1. Current Statistics 8.4.2. Short-Mid-Long Term Outlook 8.4.3. Likely Rebound 8.5. Market Dynamics 8.5.1. Drivers 8.5.2. Restraints 8.5.3. Opportunity Analysis 8.6. Supply Demand Analysis 8.6.1. Import /Export Analysis 9. Global Market Analysis 2018 to 2022 and Forecast 2023 to 2033, By Product Type 9.1. Introduction/Key Findings 9.2. Historical Market Size (US$ Million) and Volume (Tons) Analysis By Packaging Format, 2018 to 2022 9.3. Current and Future Market Size (US$ Million) and Volume (Tons) Analysis and Forecast By Packaging Format, 2023 to 2033 9.3.1. Laminated 9.3.2. Non-Laminated 9.4. Market Attractiveness Analysis By Product Type 10. Global Market Analysis 2018 to 2022 and Forecast 2023 to 2033, By Material Type 10.1. Introduction / Key Findings 10.2. Historical Market Size (US$ Million) and Volume (Tons) Analysis By Material Type, 2018 to 2022 10.3. Current and Future Market Size (US$ Million) and Volume (Tons) Analysis and Forecast By Material Type, 2023 to 2033 10.3.1. PP Films 10.3.2. PVC Films 10.3.3. BOPP Films 10.4. Market Attractiveness Analysis By Material Type 11. Global Market Analysis 2018 to 2022 and Forecast 2023 to 2033, By End Use 11.1. Introduction / Key Findings 11.2. Historical Market Size (US$ Million) and Volume (Tons) Analysis By End Use, 2018 to 2022 11.3. Current and Future Market Size (US$ Million) and Volume (Tons) Analysis and Forecast By End Use, 2023 to 2033 11.3.1. Food & Beverages 11.3.2. Packaging 11.3.3. Automobile 11.3.4. Printing 11.3.5. Electrical & Electronics 11.3.6. Pharmaceutical 11.3.7. Cosmetics & Personal Care 11.3.8. Textiles 11.4. Market Attractiveness Analysis By End Use 12. Global Market Analysis 2018 to 2022 and Forecast 2023 to 2033, By Region 12.1. Introduction / Key Findings 12.2. Historical Market Size (US$ Million) and Volume (Tons) Analysis By Region, 2018 to 2022 12.3. Current and Future Market Size (US$ Million) and Volume (Tons) Analysis and Forecast By Region, 2023 to 2033 12.3.1. North America 12.3.2. Latin America 12.3.3. East Asia 12.3.4. South Asia & Pacific 12.3.5. Western Europe 12.3.6. Eastern Europe 12.3.7. Central Asia 12.3.8. Russia & Belarus 12.3.9. Balkan & Baltic Countries 12.3.10. Middle East and Africa (MEA) 12.4. Market Attractiveness Analysis By Region 13. North America Market Analysis 2018 to 2022 and Forecast 2023 to 2033 13.1. Introduction / Key Findings 13.2. Historical Market Size (US$ Million) and Volume (Tons) Analysis by Market Taxonomy, 2018 to 2022 13.3. Current Market Size (US$ Million) and Volume (Tons) Analysis and Forecast by Market Taxonomy, 2023 to 2033 13.3.1. By Country 13.3.1.1. USA 13.3.1.2. Canada 13.3.2. By Product Type 13.3.3. By Material Type 13.3.4. By End Use 13.4. Market Attractiveness Analysis 13.4.1. By Country 13.4.2. By Product Type 13.4.3. By Material Type 13.4.4. By End Use 14. Latin America Market Analysis 2018 to 2022 and Forecast 2023 to 2033 14.1. Introduction / Key Findings 14.2. Historical Market Size (US$ Million) and Volume (Tons) Analysis by Market Taxonomy, 2018 to 2022 14.3. Current Market Size (US$ Million) and Volume (Tons) Analysis and Forecast by Market Taxonomy, 2023 to 2033 14.3.1. By Country 14.3.1.1. Brazil 14.3.1.2. Mexico 14.3.1.3. Argentina 14.3.1.4. Rest of Latin America 14.3.2. By Product Type 14.3.3. By Material Type 14.3.4. By End Use 14.4. Market Attractiveness Analysis 14.4.1. By Country 14.4.2. By Product Type 14.4.3. By Material Type 14.4.4. By End Use 15. East Asia Market Analysis 2018 to 2022 and Forecast 2023 to 2033 15.1. Introduction / Key Findings 15.2. Historical Market Size (US$ Million) and Volume (Tons) Analysis by Market Taxonomy, 2018 to 2022 15.3. Current Market Size (US$ Million) and Volume (Tons) Analysis and Forecast by Market Taxonomy, 2023 to 2033 15.3.1. By Country 15.3.1.1. China 15.3.1.2. Japan 15.3.1.3. South Korea 15.3.2. By Product Type 15.3.3. By Material Type 15.3.4. By End Use 15.4. Market Attractiveness Analysis 15.4.1. By Country 15.4.2. By Product Type 15.4.3. By Material Type 15.4.4. By End Use 16. South Asia & Pacific Market Analysis 2018 to 2022 and Forecast 2023 to 2033 16.1. Introduction / Key Findings 16.2. Historical Market Size (US$ Million) and Volume (Tons) Analysis by Market Taxonomy, 2018 to 2022 16.3. Current Market Size (US$ Million) and Volume (Tons) Analysis and Forecast by Market Taxonomy, 2023 to 2033 16.3.1. By Country 16.3.1.1. India 16.3.1.2. ASEAN 16.3.1.3. Australia & New Zealand 16.3.2. By Product Type 16.3.3. By Material Type 16.3.4. By End Use 16.4. Market Attractiveness Analysis 16.4.1. By Country 16.4.2. By Product Type 16.4.3. By Material Type 16.4.4. By End Use 17. Western Europe Market Analysis 2018 to 2022 and Forecast 2023 to 2033 17.1. Introduction / Key Findings 17.2. Historical Market Size (US$ million) and Volume (Tons) Analysis by Market Taxonomy, 2018 to 2022 17.3. Current Market Size (US$ million) and Volume (Tons) Analysis and Forecast by Market Taxonomy, 2023 to 2033 17.3.1. By Country 17.3.1.1. Germany 17.3.1.2. France 17.3.1.3. Spain 17.3.1.4. Italy 17.3.1.5. United Kingdom 17.3.1.6. BENELUX 17.3.1.7. Nordics 17.3.1.8. Rest of Western Europe 17.3.2. By Product Type 17.3.3. By Material Type 17.3.4. By End Use 17.4. Market Attractiveness Analysis 17.4.1. By Country 17.4.2. By Product Type 17.4.3. By Material Type 17.4.4. By End Use 18. Eastern Europe Market Analysis 2018 to 2022 and Forecast 2023 to 2033 18.1. Introduction / Key Findings 18.2. Historical Market Size (US$ million) and Volume (Tons) Analysis by Market Taxonomy, 2018 to 2022 18.3. Current Market Size (US$ million) and Volume (Tons) Analysis and Forecast by Market Taxonomy, 2023 to 2033 18.3.1. By Country 18.3.1.1. Poland 18.3.1.2. Hungary 18.3.1.3. Austria 18.3.1.4. Czech Republic 18.3.1.5. Rest of Eastern Europe 18.3.2. By Product Type 18.3.3. By Material Type 18.3.4. By End Use 18.4. Market Attractiveness Analysis 18.4.1. By Country 18.4.2. By Product Type 18.4.3. By Material Type 18.4.4. By End Use 19. Central Asia Market Analysis 2018 to 2022 and Forecast 2023 to 2033 19.1. Introduction / Key Findings 19.2. Historical Market Size (US$ million) and Volume (Tons) Analysis by Market Taxonomy, 2018 to 2022 19.3. Current Market Size (US$ million) and Volume (Tons) Analysis and Forecast by Market Taxonomy, 2023 to 2033 19.3.1. By Country 19.3.1.1. Kazakhstan 19.3.1.2. Kyrgyzstan 19.3.1.3. Tajikistan 19.3.1.4. Turkmenistan 19.3.1.5. Uzbekistan 19.3.2. By Product Type 19.3.3. By Material Type 19.3.4. By End Use 19.4. Market Attractiveness Analysis 19.4.1. By Country 19.4.2. By Product Type 19.4.3. By Material Type 19.4.4. By End Use 20. Russia & Belarus Market Analysis 2018 to 2022 and Forecast 2023 to 2033 20.1. Introduction / Key Findings 20.2. Historical Market Size (US$ million) and Volume (Tons) Analysis by Market Taxonomy, 2018 to 2022 20.3. Current Market Size (US$ million) and Volume (Tons) Analysis and Forecast by Market Taxonomy, 2023 to 2033 20.3.1. By Country 20.3.1.1. Russia 20.3.1.2. Belarus 20.3.2. By Product Type 20.3.3. By Material Type 20.3.4. By End Use 20.4. Market Attractiveness Analysis 20.4.1. By Country 20.4.2. By Product Type 20.4.3. By Material Type 20.4.4. By End Use 21. Balkan & Baltic Countries Market Analysis 2018 to 2022 and Forecast 2023 to 2033 21.1. Introduction / Key Findings 21.2. Historical Market Size (US$ million) and Volume (Tons) Analysis by Market Taxonomy, 2018 to 2022 21.3. Current Market Size (US$ million) and Volume (Tons) Analysis and Forecast by Market Taxonomy, 2023 to 2033 21.3.1. By Country 21.3.1.1. Romania 21.3.1.2. Greece 21.3.1.3. Bulgaria 21.3.2. By Product Type 21.3.3. By Material Type 21.3.4. By End Use 21.4. Market Attractiveness Analysis 21.4.1. By Country 21.4.2. By Product Type 21.4.3. By Material Type 21.4.4. By End Use 22. Middle East & Africa Market Analysis 2018 to 2022 and Forecast 2023 to 2033 22.1. Introduction / Key Findings 22.2. Historical Market Size (US$ million) and Volume (Tons) Analysis by Market Taxonomy, 2018 to 2022 22.3. Current Market Size (US$ million) and Volume (Tons) Analysis and Forecast by Market Taxonomy, 2023 to 2033 22.3.1. By Country 22.3.1.1. GCC Countries 22.3.1.2. Turkey 22.3.1.3. Northern Africa 22.3.1.4. South Africa 22.3.1.5. Israel 22.3.1.6. Saudi Arabia 22.3.2. By Product Type 22.3.3. By Material Type 22.3.4. By End Use 22.4. Market Attractiveness Analysis 22.4.1. By Country 22.4.2. By Product Type 22.4.3. By Material Type 22.4.4. By End Use 23. Country wise Market Analysis 2023 & 2033 23.1. USA Market Analysis 23.1.1. By Product Type 23.1.2. By Material Type 23.1.3. By End Use 23.2. Canada Market Analysis 23.2.1. By Product Type 23.2.2. By Material Type 23.2.3. By End Use 23.3. Brazil Market Analysis 23.3.1. By Product Type 23.3.2. By Material Type 23.3.3. By End Use 23.4. Mexico Market Analysis 23.4.1. By Product Type 23.4.2. By Material Type 23.4.3. By End Use 23.5. Germany Market Analysis 23.5.1. By Product Type 23.5.2. By Material Type 23.5.3. By End Use 23.6. UK Market Analysis 23.6.1. By Product Type 23.6.2. By Material Type 23.6.3. By End Use 23.7. Spain Market Analysis 23.7.1. By Product Type 23.7.2. By Material Type 23.7.3. By End Use 23.8. France Market Analysis 23.8.1. By Product Type 23.8.2. By Material Type 23.8.3. By End Use 23.9. Italy Market Analysis 23.9.1. By Product Type 23.9.2. By Material Type 23.9.3. By End Use 23.10. Russia Market Analysis 23.10.1. By Product Type 23.10.2. By Material Type 23.10.3. By End Use 23.11. China Market Analysis 23.11.1. By Product Type 23.11.2. By Material 23.11.3. By End Use 23.12. Japan Market Analysis 23.12.1. By Product Type 23.12.2. By Material Type 23.12.3. By End Use 24. Market Structure Analysis 24.1. Market Analysis by Tier of Companies 24.2. Market Share Analysis of Top Players 24.3. Market Presence Analysis 25. Competition Analysis 25.1. Competition Dashboard 25.2. Competition Benchmarking 25.3. Competition Deep Dive 25.3.1. Ester Industries Ltd. 25.3.1.1. Overview 25.3.1.2. Product Portfolio 25.3.1.3. Profitability by Market Segments (Material Type/Product Type/Region) 25.3.1.4. Sales Footprint 25.3.1.5. Strategy Overview 25.3.2. Derprosa 25.3.2.1. Overview 25.3.2.2. Product Portfolio 25.3.2.3. Profitability by Market Segments (Material Type/ Product Type /Region) 25.3.2.4. Sales Footprint 25.3.2.5. Strategy Overview 25.3.3. Yash Enterprises 25.3.3.1. Overview 25.3.3.2. Product Portfolio 25.3.3.3. Profitability by Market Segments (Material Type/ Product Type /Region) 25.3.3.4. Sales Footprint 25.3.3.5. Strategy Overview 25.3.4. Waterfall LLC 25.3.4.1. Overview 25.3.4.2. Product Portfolio 25.3.4.3. Profitability by Market Segments (Material Type/ Product Type /Region) 25.3.4.4. Sales Footprint 25.3.4.5. Strategy Overview 25.3.5. Sol Control 25.3.5.1. Overview 25.3.5.2. Product Portfolio 25.3.5.3. Profitability by Market Segments (Material Type/ Product Type /Region) 25.3.5.4. Sales Footprint 25.3.5.5. Strategy Overview 25.3.6. R.O.C Associates 25.3.6.1. Overview 25.3.6.2. Product Portfolio 25.3.6.3. Profitability by Market Segments (Material Type/ Product Type /Region) 25.3.6.4. Sales Footprint 25.3.6.5. Strategy Overview 25.3.7. S-One Labels & Packaging 25.3.7.1. Overview 25.3.7.2. Product Portfolio 25.3.7.3. Profitability by Market Segments (Material Type/ Product Type /Region) 25.3.7.4. Sales Footprint 25.3.7.5. Strategy Overview 25.3.8. Namo Packaging Solution Pvt Ltd 25.3.8.1. Overview 25.3.8.2. Product Portfolio 25.3.8.3. Profitability by Market Segments (Material Type/ Product Type /Region) 25.3.8.4. Sales Footprint 25.3.8.5. Strategy Overview 25.3.9. Henan Foils 25.3.9.1. Overview 25.3.9.2. Product Portfolio 25.3.9.3. Profitability by Market Segments (Material Type/ Product Type /Region) 25.3.9.4. Sales Footprint 25.3.9.5. Strategy Overview 25.3.10. Kingchuan Packaging 25.3.10.1. Overview 25.3.10.2. Product Portfolio 25.3.10.3. Profitability by Market Segments (Material Type/ Product Type /Region) 25.3.10.4. Sales Footprint 25.3.10.5. Strategy Overview 25.3.11. Kshatriya Impex Private Limited 25.3.11.1. Overview 25.3.11.2. Product Portfolio 25.3.11.3. Profitability by Market Segments (Material Type/ Product Type /Region) 25.3.11.4. Sales Footprint 25.3.11.5. Strategy Overview 25.3.12. Shanghai CN Industries Ltd 25.3.12.1. Overview 25.3.12.2. Product Portfolio 25.3.12.3. Profitability by Market Segments (Material Type/ Product Type /Region) 25.3.12.4. Sales Footprint 25.3.12.5. Strategy Overview 25.3.13. KDX Composite Material Co., ltd. 25.3.13.1. Overview 25.3.13.2. Product Portfolio 25.3.13.3. Profitability by Market Segments (Material Type/ Product Type /Region) 25.3.13.4. Sales Footprint 25.3.13.5. Strategy Overview 25.3.14. Shanghai CN Industries Ltd 25.3.14.1. Overview 25.3.14.2. Product Portfolio 25.3.14.3. Profitability by Market Segments (Material Type/ Product Type /Region) 25.3.14.4. Sales Footprint 25.3.14.5. Strategy Overview 25.3.15. Zhejiang Yiya New Materials Co.,Ltd. 25.3.15.1. Overview 25.3.15.2. Product Portfolio 25.3.15.3. Profitability by Market Segments (Material Type/ Product Type /Region) 25.3.15.4. Sales Footprint 25.3.15.5. Strategy Overview 25.3.16. Pragati Corporation 25.3.16.1. Overview 25.3.16.2. Product Portfolio 25.3.16.3. Profitability by Market Segments (Material Type/ Product Type /Region) 25.3.16.4. Sales Footprint 25.3.16.5. Strategy Overview 26. Assumptions and Acronyms Used 27. Research Methodology
Don't pay for what you don't need
Customize your report by selecting specific countries or regions and save 30%!
List of Tables
Table 01: Global Market Value (US$ Million) Analysis, By Product Type, 2018H to 2033F Table 02: Global Market Volume (Tonnes) Analysis, By Product Type, 2018H to 2033F Table 03: Global Market Value (US$ Million) Analysis, by Material Type, 2018H to 2033F Table 04: Global Market Volume (Tonnes) Analysis, by Material Type, 2018H to 2033F Table 05: Global Market Value (US$ Million) Analysis, by End Use, 2018H to 2033F Table 06: Global Market Volume (Tonnes) Analysis, by End Use, 2018H to 2033F Table 07: Global Market Value (US$ Million) Analysis, by Region, 2018H to 2033F Table 08: Global Market Volume (Tonnes) Analysis, by Region, 2018H to 2033F Table 09: North America Market Value (US$ Million) Analysis, By Product Type, 2018H to 2033F Table 10: North America Market Volume (Tonnes) Analysis, By Product Type, 2018H to 2033F Table 11: North America Market Value (US$ Million) Analysis, by Material Type, 2018H to 2033F Table 12: North America Market Volume (Tonnes) Analysis, by Material Type, 2018H to 2033F Table 13: North America Market Value (US$ Million) Analysis, by End Use, 2018H to 2033F Table 14: North America Market Volume (Tonnes) Analysis, by End Use, 2018H to 2033F Table 15: North America Market Value (US$ Million) Analysis, by Country, 2018H to 2033F Table 16: North America Market Volume (Tonnes) Analysis, by Country, 2018H to 2033F Table 17: Latin America Market Value (US$ Million) Analysis, By Product Type, 2018H to 2033F Table 18: Latin America Market \Volume (Tonnes) Analysis, By Product Type, 2018H to 2033F Table 19: Latin America Market Value (US$ Million) Analysis, by Material Type, 2018H to 2033F Table 20: Latin America Market Volume (Tonnes) Analysis, by Material Type, 2018H to 2033F Table 21: Latin America Market Value (US$ Million) Analysis, by End Use, 2018H to 2033F Table 22: Latin America Market Volume (Tonnes) Analysis, by End Use, 2018H to 2033F Table 23: Latin America Market Value (US$ Million) Analysis, by Country, 2018H to 2033F Table 24: Latin America Market Volume (Tonnes) Analysis, by Country, 2018H to 2033F Table 25: East Asia Market Value (US$ Million) Analysis, By Product Type, 2018H to 2033F Table 26: East Asia Market Volume (Tonnes) Analysis, By Product Type, 2018H to 2033F Table 27: East Asia Market Value (US$ Million) Analysis, by Material Type, 2018H to 2033F Table 28: East Asia Market Volume (Tonnes) Analysis, by Material Type, 2018H to 2033F Table 29: East Asia Market Value (US$ Million) Analysis, by End Use, 2018H to 2033F Table 30: East Asia Market Volume (Tonnes) Analysis, by End Use, 2018H to 2033F Table 31: East Asia Market Value (US$ Million) Analysis, by Country, 2018H to 2033F Table 32: East Asia Market Volume (Tonnes) Analysis, by Country, 2018H to 2033F Table 33: South Asia & Pacific Market Value (US$ Million) Analysis, By Product Type, 2018H to 2033F Table 34: South Asia & Pacific Market Volume (Tonnes) Analysis, By Product Type, 2018H to 2033F Table 35: South Asia & Pacific Market Value (US$ Million) Analysis, by Material Type, 2018H to 2033F Table 36: South Asia & Pacific Market Volume (Tonnes) Analysis, by Material Type, 2018H to 2033F Table 37: South Asia & Pacific Market Value (US$ Million) Analysis, by End Use, 2018H to 2033F Table 38: South Asia & Pacific Market Volume (Tonnes) Analysis, by End Use, 2018H to 2033F Table 39: South Asia & Pacific Market Value (US$ Million) Analysis, by Country, 2018H to 2033F Table 40: South Asia & Pacific Market Volume (Tonnes) Analysis, by Country, 2018H to 2033F Table 41: Western Europe Market Value (US$ Million) Analysis, By Product Type, 2018H to 2033F Table 42: Western Europe Market Volume (Tonnes) Analysis, By Product Type, 2018H to 2033F Table 43: Western Europe Market Value (US$ Million) Analysis, by Material Type, 2018H to 2033F Table 44: Western Europe Market Volume (Tonnes) Analysis, by Material Type, 2018H to 2033F Table 45: Western Europe Market Value (US$ Million) Analysis, by End Use, 2018H to 2033F Table 46: Western Europe Market Volume (Tonnes) Analysis, by End Use, 2018H to 2033F Table 47: Western Europe Market Value (US$ Million) Analysis, by Country, 2018H to 2033F Table 48: Western Europe Market Volume (Tonnes) Analysis, by Country, 2018H to 2033F Table 49: Eastern Europe Market Value (US$ Million) Analysis, By Product Type, 2018H to 2033F Table 50: Eastern Europe Market Volume (Tonnes) Analysis, By Product Type, 2018H to 2033F Table 51: Eastern Europe Market Value (US$ Million) Analysis, by Material Type, 2018H to 2033F Table 52: Eastern Europe Market Volume (Tonnes) Analysis, by Material Type, 2018H to 2033F Table 53: Eastern Europe Market Value (US$ Million) Analysis, by End Use, 2018H to 2033F Table 54: Eastern Europe Market Volume (Tonnes) Analysis, by End Use, 2018H to 2033F Table 55: Eastern Europe Market Value (US$ Million) Analysis, by Country, 2018H to 2033F Table 56: Eastern Europe Market Volume (Tonnes) Analysis, by Country, 2018H to 2033F Table 57: Central Asia Market Value (US$ Million) Analysis, By Product Type, 2018H to 2033F Table 58: Central Asia Market Volume (Tonnes) Analysis, By Product Type, 2018H to 2033F Table 59: Central Asia Market Value (US$ Million) Analysis, by Material Type, 2018H to 2033F Table 60: Central Asia Market Volume (Tonnes) Analysis, by Material Type, 2018H to 2033F Table 61: Central Asia Market Value (US$ Million) Analysis, by End Use, 2018H to 2033F Table 62: Central Asia Market Volume (Tonnes) Analysis, by End Use, 2018H to 2033F Table 63: Central Asia Market Value (US$ Million) Analysis, by Country, 2018H to 2033F Table 64: Central Asia Market Volume (Tonnes) Analysis, by Country, 2018H to 2033F Table 65: Russia & Belarus Market Value (US$ Million) Analysis, By Product Type, 2018H to 2033F Table 66: Russia & Belarus Market Volume (Tonnes) Analysis, By Product Type, 2018H to 2033F Table 67: Russia & Belarus Market Value (US$ Million) Analysis, by Material Type, 2018H to 2033F Table 68: Russia & Belarus Market Volume (Tonnes) Analysis, by Material Type, 2018H to 2033F Table 69: Russia & Belarus Market Value (US$ Million) Analysis, by End Use, 2018H to 2033F Table 70: Russia & Belarus Market Volume (Tonnes) Analysis, by End Use, 2018H to 2033F Table 71: Russia & Belarus Market Value (US$ Million) Analysis, by Country, 2018H to 2033F Table 72: Russia & Belarus Market Volume (Tonnes) Analysis, by Country, 2018H to 2033F Table 73: Balkan Countries Market Value (US$ Million) Analysis, By Product Type, 2018H to 2033F Table 74: Balkan Countries Market Volume (Tonnes) Analysis, By Product Type, 2018H to 2033F Table 75: Balkan Countries Market Value (US$ Million) Analysis, by Material Type, 2018H to 2033F Table 76: Balkan Countries Market Volume (Tonnes) Analysis, by Material Type, 2018H to 2033F Table 77: Balkan Countries Market Value (US$ Million) Analysis, by End Use, 2018H to 2033F Table 78: Balkan Countries Market Volume (Tonnes) Analysis, by End Use, 2018H to 2033F Table 79: Balkan Countries Market Value (US$ Million) Analysis, by Country, 2018H to 2033F Table 80: Balkan Countries Market Volume (Tonnes) Analysis, by Country, 2018H to 2033F Table 81: Baltic Countries Market Value (US$ Million) Analysis, By Product Type, 2018H to 2033F Table 82: Baltic Countries Market Volume (Tonnes) Analysis, By Product Type, 2018H to 2033F Table 83: Baltic Countries Market Value (US$ Million) Analysis, by Material Type, 2018H to 2033F Table 84: Baltic Countries Market Volume (Tonnes) Analysis, by Material Type, 2018H to 2033F Table 85: Baltic Countries Market Value (US$ Million) Analysis, by End Use, 2018H to 2033F Table 86: Baltic Countries Market Volume (Tonnes) Analysis, by End Use, 2018H to 2033F Table 87: Baltic Countries Market Value (US$ Million) Analysis, by Country, 2018H to 2033F Table 88: Baltic Countries Market Volume (Tonnes) Analysis, by Country, 2018H to 2033F Table 89: MEA Market Value (US$ Million) Analysis, By Product Type, 2018H to 2033F Table 90: MEA Market Volume (Tonnes) Analysis, By Product Type, 2018H to 2033F Table 91: MEA Market Value (US$ Million) Analysis, by Material Type, 2018H to 2033F Table 92: MEA Market Volume (Tonnes) Analysis, by Material Type, 2018H to 2033F Table 93: MEA Market Value (US$ Million) Analysis, by End Use, 2018H to 2033F Table 94: MEA Market Volume (Tonnes) Analysis, by End Use, 2018H to 2033F Table 95: MEA Market Value (US$ Million) Analysis, by Country, 2018H to 2033F Table 96: MEA Market Volume (Tonnes) Analysis, by Country, 2018H to 2033F
List of Charts
Figure 01: Global Market Share Analysis By Product Type, 2023E & 2033F Figure 02: Global Market Y-o-Y Analysis By Product Type, 2018H to 2033F Figure 03: Global Market Attractiveness Analysis By Product Type, 2023E to 2033F Figure 04: Global Market Share Analysis by Material Type,2023E & 2033F Figure 05: Global Market Y-o-Y Analysis by Material Type, 2018H to 2033F Figure 06: Global Market Attractiveness Analysis by Material Type, 2023E to 2033F Figure 07: Global Market Share Analysis by End Use, 2023E & 2033F Figure 08: Global Market Y-o-Y Analysis by End Use, 2018H to 2033F Figure 09: Global Market Attractiveness Analysis by End Use, 2023E to 2033F Figure 10: Global Market Share Analysis by Region 2023E & 2033F Figure 11: Global Market Y-o-Y Analysis by Region, 2018H to 2033F Figure 12: Global Market Attractiveness Analysis by Region, 2023E to 2033F Figure 13: North America Market Attractiveness Analysis by Material Type,2023E to 2033F Figure 14: North America Market Y-o-Y Analysis By Product Type, 2018H to 2033F Figure 15: North America Market Value Share Analysis by End Use 2023(E) Figure 16: North America Market Share Analysis by Country, 2023E & 2033F Figure 17: Latin America Market Attractiveness Analysis by Material Type, 2023E to 2033F Figure 18: Latin America Market Y-o-Y Analysis By Product Type, 2018H to 2033F Figure 19: Latin America Market Value Share Analysis by End Use 2023(E) Figure 20: Latin America Market Share Analysis by Country, 2023E & 2033F Figure 21: East Asia Market Attractiveness Analysis by Material Type, 2023E to 2033F Figure 22: East Asia Market Y-o-Y Analysis By Product Type, 2018H to 2033F Figure 23: East Asia Market Value Share Analysis by End Use 2023(E) Figure 24: East Asia Market Share Analysis by Country, 2023E & 2033F Figure 25: South Asia & Pacific Market Attractiveness Analysis by InsulationMaterial , 2023E to 2033F Figure 26: South Asia & Pacific Market Y-o-Y Analysis By Product Type, 2018H to 2033F Figure 27: South Asia & Pacific Market Value Share Analysis by End Use 2023(E) Figure 28: South Asia & Pacific Market Share Analysis by Country, 2023E & 2033F Figure 29: Western Europe Market Attractiveness Analysis by Insulation Material, 2023E to 2033F Figure 30: Western Europe Market Y-o-Y Analysis By Product Type, 2018H to 2033F Figure 31: Western Europe Market Value Share Analysis by End Use 2023(E) Figure 32: Western Europe Market Share Analysis by Country, 2023E & 2033F Figure 33: Eastern Europe Market Attractiveness Analysis by Material Type, 2023E to 2033F Figure 34: Eastern Europe Market Y-o-Y Analysis By Product Type, 2018H to 2033F Figure 35: Eastern Europe Market Value Share Analysis by End Use 2023(E) Figure 36: Eastern Europe Market Share Analysis by Country, 2023E & 2033F Figure 37: Central Asia Market Attractiveness Analysis by Material Type, 2023E to 2033F Figure 38: Central Asia Market Y-o-Y Analysis By Product Type, 2018H to 2033F Figure 39: Central Asia Market Value Share Analysis by End Use 2023(E) Figure 40: Central Asia Market Share Analysis by Country, 2023E & 2033F Figure 41: Russia & Belarus Market Attractiveness Analysis by Insulation Material, 2023E to 2033F Figure 42: Russia & Belarus Market Y-o-Y Analysis By Packaging Format, 2018H to 2033F Figure 43: Russia & Belarus Market Value Share Analysis by End Use 2023(E) Figure 44: Russia & Belarus Market Share Analysis by Country, 2023E & 2033F Figure 45: Balkan Countries Market Attractiveness Analysis by Insulation Material, 2023E to 2033F Figure 46: Balkan Countries Market Y-o-Y Analysis By Packaging Format,2018H to 2033F Figure 47: Balkan Countries Market Value Share Analysis by End Use 2023(E) Figure 48: Balkan Countries Market Share Analysis by Country, 2023E & 2033F Figure 49: Baltic Countries Market Attractiveness Analysis by Insulation Material, 2023E to 2033F Figure 50: Baltic Countries Market Y-o-Y Analysis By Packaging Format, 2018H to 2033F Figure 51: Baltic Countries Market Value Share Analysis by End Use 2023(E) Figure 52: Baltic Countries Market Share Analysis by Country, 2023E & 2033F Figure 53: MEA Market Attractiveness Analysis by Material Type, 2023E to 2033F Figure 54: MEA Market Y-o-Y Analysis By Product Type, 2018H to 2033F Figure 55: MEA Market Value Share Analysis by End Use 2023(E) Figure 56: MEA Market Share Analysis by Country, 2023E & 2033F Figure 57: USA Market Value Share Analysis, by Material Type, 2023E & 2033F Figure 58: USA Market Value Share Analysis, By Product Type, 2023E & 2033F Figure 59: USA Market Value Share Analysis, by End Use, 2023E & 2033F Figure 60: Canada Market Value Share Analysis, by Material Type, 2023E & 2033F Figure 61: Canada Market Value Share Analysis, By Product Type, 2023E & 2033F Figure 62: Canada Market Value Share Analysis, by End Use, 2023E & 2033F Figure 63: Brazil Market Value Share Analysis, by Material Type, 2023E & 2033F Figure 64: Brazil Market Value Share Analysis, By Product Type, 2023E & 2033F Figure 65: Brazil Market Value Share Analysis, by End Use, 2023E & 2033F Figure 66: Mexico Market Value Share Analysis, by Material Type, 2023E & 2033F Figure 67: Mexico Market Value Share Analysis, By Product Type, 2023E & 2033F Figure 68: Mexico Market Value Share Analysis, by End Use,2023E & 2033F Figure 69: Germany Market Value Share Analysis, by Material Type,2023E & 2033F Figure 70: Germany Market Value Share Analysis, By Product Type, 2023E & 2033F Figure 71: Germany Market Value Share Analysis, by End Use, 2023E & 2033F Figure 72: Italy Market Value Share Analysis, by Material Type, 2023E & 2033F Figure 73: Italy Market Value Share Analysis, By Product Type, 2023E & 2033F Figure 74: Italy Market Value Share Analysis, by End Use, 2023E & 2033F Figure 75: France Market Value Share Analysis, by Material Type,2023E & 2033F Figure 76: France Market Value Share Analysis, By Product Type,2023E & 2033F Figure 77: France Market Value Share Analysis, by End Use, 2023E & 2033F Figure 78: United Kingdom Market Value Share Analysis, by Material Type, 2023E & 2033F Figure 79: United Kingdom Market Value Share Analysis, By Packaging Format,2023E & 2033F Figure 80: United Kingdom Market Value Share Analysis, by End Use, 2023E & 2033F Figure 81: Spain Market Value Share Analysis, by Insulation Material, 2023E & 2033F Figure 82: Spain Market Value Share Analysis, By Packaging Format,2023E & 2033F Figure 83: Spain Market Value Share Analysis, by End Use, 2023E & 2033F Figure 84: Russia Market Value Share Analysis, by Insulation Material, 2023E & 2033F Figure 85: Russia Market Value Share Analysis, By Packaging Format, 2023E & 2033F Figure 86: Russia Market Value Share Analysis, by End Use, 2023E & 2033F Figure 87: GCC Market Value Share Analysis, by Insulation Material, 2023E & 2033F Figure 88: GCC Market Value Share Analysis, By Packaging Format, 2023E & 2033F Figure 89: GCC Market Value Share Analysis, by End Use, 2023E & 2033F Figure 90: South Africa Market Value Share Analysis, by Insulation Material,2023E & 2033F Figure 91: South Africa Market Value Share Analysis, By Packaging Format, 2023E & 2033F Figure 92: South Africa Market Value Share Analysis, by End Use, 2023E & 2033F Figure 93: Japan Market Value Share Analysis, by Insulation Material, 2023E & 2033F Figure 94: Japan Market Value Share Analysis, By Packaging Format, 2023E & 2033F Figure 95: Japan Market Value Share Analysis, by End Use, 2023E & 2033F Figure 96: India Market Value Share Analysis, by Material Type, 2023E & 2033F Figure 97: India Market Value Share Analysis, By Product Type, 2023E & 2033F Figure 98: India Market Value Share Analysis, by End Use, 2023E & 2033F Figure 98: China Market Value Share Analysis, by Material Type, 2023E & 2033F Figure 99: China Market Value Share Analysis, By Product Type, 2023E & 2033F Figure 100: China Market Value Share Analysis, by End Use, 2023E & 2033F Figure 101: Australia Market Value Share Analysis, by Insulation Material, 2023E & 2033F Figure 102: Australia Market Value Share Analysis, By Product Type, 2023E & 2033F Figure 103: Australia Market Value Share Analysis, by End Use, 2023E & 2033F
Explore Packaging Insights
View Reports