
- Market Size (2026)
- USD 656.2 Mn
- Forecast (2036)
- USD 990.2 Mn
- CAGR (2026 to 2036)
- 4.2%
How big is Cryotubes Market in 2026?
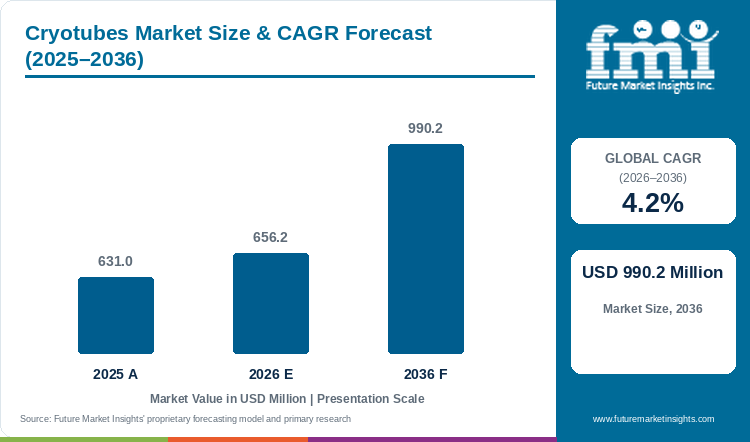
Accounting for USD 631.0 million in 2025 and rising to USD 656.2 million in 2026, the cryotubes market is projected to expand to USD 990.2 million by 2036, advancing at a CAGR of 4.2%.
Total global cryotubes market size stood at USD 631.0 million in 2025 and progresses to USD 656.2 million in 2026. Overall industry valuation is slated to scale to USD 990.2 million by 2036, reflecting a 4.2% CAGR over 2026 to 2036. FMI analysis indicates that external thread cryotubes with silicone O-ring seals hold an estimated 57.6% share of 2026 closure demand because smooth inner vial walls prevent residual droplet trapping during robotic pipetting. Demand is anchored by consumables repurchase cadence as national genomic registries and cell-therapy plants aliquot every donor sample into multiple 2D-barcoded vials for longitudinal omics validation [1]. That steady biobank replenishment model contrasts with human iPSC drug discovery biobanks at 11.2% CAGR since hardware-locked polypropylene tubes track installed freezer rack slots. Biopharmaceutical sponsors are simultaneously expanding cryo-archived biologic pipelines, as AstraZeneca plc secured 47 regulatory medicine clearances with 7% nine-month top-line expansion by October 2026 [2]. Biorepository directors renew annual cryotube contracts when USP Class VI virgin polypropylene and co-molded seals pass minus 196 degrees Celsius pressure-leak tests through 2036.
Key Market Trends and Insights
- By closure architecture: External Thread Cryotubes with Silicone O-Ring hold an estimated 57.6% share in 2026 because external threads prevent biological fluid trapping and aerosol generation.
- By barcoding integration: 2D Laser-Etched Bottom DataMatrix Barcodes represent 44.7% in 2026 as high-throughput flatbed scanners read entire 96-well SBS racks in under three seconds.
- By volumetric capacity: 1.0 ml to 2.0 ml Standard Biobank Cryotubes account for 48.5% in 2026 because standard 2-inch cryobox grids and automated decappers are built around 1.8-milliliter footprints.
- By temperature resilience: Liquid Nitrogen Vapor Phase -196C Cryogenic secures 68.9% in 2026 owing to mandatory cellular arrest below the minus 135 degrees Celsius glass transition of water.
- By end user: Biopharmaceutical and Cell Therapy Manufacturers command 53.2% in 2026 through cGMP master cell bank, viral vector, and CAR-T leukapheresis archiving.
Regional Growth Summary
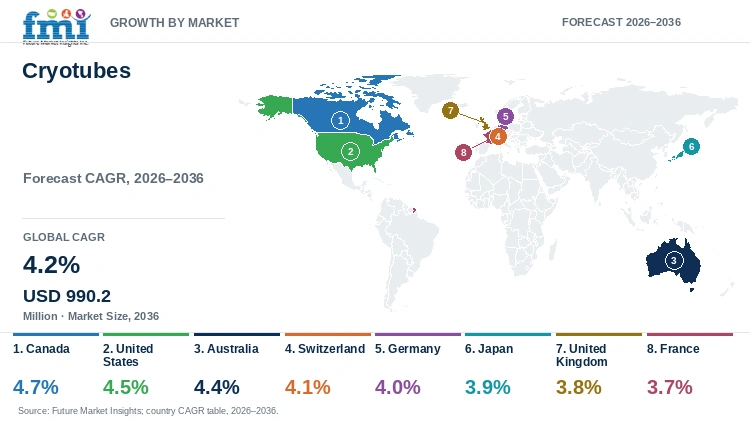
- Top national expansion: Canada leads national growth projections at a 4.7% CAGR through 2036 under stem-cell biomanufacturing and federated hospital biobank investments.
- Broader country progression: The United States tracks at a 4.5% CAGR ahead of Australia at 4.4% and Switzerland at 4.1%, whereas France advances at a 3.7% CAGR.
Market Size and Forecast
Table 1: Market Size and Forecast for the Cryotubes Market (USD million and CAGR percentage), 2025 to 2036
| Metric | Value |
|---|---|
| 2025 Market Size | USD 631.0 million |
| Estimated Market Size in 2026 | USD 656.2 million |
| Projected Market Size by 2036 | USD 990.2 million |
| CAGR, 2026 to 2036 | 4.2% |
| Added Market Value, 2026 to 2036 | USD 334.0 million |
Procurement decisions in genomic biobanking and cell-therapy manufacturing are governed by the high financial cost of losing an irreplaceable patient biopsy or CAR-T lot during ultra-low storage. When biorepositories use poorly matched cap-and-tube polymers below minus 150 degrees Celsius, uneven thermal shrinkage allows liquid nitrogen to seep inside the vial and cause over-pressurization upon thawing. In August 2026, biotechnology researchers in Trends in Biotechnology demonstrated that sugar-augmented cryopreservation in optimized cryogenic vials improved post-thaw CAR-T and stem-cell viability by 1.8-fold and therapeutic efficacy by two-fold [3]. Because post-thaw cell recovery directly determines clinical batch release, biopharma quality directors standardize vapor-phase archiving around cryogenic vials and tubes certified for zero nitrogen ingress.
Biobank Aliquot Volume and Cryovial Unit Sizing
Table 2: Biobank Aliquot Volume and Cryovial Unit Sizing for the Cryotubes Market (USD million and operational ranges), 2025 to 2036
| Metric | 2025 | 2026 | 2036 |
|---|---|---|---|
| Market size (USD million) | 631.0 | 656.2 | 990.2 |
| Annual sterile cryotube shipments (billion units) | 2.52 to 2.85 | 2.62 to 2.96 | 3.85 to 4.35 |
| 2D-barcoded automated rack vials (billion units) | 1.10 to 1.25 | 1.17 to 1.32 | 1.95 to 2.20 |
| Average manufacturer realization per 1,000 tubes (USD) | 225.0 to 252.0 | 228.0 to 256.0 | 235.0 to 268.0 |
Operational note: Unit shipment ranges cover bulk bagged 1D-printed research cryovials through pre-racked, gamma-irradiated, 2D laser-etched SBS biobank tubes.
Labor shortages and sample-traceability mandates across hospital biobanks are also accelerating the shift from manual screw-cap vials to robotic 96-well rack consumables. Automated eight-channel decappers jam and halt entire cold-room workflows if cap slip torque varies across a rack or if plasticizer leachables contaminate downstream sequencing assays. To guarantee unattended robotic throughput, cleanroom injection molders manufacture specialized cryogenic vials from USP Class VI virgin polypropylene with tightly calibrated thread tolerances.
Per Capita and Biorepository Facility Valuation Indicators
Table 3: Per Capita and Biorepository Indicators for the Cryotubes Market (USD), 2025 to 2036
| Metric | 2025 | 2026 | 2036 |
|---|---|---|---|
| World population (billion) | 8.2 | 8.3 | 9.0 |
| Market value per 1,000 people (USD) | 77.0 | 79.1 | 110.0 |
| Annual procurement per biobank or cell-therapy site (USD thousand) | 72.5 to 84.0 | 75.4 to 87.2 | 112.0 to 129.5 |
| Liquid nitrogen vapor-phase -196C rated share (%) | 67.5% to 69.0% | 68.0% to 69.5% | 73.0% to 76.5% |
Table 4: Biorepository and Channel Valuation Indicators for the Cryotubes Market (USD and percentages), 2026
| Metric | Value | Institutional Reference Basis |
|---|---|---|
| Market size, 2026 | USD 656.2 million | 2026 global market value baseline |
| Active genomic biobanks, IVF clinics & biopharma sites | 8,200 facilities | Global clinical biorepositories and GMP cell banks |
| Annual market value per facility | USD 80,024.4 | Average facility-level cryotube expenditure |
| Biopharmaceutical & Cell Therapy valuation, 2026 | USD 349.1 million | 53.2% primary end-user allocation |
Higher electricity and liquid-nitrogen operating expenses in large biorepositories are pushing facility managers to maximize specimen density per cubic foot of freezer space. Repeated rack pulls also expose adjacent patient aliquots to transient warming above the minus 135 degrees Celsius glass-transition threshold where ice recrystallization damages cell membranes. Biobank directors mitigate these thermal excursions by pairing low-profile barcoded vials with cryopreservation tunnel freezers to lock in uniform cooling curves across high-density racks.
Analyst Perspective
"Genomic biobanks and autologous cell-therapy manufacturers do not procure cryotubes on resin weight; they buy guaranteed vapor-phase seal integrity at minus 196 degrees Celsius and zero-jam robotic decapping. Molders that co-inject medical-grade polypropylene with permanent 2D laser-etched DataMatrix bases will lock in recurring consumable supply contracts across automated biorepositories."
- Nandini Roy Choudhury, Principal Consultant, Future Market Insights.
How is the cryotubes market segmented?
The cryotubes market is segmented by closure architecture, barcoding integration, volumetric capacity, temperature resilience, and end user. In 2026, External Thread Cryotubes with Silicone O-Ring are projected at 57.6%, 2D Laser-Etched Bottom DataMatrix Barcodes at 44.7%, 1.0 ml to 2.0 ml Standard Biobank Cryotubes at 48.5%, Liquid Nitrogen Vapor Phase -196C Cryogenic at 68.9%, and Biopharmaceutical and Cell Therapy Manufacturers at 53.2%.
By closure architecture: External Thread Cryotubes with Silicone O-Ring and Internal Thread Cryotubes with Bi-Injected Seal.
By barcoding integration: 2D Laser-Etched Bottom DataMatrix Barcodes, 1D Printed Linear Side Barcodes, and Non-Barcoded Standard Tube Vials.
By volumetric capacity: 1.0 ml to 2.0 ml Standard Biobank Cryotubes, 4.0 ml to 5.0 ml High-Volume Tubes, and 0.5 ml Micro-Storage Tubes.
By temperature resilience: Liquid Nitrogen Vapor Phase -196C Cryogenic and Mechanical Ultra-Low Temperature -80C Freezers.
By end user: Biopharmaceutical and Cell Therapy Manufacturers and Academic Biobanks and IVF Fertility Centers.
Why do External Thread Cryotubes with Silicone O-Ring lead the closure architecture category?
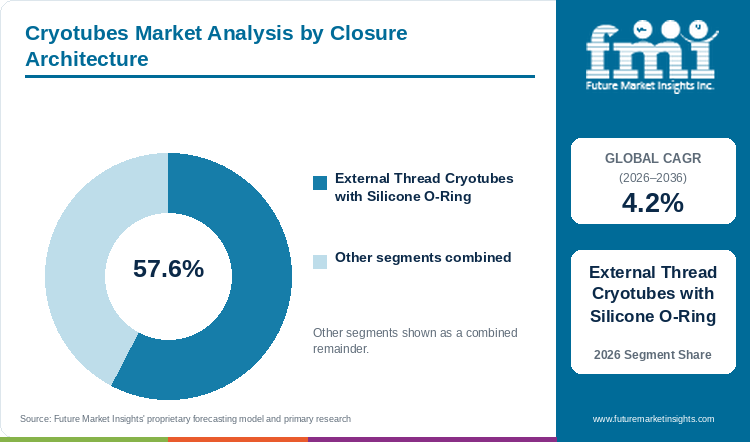
External Thread Cryotubes with Silicone O-Ring hold an estimated 57.6% of closure architecture demand in 2026, anchored by aseptic robotic decapping and flush inner wall geometry.
Table 5: Closure Architecture Share for the Cryotubes Market (percentage share), 2026
| Closure Architecture | Share (2026) |
|---|---|
| External Thread Cryotubes with Silicone O-Ring | 57.6% |
| Other Segments Combined | 42.4%* |
| Total | 100.0% |
*Note: Internal Thread Cryotubes with Bi-Injected Seal account for the balance of 2026 global cryotubes demand.
Table 6: Closure Architecture Leadership and Market Growth for the Cryotubes Market (segment and CAGR percentage), 2026 to 2036
| Metric | Value |
|---|---|
| Global CAGR (2026 to 2036) | 4.2% |
| Leading Segment | External Thread Cryotubes with Silicone O-Ring |
External thread closures seat the cap skirt over the outer rim of the polypropylene tube barrel so biological suspensions never touch screw threads during vortexing or thawing. Automated biorepositories pairing vials with ultra-low cryogenic freezers favor external-thread silicone O-ring designs because flush internal bores allow 100% sample recovery by robotic pipette tips.
- External Thread Cryotubes with Silicone O-Ring hold 57.6% of closure architecture market value in 2026 because external threads prevent thread-borne contamination during automated handling.
- In February 2026, biobanking specialists in Biopreservation and Biobanking validated long-term RNA quality control and seal integrity across cryopreserved blood tubes [4].
What sustains 2D Laser-Etched Bottom DataMatrix Barcodes leadership in the barcoding integration segment?
2D Laser-Etched Bottom DataMatrix Barcodes represent 44.7% of the barcoding integration category in 2026, supported by frost-resistant whole-rack optical scanning.
High-contrast 2D DataMatrix codes permanently laser-ablated into a black-on-white polymer base insert remain 100% readable after decades in liquid-nitrogen vapor or DMSO solvent splashes. Unlike side-printed ink labels that peel or frost over, bottom-etched codes pair with cold-chain biologic monitoring labels so LIMS software tracks all 96 tubes simultaneously without lifting individual vials.
- 2D Laser-Etched Bottom DataMatrix Barcodes represent 44.7% of the barcoding integration segment in 2026 as high-throughput biobanks mandate automated whole-rack LIMS traceability.
- An October 2025 study in Methods and Protocols demonstrated how tube-level visual and optical excursion indicators prevent undetected thaw-refreeze damage in biobank storage [5].
How do 1.0 ml to 2.0 ml Standard Biobank Cryotubes lead the volumetric capacity category?
1.0 ml to 2.0 ml Standard Biobank Cryotubes account for 48.5% of volumetric capacity demand in 2026, driven by universal 2-inch freezer box and SBS rack compatibility.
Standard 1.0-milliliter to 2.0-milliliter cryotubes represent the universal working volume for peripheral blood mononuclear cells, serum aliquots, hybridoma clones and viral master cell banks. Clinical laboratories integrating automated liquid-handling pipette tips standardize on 1.8-milliliter and 2.0-milliliter vials because stainless-steel freezer towers and automated decappers are engineered around this exact height.
- 1.0 ml to 2.0 ml Standard Biobank Cryotubes account for 48.5% of volumetric capacity market value in 2026 because legacy 81-place and 100-place cryoboxes fit 1.8-milliliter tubes.
- In October 2025, immunologists in Frontiers in Immunology confirmed that standardized 1.5-milliliter to 2.0-milliliter PBMC cryopreservation protocols preserve single-cell transcriptomic profiles [6].
Why does Liquid Nitrogen Vapor Phase -196C Cryogenic lead the temperature resilience category?
Liquid Nitrogen Vapor Phase -196C Cryogenic secures 68.9% of temperature resilience value in 2026, supported by cellular metabolic arrest below minus 135 degrees Celsius.
Cryogenic storage of viable stem cells, CAR-T lymphocytes, and reproductive gametes above liquid nitrogen in the vapor phase between minus 150 and minus 196 degrees Celsius halts ice recrystallization while avoiding liquid-phase viral cross-contamination. Vials certified for vapor-phase cryogenic service use high-molecular-weight homopolymer polypropylene and matched-expansion elastomers that resist brittle cracking during rapid thermal retrieval.
- Liquid Nitrogen Vapor Phase -196C Cryogenic secures 68.9% of temperature resilience demand in 2026 as cellular therapy and IVF registries mandate storage below the water glass-transition point.
- A July 2026 clinical study in the International Brazilian Journal of Urology proved that direct liquid-nitrogen vapor cooling at minus 20.5 degrees Celsius per minute minimizes sperm DNA fragmentation [7].
What gives Biopharmaceutical and Cell Therapy Manufacturers the leading position in end user?
Biopharmaceutical and Cell Therapy Manufacturers command 53.2% of end-user share in 2026, anchored by cGMP master cell banking and autologous therapy lot archiving.
Every commercial monoclonal antibody, viral vector, and autologous cell therapy requires triple-redundant cGMP master and working cell banks with mandatory retention aliquots for FDA and EMA stability testing. Biopharmaceutical procurement teams sign multi-year contracts for USP Class VI, SAL 10^-6 sterile, RNase/DNase-free and endotoxin-certified cryotube lots with full resin-lot traceability.
- Biopharmaceutical and Cell Therapy Manufacturers command 53.2% of end-user market value in 2026 because cGMP cell banking requires premium pre-sterilized, lot-certified cryovials.
- In August 2025, biopreservation researchers in Frontiers in Bioengineering and Biotechnology validated animal-protein-free PBMC cryopreservation media in sterile biobanking tubes for clinical cell therapy [8].
What are the drivers, restraints, and opportunities in the cryotubes market?
In the cryotubes market, automated genomic biobanking and cell-therapy archiving are projected to drive adoption whereas virgin medical-grade polypropylene costs and O-ring glass-transition shrinkage restrain uncalibrated molding and high-density 0.5 ml SBS micro-tubes open freezer-space optimization.
- Driver: Expanding national population biobanks, oncology liquid-biopsy cohorts, and autologous cell-therapy pipelines require millions of traceable single-use cryovials annually.
- Restraint: Differential thermal contraction between tube barrels and poorly formulated caps below minus 150 degrees Celsius risks seal vacuum loss, sample oxidation, and liquid-nitrogen seepage.
- Opportunity: High-density 96-format and 138-format 0.5-milliliter SBS micro-cryotubes with dual 1D/2D coding double specimen capacity inside energy-intensive cryogenic tanks.
Growth Analysis and Future Potential Demand Drivers
Longitudinal multi-omics cohorts and commercial cell-and-gene therapy manufacturing are driving sustained unit consumption of sterile, traceable cryogenic storage tubes. When a hospital biobank collects blood and plasma from a single oncology donor, robotic liquid handlers split that draw across 8 to 16 separate cryotubes so future genomic or proteomic assays never thaw the master specimen twice. Combination of 2D-coded vials with conical laboratory centrifuge tubes streamlines upstream cell harvesting and downstream vapor-phase archiving. In April 2025, biopreservation economists in Cryobiology documented how standardized cryopreservation consumables underpin the commercial scalability of stem-cell and regenerative medicine supply chains [9].
Risk Assessment of the Cryotubes Market Operational Friction
Seal failure at cryogenic temperatures and strict USP <1663>/<1664> extractables and leachables compliance represent the primary technical friction points restraining low-cost plastic molders. When standard laboratory polypropylene is cooled below its glass transition toward minus 196 degrees Celsius, uncalibrated cap threads lose clamping torque and allow gaseous or liquid nitrogen to infiltrate the vial. In August 2026, reproductive clinical researchers in Human Reproduction Open analyzing 14,811 records confirmed that prolonged cryopreservation storage conditions directly influence embryo clinical pregnancy outcomes [10]. Quality directors managing autologous cell therapy manufacturing consequently reject unvalidated commodity tubes in favor of bi-injected thermoplastic elastomer or medical-silicone sealed cryovials.
Commercial Opportunity Analysis and Value-Add Formats
Consumable manufacturers capture higher per-rack margins by replacing round-bottom 2.0-milliliter vials in manual boxes with low-profile 0.5-milliliter and 1.0-milliliter tri-coded tubes pre-loaded in ANSI/SLAS 96-well racks. Transition to to high-density SBS micro-tubes increases sample density per liquid-nitrogen freezer by up to 120%, cutting facility floor-space and liquid-nitrogen boil-off costs per stored specimen. Incorporation of automated decapping tubes with cryopreservation thaw test platforms also enables closed-system post-thaw viability verification in GMP suites. In July 2025, transfusion medicine specialists in Transfusion Clinique et Biologique highlighted how next-generation cryopreservation containers and cryoprotectants reduce cellular storage injury across blood and cell banks [11].
Cryotubes Market by Country (2026 to 2036)
FMI country modeling indicates that Canada leads cryotubes market expansion at a 4.7% CAGR through 2036, while France advances at a 3.7% CAGR. Commercial adoption across North American cell-therapy centers, European ISO 20387 accredited biobanks, and Asia-Pacific genomic cohorts hinges on 2D SBS rack automation and USP Class VI resin certification.
Table 7: Country CAGR and Primary Growth Levers for the Cryotubes Market (CAGR percentage and operational drivers), 2026 to 2036
| Country | CAGR (2026 to 2036) | Primary Growth Lever |
|---|---|---|
| Canada | 4.7% | Federal Biomanufacturing and Life Sciences Strategy and stem-cell biorepository scaling |
| United States | 4.5% | NIH All of Us genomic biobanking and commercial CAR-T master cell bank production |
| Australia | 4.4% | National clinical trial biobanking hubs and agricultural/wildlife genetic cryobanks |
| Switzerland | 4.1% | Swiss Biobank Platform standardization and Basel biologics master cell banking |
| Germany | 4.0% | German Biobank Alliance ISO 20387 accreditation and mRNA/cell-therapy cryo-archiving |
| Japan | 3.9% | iPSC regenerative medicine cell banks in Kyoto and automated hospital genome archives |
| United Kingdom | 3.8% | UK Biobank multi-omics aliquot expansion and Stevenage cell-and-gene therapy cluster |
| France | 3.7% | INSERM/hospital certified biological resource centers and viral vaccine seed banking |
Source: Future Market Insights analysis
Canada Cryotubes Market Outlook (2026 to 2036)
Canada leads national growth projections at a 4.7% CAGR through 2036 as federal biomanufacturing grants and provincial cancer biobanks expand automated vapor-phase storage capacity in Toronto, Montreal, and Vancouver. Unlike smaller research markets that rely on manual -80 degrees Celsius chest freezers, Canadian regenerative medicine hubs standardize on 2D-barcoded SBS cryotube racks serviced by robotic pickers. In February 2026, cryobanking scientists in Biopreservation and Biobanking validated vitrification and ultra-low cryogenic tube storage protocols for long-term genetic resource preservation [12]. Canadian hospital biobanks and contract viral-vector plants prioritize gamma-sterilized external-thread cryotubes with laser-etched DataMatrix bases for longitudinal cohort tracking. Provincial biorepositories also validate automated decapper slip torque across sub-zero racks and robotic stations.
Key takeaway: In Canada, regenerative medicine biomanufacturing and automated cancer biobanks are projected to drive leading demand for 2D-barcoded cryotubes.
United States Cryotubes Market Outlook (2026 to 2036)
United States cryotube procurement should climb at a 4.5% CAGR during 2026 through 2036, anchored by the world's largest installed base of automated genomic biorepositories and FDA-licensed cell-and-gene therapy plants. What distinguishes the United States market is the massive recurring volume of pre-racked, tri-coded 1.0-milliliter and 2.0-milliliter cryovials consumed by contract research organizations and fertility networks. October 2026 financial statements from Thermo Fisher Scientific Inc. detailed third-quarter gains across strong demand across bioprocessing, clinical trial biorepositories, and laboratory plasticware [13]. American biopharma procurement teams require full USP Class VI extractables dossiers and lot-specific endotoxin certificates on every contracted cryotube shipment. Clinical cell-banking teams further archive resin-lot certificates for regulatory inspections and quality audits.
Key takeaway: In the United States, commercial cell-therapy cell banking and population genomic cohorts are anticipated to anchor recurring SBS cryotube contracts.
Australia Cryotubes Market Outlook (2026 to 2036)
Cryotubes market valuation in Australia should climb at a 4.4% CAGR through 2036 as state-funded clinical trial biorepositories in New South Wales and Victoria expand automated liquid-nitrogen archives. Australia combines fast-growing Phase I/II oncology clinical trial specimen banking with world-leading IVF fertility clinics and biodiversity genetic cryobanks that operate at minus 196 degrees Celsius. In August 2026, cryobiologists in Biopreservation and Biobanking demonstrated how enzymatic antioxidant extenders inside cryogenic storage vials protect post-thaw cellular mitochondrial activity [14]. Australian pathology networks and biobanks favor external-thread silicone O-ring cryotubes shipped in sterile, barcoded 96-well racks to minimize manual labeling labor. State pathology networks also test laser-etched barcode contrast after liquid-nitrogen immersion and thermal cycling.
Key takeaway: In Australia, oncology clinical trial biorepositories and IVF fertility clinics are forecast to sustain steady demand for vapor-phase cryotubes.
Switzerland Cryotubes Market Outlook (2026 to 2036)
Switzerland registers a 4.1% annual growth rate from 2026 through 2036 since biologics campuses in Basel and Geneva maintain extensive cGMP master and working cell banks. Under Swiss Biobank Platform quality guidelines, university hospital repositories and private pharma archives enforce automated 2D sample tracking and vapor-phase temperature logging on every stored aliquot. In March 2026, Roche Holding AG launched the cobas MPX-E four-in-one multiplex PCR donor screening assay in Basel to safeguard global blood and plasma biobank supplies [15]. Swiss quality assurance directors specify medical-grade polypropylene cryotubes with co-molded thermoplastic elastomer seals that guarantee zero leachables during decade-long biologics storage. Basel biologics quality teams further run helium leak testing on closure seals across production lots.
Key takeaway: In Switzerland, cGMP biologics cell banking and Swiss Biobank Platform automation standards are anticipated to sustain premium cryotube procurement.
Germany Cryotubes Market Outlook (2026 to 2036)
Germany should rise at a 4.0% CAGR through 2036 across German Biobank Alliance university clinics, mRNA vaccine plants, and precision injection-molding hubs. Because German university medical centers operate centralized liquid-nitrogen towers accredited under DIN EN ISO 20387, laboratory directors replace legacy hand-labeled vials with 2D DataMatrix SBS tubes. In October 2026, Sanofi SA broke ground on a new 36,000-square-meter biological insulin manufacturing facility at its Frankfurt BioCampus in Germany requiring extensive cGMP master cell banking [16]. German biorepository managers also prioritize ACT-labeled and ISCC PLUS mass-balanced bio-circular polypropylene cryotubes to meet institutional hospital sustainability mandates. University biobank engineers also integrate flatbed optical scanners inside cold airlocks for rapid rack verification.
Key takeaway: In Germany, ISO 20387 biobank automation and bio-circular polypropylene procurement charters are estimated to drive cryotube upgrades.
Japan Cryotubes Market Outlook (2026 to 2036)
Demand for cryotubes in Japan will expand at a 3.9% CAGR over 2026 through 2036, supported by clinical induced pluripotent stem cell banks and national genomic medicine centers. Japan's regenerative medicine ecosystem requires ultra-clean, zero-particulate cryogenic vials capable of preserving clinical-grade iPSC clones in liquid-nitrogen vapor without DMSO-induced polymer crazing. Danaher Corporation posted USD 24.6 billion in 2025 life-science and diagnostic turnover during January 2026 to support bioprocessing and cellular research laboratories across East Asia [17]. Japanese stem-cell repositories and pharmaceutical QC labs demand precision-molded internal-thread and external-thread cryotubes with certified zero-endotoxin and zero-extractable profiles. Regenerative medicine centers further verify zero particulate shedding in cleanroom vials before clinical lot release.
Key takeaway: In Japan, clinical iPSC stem-cell banking and genomic medicine repositories are slated to sustain demand for ultra-low-extractable cryotubes.
United Kingdom Cryotubes Market Outlook (2026 to 2036)
The United Kingdom is projected to record a 3.8% CAGR in cryotubes market value through 2036 across population health cohorts and the Stevenage cell-and-gene therapy manufacturing cluster. Large-scale British repositories such as UK Biobank and Genomics England rely on high-density automated minus 80 and minus 196 degrees Celsius stores that process thousands of 2D-coded tubes daily. In March 2025, cryobiologists publishing in Cryobiology demonstrated that precise two-step cooling to minus 30 degrees Celsius followed by liquid-nitrogen immersion at minus 196 degrees Celsius maximizes post-thaw viability [18]. British biorepository operators contract for pre-racked, human-readable and 2D-barcoded cryotubes engineered for jam-free robotic picking in sub-zero airlocks. Genomic cohort managers also standardize 96-well rack footprints across robotic pickers.
Key takeaway: In the United Kingdom, population multi-omics repositories and cell-therapy clusters are projected to favor automated 2D-barcoded cryotubes.
France Cryotubes Market Outlook (2026 to 2036)
France moves upward at a 3.7% CAGR during 2026 through 2036 inside hospital Centres de Ressources Biologiques certified under dual NF S96-900 and ISO 20387 biobanking standards. Unlike decentralized academic labs, French public hospitals and vaccine manufacturers consolidate biological specimens inside regional robotic cryo-hubs in Lyon, Paris and Marseille. In July 2026, vitrification researchers in Plants documented standardized minus 196 degrees Celsius liquid-nitrogen cryobanking protocols that prevent intracellular ice crystal formation during long-term ex-situ storage [19]. French hospital procurement syndicates mandate CE-marked and ISO-certified polypropylene cryotubes with leak-proof silicone O-rings and permanent laser-etched batch numbers. Hospital biological resource centers further audit gamma-irradiation sterility assurance records across incoming tube shipments.
Key takeaway: In France, ISO 20387 hospital biological resource centers and vaccine seed banks are predicted to sustain steady procurement of certified cryotubes.
Detailed territory CAGR models cover North America and Latin America as well as Western Europe and Eastern Europe. Multi-region tracking also includes East Asia, South Asia and Pacific, and Middle East and Africa.
Who are the notable companies in the cryotubes market?
Sanofi SA, AstraZeneca plc, Medtronic plc, Boston Scientific Corporation, Abbott Laboratories, Thermo Fisher Scientific Inc., Danaher Corporation, Roche Holding AG, Novartis AG, and Merck and Co. Inc. are the notable companies evaluated across the cryotubes biobanking and biopharmaceutical ecosystem.
Commercial participation across cryogenic storage tubes separates cleanroom polymer molders, cGMP cell-bank sponsors, and surgical hardware producers. Thermo Fisher Scientific Inc. partners with Danaher Corporation plus Abbott Laboratories and Roche Holding AG to deliver barcoded cryovials. Concurrently Sanofi SA and AstraZeneca plc join Novartis AG and Merck and Co Inc in seed banking, whereas device makers Boston Scientific Corporation and Medtronic plc supply cryo-surgical hardware.
- Cryogenic Consumables, Bioprocessing and Diagnostic Leaders: Thermo Fisher Scientific Inc and Danaher Corporation and Abbott Laboratories and Roche Holding AG manufacture Nunc and Matrix 2D-barcoded cryotubes, automated liquid-nitrogen freezers and core-lab specimen archiving platforms.
- Biopharmaceutical Master Cell Bank and Clinical Biorepository Operators: Sanofi SA, AstraZeneca plc and Novartis AG and Merck and Co Inc represent the largest institutional buyers and validators of USP Class VI sterile cryotubes for biologics, viral vectors and oncology trial biobanks.
- Adjacent Medical Technology and Surgical Tissue Systems: Medtronic plc and Boston Scientific Corporation develop cryoablation, tissue preservation, and implantable clinical technologies across hospital networks.
Competitive Benchmarking in the Cryotubes Market
Table 8: Competitive Benchmarking for the Cryotubes Market (qualitative capability ratings), 2026
| Company | Cryogenic Biobanking Scale | 2D Automation & LIMS Fit | cGMP Cell-Therapy Qualification | Geographic Reach |
|---|---|---|---|---|
| Sanofi SA | High | High | High | Global biologics and vaccine cell banking; EUR 43.6B 2025 sales |
| AstraZeneca plc | High | High | High | Global oncology and cell-therapy biorepositories; 47 approvals by Q3 2026 |
| Medtronic plc | Medium | High | Medium | Global medical technology and cryo-therapeutic systems across 150+ countries |
| Boston Scientific Corporation | Medium | Medium | Medium | Global interventional and clinical cryo-diagnostic device footprint |
| Abbott Laboratories | High | High | High | Global core lab diagnostics and oncology liquid-biopsy biobanking |
| Thermo Fisher Scientific Inc. | High | High | High | Global Nunc and Matrix 2D cryotubes, CryoExtra freezers, and Patheon CDMO |
| Danaher Corporation | High | High | High | Global Cytiva ViaFreeze cryo-chain and Beckman Coulter lab automation |
| Roche Holding AG | High | High | High | Global clinical trial biorepositories and automated cobas pre-analytics |
| Novartis AG | High | High | High | Global CAR-T (Kymriah/YTB323) and biologics cryogenic manufacturing |
| Merck and Co. Inc. | High | High | High | Global vaccine seed banking and oncology biomarker repositories |
Evaluation basis: Cryogenic Biobanking Scale measures documented deployment or manufacturing of minus 196 degrees Celsius vapor-phase vials and biorepository infrastructure, whereas 2D Automation and LIMS Fit rates SBS rack decapping and optical DataMatrix integration. cGMP Cell-Therapy Qualification assesses compliance with USP Class VI extractables, SAL 10^-6 sterility, and endotoxin-free standards.
Key Developments in the Cryotubes Market
- Abbott Laboratories completed its strategic acquisition of Exact Sciences in April 2026, expanding oncology liquid-biopsy and clinical specimen biobanking operations [20].
- Novartis AG reported strong third-quarter 2026 financial results in October 2026, advancing cell, gene and radioligand manufacturing across global cGMP facilities [21].
- Merck and Co Inc announced USD 18.1 billion in third-quarter 2026 sales in October 2026 with expanded Phase 3 oncology and biologics clinical trial repositories [22].
Key Players in the Cryotubes Market
Cryogenic Consumables, Bioprocessing, and Diagnostic Leaders
- Thermo Fisher Scientific Inc.
- Danaher Corporation
- Abbott Laboratories
- Roche Holding AG
Biopharmaceutical Master Cell Bank and Clinical Biorepository Operators
- Sanofi SA
- AstraZeneca plc
- Novartis AG
- Merck and Co Inc
Adjacent Medical Technology and Surgical Tissue Systems
- Medtronic plc
- Boston Scientific Corporation
Cryotubes Market - Report Scope
Table 9: Report Scope for the Cryotubes Market (coverage fields and definitions), 2026 to 2036
| Coverage field | Report scope |
|---|---|
| Market breakdown | Closure Architecture; Barcoding Integration; Volumetric Capacity; Temperature Resilience; End User |
| Quantitative Units | USD Million |
| Market Definition | Includes commercial supplier market value from sterile medical-grade polypropylene and specialized polymer cryotubes (cryogenic vials) across external-thread silicone O-ring and internal-thread bi-injected closures, 2D DataMatrix/1D barcoded and non-barcoded formats, and 0.5 ml to 5.0 ml capacities rated for -80C mechanical and -196C liquid-nitrogen vapor storage. Category Scope Note: Excludes capital liquid-nitrogen freezer tanks, glass lyophilization serum vials, and standard ambient microcentrifuge tubes. |
| Regions Covered | North America; Latin America; Western Europe; Eastern Europe; East Asia; South Asia and Pacific; Middle East and Africa |
| Countries Covered | Canada, United States, Australia, Switzerland, Germany, Japan, United Kingdom, France, and additional countries in the full report |
| Key Companies Covered | Sanofi SA, AstraZeneca plc, Medtronic plc, Boston Scientific Corporation, Abbott Laboratories, Thermo Fisher Scientific Inc., Danaher Corporation, Roche Holding AG, Novartis AG, Merck and Co. Inc. |
| Forecast Period | 2026 to 2036 |
| Approach | Valuation triangulated via physical volume shipments, manufacturer ASP realizations, and published industry reports. Child market represents 6.3% of Global Pharmaceutical and Medical Technology Industry. Compounding validated at 4.2% CAGR with zero hierarchy anomalies. |
Cryotubes Market - Research Methodology
Table 10: Research Methodology for the Cryotubes Market (research methods and approach), 2026 edition
| Method | Approach |
|---|---|
| Primary Research | Structured interviews with ISO 20387 biobank directors, cleanroom injection-molding engineers, and cGMP cell-therapy quality managers to validate 2D SBS rack pricing and annual aliquot replenishment rates. |
| Secondary Research | Analysis of Biopreservation and Biobanking peer-reviewed studies, ISBER Best Practices, USP <661>/<88> Class VI standards, and audited corporate financial filings. |
| Market Sizing and Forecasting | Top-down parent laboratory plasticware and biobanking consumables baselines reconciled against bottom-up annual sterile cryotube shipments (2.62B to 2.96B units in 2026) and per-1,000-unit realizations from 2026 to 2036. |
| Country Forecasting Model | Econometric national projections weight installed -196C vapor-phase freezer capacity, national genome cohort funding, and cGMP cell-therapy clinical trials across eight countries. |
| Operational Benchmark Traceability | Unit shipment and biorepository indicators in Tables 2, 3, and 4 trace to multi-aliquot donor banking protocols and verified national biobank registries. |
| Data Triangulation and Validation | Valuation estimates isolate single-use cryogenic storage tubes and pre-racked 2D SBS vials while strictly excluding capital freezers and non-cryogenic centrifuge tubes. |
Cryotubes Market by Segments
Cryotubes Market segmented by Closure Architecture:
- External Thread Cryotubes with Silicone O-Ring
- Internal Thread Cryotubes with Bi-Injected Seal
Cryotubes Market segmented by Barcoding Integration:
- 2D Laser-Etched Bottom DataMatrix Barcodes
- 1D Printed Linear Side Barcodes
- Non-Barcoded Standard Tube Vials
Cryotubes Market segmented by Volumetric Capacity:
- 1.0 ml to 2.0 ml Standard Biobank Cryotubes
- 4.0 ml to 5.0 ml High-Volume Tubes
- 0.5 ml Micro-Storage Tubes
Cryotubes Market segmented by Temperature Resilience:
- Liquid Nitrogen Vapor Phase -196C Cryogenic
- Mechanical Ultra-Low Temperature -80C Freezers
Cryotubes Market segmented by End User:
- Biopharmaceutical and Cell Therapy Manufacturers
- Academic Biobanks and IVF Fertility Centers
Cryotubes Market by Region
- North America
- United States
- Canada
- Latin America
- Brazil
- Mexico
- Argentina
- Chile
- Western Europe
- Germany
- France
- United Kingdom
- Italy
- Spain
- Benelux
- Nordics
- Eastern Europe
- Poland
- Czech Republic
- Romania
- Hungary
- East Asia
- China
- Japan
- South Korea
- South Asia and Pacific
- India
- ASEAN
- Australia and New Zealand
- Middle East and Africa
- GCC Countries
- South Africa
- Türkiye
- Israel
Research Sources and Bibliography
- [1] Antona A et al (2025, October 15). Comparative evaluation of cryopreservation methods in biobanking on biomarker integrity and omics reliability. Biopreservation and Biobanking, 23(5), 439-448 (PubMed PMID 40098524).
- [2] AstraZeneca plc (2025, November 21). AstraZeneca plans USD 2 billion manufacturing investment in Maryland including Rockville cell therapy site. AstraZeneca Press Releases.
- [3] Murray A et al (2026, August 17). Cryopreservation of cell-based therapies with enhanced cell viability and therapeutic efficacy. Trends in Biotechnology, 44(8), 42608276 (PubMed PMID 42608276).
- [4] Lindqvist H et al (2026, February 19). Quality Control of RNA Extracted from PAXgene Blood RNA Tubes after Long-Term Cryopreservation. Biopreservation and Biobanking, 24(1), 41161697 (PubMed PMID 41161697).
- [5] Carter J et al (2025, October 3). Indicator Tubes A Novel Solution for Monitoring Temperature Excursions in Biobank Storage. Methods and Protocols, 8(5), 120 (PubMed PMID 41149803).
- [6] Vandenberg S et al (2025, October 17). The effects of cryopreservation on human PBMC transcriptome profile in biobanking. Frontiers in Immunology, 16, 1690316 (PubMed PMID 41181136).
- [7] Oliveira F et al (2026, July 13). Impact of Cooling Curve Type on Cellular DNA Integrity During Liquid Nitrogen Vapor Cryopreservation. International Brazilian Journal of Urology, 52(4), 42441906 (PubMed PMID 42441906).
- [8] Jantet-Blaudez F et al (2025, August 1). Evaluation of the viability and functionality of human peripheral blood mononuclear cells in animal-protein-free media. Frontiers in Immunology, 16, 1627973 (PubMed PMID 40821813).
- [9] Sink T et al (2025, April 23). Cryopreservation of biological materials applications and economic perspectives. In Vitro Cellular and Developmental Biology Animal, 61(4), 40266443 (PubMed PMID 40266443).
- [10] Huang L et al (2026, August 13). Effect of cryopreservation duration on pregnancy outcomes in embryos systematic review and meta-analysis. Human Reproduction Open, 2026(4), hoag077 (PubMed PMID 42761755).
- [11] Acker J et al (2025, July 15). Innovations in red blood cell preservation and cryogenic biobanking containers. Transfusion Clinique et Biologique, 32(3), 40074611 (PubMed PMID 40074611).
- [12] Reed B et al (2026, February 27). Cryopreservation of Dormant Buds by Vitrification for Large-Scale Cryobanking of Genetic Resources. Biopreservation and Biobanking, 24(2), 41091536 (PubMed PMID 41091536).
- [13] Thermo Fisher Scientific Inc (2026, October 21). Thermo Fisher Scientific Reports Third Quarter 2026 Financial Results. Thermo Fisher Investor Relations.
- [14] Takahashi K et al (2026, August 14). Supplementation of Catalase Enzyme in Extender Provides Antioxidative Protection to Frozen-Thawed Cells. Biopreservation and Biobanking, 24(4), 42596774 (PubMed PMID 42596774).
- [15] Roche Holding AG (2026, March 30). Roche launches the cobas MPX-E assay 4-in-1 donor screening test for blood biobanks. Roche Media Releases.
- [16] Sanofi SA (2026, October 19). Sanofi breaks ground on new insulin and biologics manufacturing facility in Frankfurt Germany. Sanofi Media Room.
- [17] Danaher Corporation. (2026, January 28). Danaher Reports Fourth Quarter and Full Year 2025 Financial Results. Danaher Investor Relations.
- [18] Nowak D et al (2025, March 29). Two-step cooling and liquid nitrogen immersion protocols in cryopreservation. Cryobiology, 118, 40158297 (PubMed PMID 40158297).
- [19] Hernandez G et al (2026, April 10). Long-Term Preservation by the Vitrification Cryopreservation Method in Liquid Nitrogen. Plants, 15(7), 41986854 (PubMed PMID 41986854).
- [20] Abbott Laboratories. (2026, April 16). Abbott Reports First-Quarter 2026 Results and Updates Full-Year Guidance. Abbott MediaRoom.
- [21] Novartis AG (2026, October 27). Novartis Delivered Sales Growth and Core Margin Expansion in Q3 2026. Novartis Media Releases.
- [22] Merck and Co Inc (2026, October 29). Merck Announces Third-Quarter 2026 Financial Results and Pipeline Milestones. Merck Corporate Newsroom.
- [23] Medtronic plc (2026, June 3). Medtronic Reports Fourth Quarter and Full Year Fiscal 2026 Financial Results. Medtronic Newsroom.
- [24] Boston Scientific Corporation. (2026, March 18). Boston Scientific Corporation 2025 Annual Report and Form 10-K. Boston Scientific Investor Relations.
- [25] Zhou Y et al (2026, August 19). Evidence-based standardization of infectious disease biobanking for diagnostic clinical trials. Frontiers in Public Health, 14, 1903960 (PubMed PMID 42688453).
- [26] Kanter M et al (2025, December 1). Decentralized Biobanking Pathway to Precision Medicine and Biospecimen Supply Chains. Journal of Medical Internet Research, 27, e73965 (PubMed PMID 41328480).
- [27] Abbott Laboratories. (2026, July 16). Abbott Reports Second-Quarter 2026 Results and Raises Full-Year EPS Guidance. Abbott MediaRoom.
- [28] Novartis AG (2026, May 21). Novartis Advances Radioligand Therapy Innovation and Manufacturing Leadership. Novartis Media Releases.
- [29] Medtronic plc (2026, February 17). Medtronic Reports Strong Third Quarter Fiscal 2026 Financial Results. Medtronic Newsroom.
- [30] Boston Scientific Corporation. (2026, October 28). Boston Scientific Announces Financial Results for Third Quarter 2026. Boston Scientific Media Room.
- [31] Author Browning R et al (2025, December 31). Liquid nitrogen spray cryotherapy at minus 196 degrees Celsius multicenter prospective registry. Journal of Thoracic Disease, 17(12), 11227-11238 (PubMed PMID 41522166).
- [32] Novartis AG (2025, April 10). Novartis finalizes US manufacturing and R&D expansion plan with seventh new facility. Novartis Media Releases.
Curated bibliography records are presented above for audit reference. Full source tables and methodological notes accompany the complete study.
This Report Answers
- How large is the cryotubes market in 2026 and what is forecast for 2036?
- Which automated biobanking and cell-therapy archiving workflows support demand for cryotubes?
- Why do External Thread Cryotubes with Silicone O-Ring lead the closure architecture category?
- Why do 2D Laser-Etched Bottom DataMatrix Barcodes lead the barcoding integration category?
- How do growth rates differ across Canada, the United States, Australia and Germany?
- Which leading companies supply 2D-barcoded SBS cryotubes versus operating cGMP cell banks?
- What causes O-ring seal failure or liquid-nitrogen ingress at minus 196 degrees Celsius?
- What should biobank directors evaluate when transitioning to 0.5 ml high-density SBS micro-tubes?
Table of Content
Table of Content
- Key Takeaways
- Market Size and CAGR
- Top Growth Driver
- Fastest Growing Segment
- Leading Region
- Key Companies
- Emerging Opportunities
- Executive Summary
- Global Market Outlook
- Demand-side Trends
- Supply-side Trends
- Technology Roadmap Analysis
- Analysis and Recommendations
- Analyst Perspective (What is happening? Why now? What should investors know?)
- Key Questions Answered
- How large is the market?
- What is the CAGR?
- What are key trends?
- Which region dominates?
- Who are the leaders?
Read More...
- Market Overview
- Market Coverage / Taxonomy
- Market Definition / Scope / Limitations
- Research Methodology
- Chapter Orientation
- Analytical Lens and Working Hypotheses
- Market Structure, Signals, and Trend Drivers
- Benchmarking and Cross-market Comparability
- Market Sizing, Forecasting, and Opportunity Mapping
- Research Design and Evidence Framework
- Desk Research Programme (Secondary Evidence)
- Expert Input and Fieldwork (Primary Evidence)
- Tooling, Models, and Reference Databases
- Data Engineering and Model Build
- Quality Assurance and Audit Trail
- Market Background
- Market Dynamics (Drivers, Restraints, Opportunity, Trends)
- Scenario Forecast (Optimistic, Likely, Conservative)
- Impact Analysis
- AI Impact
- Sustainability Impact
- Regulatory Impact
- Technology Impact
- Consumer / Buyer Analysis
- Purchase Drivers
- Adoption Barriers
- Buyer Journey
- Opportunity Map Analysis
- Product Life Cycle Analysis
- Supply Chain Analysis
- Investment Feasibility Matrix
- Value Chain Analysis
- PESTLE and Porter's Analysis
- Regulatory Landscape
- Regional Parent Market Outlook
- Production and Consumption Statistics
- Import and Export Statistics
- Global Market Analysis and Forecast, 2021 to 2036
- Historical Market Size Value (USD Million) Analysis, 2021 to 2025
- Current and Future Market Size Value (USD Million) Projections, 2026 to 2036
- Y-o-Y Growth Trend Analysis
- Absolute $ Opportunity Analysis
- Global Market Pricing Analysis, 2021 to 2036
- Global Market Analysis and Forecast, By Closure Architecture, 2021 to 2036
- Introduction / Key Findings
- Historical Market Size Value (USD Million) Analysis By Closure Architecture, 2021 to 2025
- Current and Future Market Size Value (USD Million) Analysis and Forecast By Closure Architecture, 2026 to 2036
- External Thread Cryotubes with Silicone O-Ring
- Internal Thread Cryotubes with Bi-Injected Seal
- Y-o-Y Growth Trend Analysis By Closure Architecture, 2021 to 2025
- Absolute $ Opportunity Analysis By Closure Architecture, 2026 to 2036
- Global Market Analysis and Forecast, By Barcoding Integration, 2021 to 2036
- Introduction / Key Findings
- Historical Market Size Value (USD Million) Analysis By Barcoding Integration, 2021 to 2025
- Current and Future Market Size Value (USD Million) Analysis and Forecast By Barcoding Integration, 2026 to 2036
- 2D Laser-Etched Bottom DataMatrix Barcodes
- 1D Printed Linear Side Barcodes
- Non-Barcoded Standard Tube Vials
- Y-o-Y Growth Trend Analysis By Barcoding Integration, 2021 to 2025
- Absolute $ Opportunity Analysis By Barcoding Integration, 2026 to 2036
- Global Market Analysis and Forecast, By Volumetric Capacity, 2021 to 2036
- Introduction / Key Findings
- Historical Market Size Value (USD Million) Analysis By Volumetric Capacity, 2021 to 2025
- Current and Future Market Size Value (USD Million) Analysis and Forecast By Volumetric Capacity, 2026 to 2036
- 1.0 ml to 2.0 ml Standard Biobank Cryotubes
- 4.0 ml to 5.0 ml High-Volume Tubes
- 0.5 ml Micro-Storage Tubes
- Y-o-Y Growth Trend Analysis By Volumetric Capacity, 2021 to 2025
- Absolute $ Opportunity Analysis By Volumetric Capacity, 2026 to 2036
- Global Market Analysis and Forecast, By Temperature Resilience, 2021 to 2036
- Introduction / Key Findings
- Historical Market Size Value (USD Million) Analysis By Temperature Resilience, 2021 to 2025
- Current and Future Market Size Value (USD Million) Analysis and Forecast By Temperature Resilience, 2026 to 2036
- Liquid Nitrogen Vapor Phase -196C Cryogenic
- Mechanical Ultra-Low Temperature -80C Freezers
- Y-o-Y Growth Trend Analysis By Temperature Resilience, 2021 to 2025
- Absolute $ Opportunity Analysis By Temperature Resilience, 2026 to 2036
- Global Market Analysis and Forecast, By End User, 2021 to 2036
- Introduction / Key Findings
- Historical Market Size Value (USD Million) Analysis By End User, 2021 to 2025
- Current and Future Market Size Value (USD Million) Analysis and Forecast By End User, 2026 to 2036
- Biopharmaceutical and Cell Therapy Manufacturers
- Academic Biobanks and IVF Fertility Centers
- Y-o-Y Growth Trend Analysis By End User, 2021 to 2025
- Absolute $ Opportunity Analysis By End User, 2026 to 2036
- Global Market Analysis and Forecast, By Region, 2021 to 2036
- Introduction
- Historical Market Size Value (USD Million) Analysis By Region, 2021 to 2025
- Current Market Size Value (USD Million) Analysis and Forecast By Region, 2026 to 2036
- North America
- Latin America
- Western Europe
- Eastern Europe
- East Asia
- South Asia and Pacific
- Middle East and Africa
- Market Attractiveness Analysis By Region
- North America Market Analysis and Forecast, By Country, 2021 to 2036
- Historical Market Size Value (USD Million) Trend Analysis By Market Taxonomy, 2021 to 2025
- Market Size Value (USD Million) Forecast By Market Taxonomy, 2026 to 2036
- By Country
- United States
- Canada
- By Closure Architecture
- By Barcoding Integration
- By Volumetric Capacity
- By Temperature Resilience
- By End User
- By Country
- Market Attractiveness Analysis
- By Country
- By Closure Architecture
- By Barcoding Integration
- By Volumetric Capacity
- By Temperature Resilience
- By End User
- Key Takeaways
- Latin America Market Analysis and Forecast, By Country
- Historical Market Size Value (USD Million) Trend Analysis By Market Taxonomy, 2021 to 2025
- Market Size Value (USD Million) Forecast By Market Taxonomy, 2026 to 2036
- By Country
- Brazil
- Mexico
- Argentina
- Chile
- By Closure Architecture
- By Barcoding Integration
- By Volumetric Capacity
- By Temperature Resilience
- By End User
- By Country
- Market Attractiveness Analysis
- By Country
- By Closure Architecture
- By Barcoding Integration
- By Volumetric Capacity
- By Temperature Resilience
- By End User
- Key Takeaways
- Western Europe Market Analysis and Forecast, By Country
- Historical Market Size Value (USD Million) Trend Analysis By Market Taxonomy, 2021 to 2025
- Market Size Value (USD Million) Forecast By Market Taxonomy, 2026 to 2036
- By Country
- Germany
- France
- United Kingdom
- Italy
- Spain
- Benelux
- Nordics
- By Closure Architecture
- By Barcoding Integration
- By Volumetric Capacity
- By Temperature Resilience
- By End User
- By Country
- Market Attractiveness Analysis
- By Country
- By Closure Architecture
- By Barcoding Integration
- By Volumetric Capacity
- By Temperature Resilience
- By End User
- Key Takeaways
- Eastern Europe Market Analysis and Forecast, By Country
- Historical Market Size Value (USD Million) Trend Analysis By Market Taxonomy, 2021 to 2025
- Market Size Value (USD Million) Forecast By Market Taxonomy, 2026 to 2036
- By Country
- Poland
- Czech Republic
- Romania
- Hungary
- By Closure Architecture
- By Barcoding Integration
- By Volumetric Capacity
- By Temperature Resilience
- By End User
- By Country
- Market Attractiveness Analysis
- By Country
- By Closure Architecture
- By Barcoding Integration
- By Volumetric Capacity
- By Temperature Resilience
- By End User
- Key Takeaways
- East Asia Market Analysis and Forecast, By Country
- Historical Market Size Value (USD Million) Trend Analysis By Market Taxonomy, 2021 to 2025
- Market Size Value (USD Million) Forecast By Market Taxonomy, 2026 to 2036
- By Country
- China
- Japan
- South Korea
- By Closure Architecture
- By Barcoding Integration
- By Volumetric Capacity
- By Temperature Resilience
- By End User
- By Country
- Market Attractiveness Analysis
- By Country
- By Closure Architecture
- By Barcoding Integration
- By Volumetric Capacity
- By Temperature Resilience
- By End User
- Key Takeaways
- South Asia and Pacific Market Analysis and Forecast, By Country
- Historical Market Size Value (USD Million) Trend Analysis By Market Taxonomy, 2021 to 2025
- Market Size Value (USD Million) Forecast By Market Taxonomy, 2026 to 2036
- By Country
- India
- ASEAN
- Australia and New Zealand
- By Closure Architecture
- By Barcoding Integration
- By Volumetric Capacity
- By Temperature Resilience
- By End User
- By Country
- Market Attractiveness Analysis
- By Country
- By Closure Architecture
- By Barcoding Integration
- By Volumetric Capacity
- By Temperature Resilience
- By End User
- Key Takeaways
- Middle East and Africa Market Analysis and Forecast, By Country
- Historical Market Size Value (USD Million) Trend Analysis By Market Taxonomy, 2021 to 2025
- Market Size Value (USD Million) Forecast By Market Taxonomy, 2026 to 2036
- By Country
- GCC Countries
- South Africa
- Türkiye
- Israel
- By Closure Architecture
- By Barcoding Integration
- By Volumetric Capacity
- By Temperature Resilience
- By End User
- By Country
- Market Attractiveness Analysis
- By Country
- By Closure Architecture
- By Barcoding Integration
- By Volumetric Capacity
- By Temperature Resilience
- By End User
- Key Takeaways
- Key Countries Market Analysis
- United States
- Pricing Analysis
- Market Share Analysis, 2025
- By Closure Architecture
- By Barcoding Integration
- By Volumetric Capacity
- By Temperature Resilience
- By End User
- Canada
- Pricing Analysis
- Market Share Analysis, 2025
- By Closure Architecture
- By Barcoding Integration
- By Volumetric Capacity
- By Temperature Resilience
- By End User
- Mexico
- Pricing Analysis
- Market Share Analysis, 2025
- By Closure Architecture
- By Barcoding Integration
- By Volumetric Capacity
- By Temperature Resilience
- By End User
- Brazil
- Pricing Analysis
- Market Share Analysis, 2025
- By Closure Architecture
- By Barcoding Integration
- By Volumetric Capacity
- By Temperature Resilience
- By End User
- Chile
- Pricing Analysis
- Market Share Analysis, 2025
- By Closure Architecture
- By Barcoding Integration
- By Volumetric Capacity
- By Temperature Resilience
- By End User
- Germany
- Pricing Analysis
- Market Share Analysis, 2025
- By Closure Architecture
- By Barcoding Integration
- By Volumetric Capacity
- By Temperature Resilience
- By End User
- United Kingdom
- Pricing Analysis
- Market Share Analysis, 2025
- By Closure Architecture
- By Barcoding Integration
- By Volumetric Capacity
- By Temperature Resilience
- By End User
- Italy
- Pricing Analysis
- Market Share Analysis, 2025
- By Closure Architecture
- By Barcoding Integration
- By Volumetric Capacity
- By Temperature Resilience
- By End User
- Spain
- Pricing Analysis
- Market Share Analysis, 2025
- By Closure Architecture
- By Barcoding Integration
- By Volumetric Capacity
- By Temperature Resilience
- By End User
- France
- Pricing Analysis
- Market Share Analysis, 2025
- By Closure Architecture
- By Barcoding Integration
- By Volumetric Capacity
- By Temperature Resilience
- By End User
- India
- Pricing Analysis
- Market Share Analysis, 2025
- By Closure Architecture
- By Barcoding Integration
- By Volumetric Capacity
- By Temperature Resilience
- By End User
- ASEAN
- Pricing Analysis
- Market Share Analysis, 2025
- By Closure Architecture
- By Barcoding Integration
- By Volumetric Capacity
- By Temperature Resilience
- By End User
- Australia and New Zealand
- Pricing Analysis
- Market Share Analysis, 2025
- By Closure Architecture
- By Barcoding Integration
- By Volumetric Capacity
- By Temperature Resilience
- By End User
- China
- Pricing Analysis
- Market Share Analysis, 2025
- By Closure Architecture
- By Barcoding Integration
- By Volumetric Capacity
- By Temperature Resilience
- By End User
- Japan
- Pricing Analysis
- Market Share Analysis, 2025
- By Closure Architecture
- By Barcoding Integration
- By Volumetric Capacity
- By Temperature Resilience
- By End User
- South Korea
- Pricing Analysis
- Market Share Analysis, 2025
- By Closure Architecture
- By Barcoding Integration
- By Volumetric Capacity
- By Temperature Resilience
- By End User
- Poland
- Pricing Analysis
- Market Share Analysis, 2025
- By Closure Architecture
- By Barcoding Integration
- By Volumetric Capacity
- By Temperature Resilience
- By End User
- Hungary
- Pricing Analysis
- Market Share Analysis, 2025
- By Closure Architecture
- By Barcoding Integration
- By Volumetric Capacity
- By Temperature Resilience
- By End User
- Türkiye
- Pricing Analysis
- Market Share Analysis, 2025
- By Closure Architecture
- By Barcoding Integration
- By Volumetric Capacity
- By Temperature Resilience
- By End User
- South Africa
- Pricing Analysis
- Market Share Analysis, 2025
- By Closure Architecture
- By Barcoding Integration
- By Volumetric Capacity
- By Temperature Resilience
- By End User
- Australia
- Pricing Analysis
- Market Share Analysis, 2025
- By Closure Architecture
- By Barcoding Integration
- By Volumetric Capacity
- By Temperature Resilience
- By End User
- Switzerland
- Pricing Analysis
- Market Share Analysis, 2025
- By Closure Architecture
- By Barcoding Integration
- By Volumetric Capacity
- By Temperature Resilience
- By End User
- United States
- Market Structure Analysis
- Competition Dashboard
- Competition Benchmarking
- Market Share Analysis of Top Players
- By Regional
- By Closure Architecture
- By Barcoding Integration
- By Volumetric Capacity
- By Temperature Resilience
- By End User
- Emerging Startups
- Innovation Benchmarking
- Competition Analysis
- Competition Deep Dive
- Sanofi SA
- Overview
- Product Portfolio
- Profitability by Market Segments
- Sales Footprint
- Strategy Overview
- Marketing Strategy
- Product Strategy
- Channel Strategy
- AstraZeneca plc
- Medtronic plc
- Boston Scientific Corporation
- Abbott Laboratories
- Thermo Fisher Scientific Inc.
- Danaher Corporation
- Roche Holding AG
- Novartis AG
- Merck and Co. Inc.
- Sanofi SA
- Case Studies
- Success Stories
- Recent Developments
- Competition Deep Dive
- Assumptions & Acronyms Used
List of Tables
- Table 1: Global Market Value (USD Million) Forecast by Region, 2021 to 2036
- Table 2: Global Market Value (USD Million) Forecast by Closure Architecture, 2021 to 2036
- Table 3: Global Market Value (USD Million) Forecast by Barcoding Integration, 2021 to 2036
- Table 4: Global Market Value (USD Million) Forecast by Volumetric Capacity, 2021 to 2036
- Table 5: Global Market Value (USD Million) Forecast by Temperature Resilience, 2021 to 2036
- Table 6: Global Market Value (USD Million) Forecast by End User, 2021 to 2036
- Table 7: North America Market Value (USD Million) Forecast by Country, 2021 to 2036
- Table 8: North America Market Value (USD Million) Forecast by Closure Architecture, 2021 to 2036
- Table 9: North America Market Value (USD Million) Forecast by Barcoding Integration, 2021 to 2036
- Table 10: North America Market Value (USD Million) Forecast by Volumetric Capacity, 2021 to 2036
- Table 11: North America Market Value (USD Million) Forecast by Temperature Resilience, 2021 to 2036
- Table 12: North America Market Value (USD Million) Forecast by End User, 2021 to 2036
- Table 13: Latin America Market Value (USD Million) Forecast by Country, 2021 to 2036
- Table 14: Latin America Market Value (USD Million) Forecast by Closure Architecture, 2021 to 2036
- Table 15: Latin America Market Value (USD Million) Forecast by Barcoding Integration, 2021 to 2036
- Table 16: Latin America Market Value (USD Million) Forecast by Volumetric Capacity, 2021 to 2036
- Table 17: Latin America Market Value (USD Million) Forecast by Temperature Resilience, 2021 to 2036
- Table 18: Latin America Market Value (USD Million) Forecast by End User, 2021 to 2036
- Table 19: Western Europe Market Value (USD Million) Forecast by Country, 2021 to 2036
- Table 20: Western Europe Market Value (USD Million) Forecast by Closure Architecture, 2021 to 2036
- Table 21: Western Europe Market Value (USD Million) Forecast by Barcoding Integration, 2021 to 2036
- Table 22: Western Europe Market Value (USD Million) Forecast by Volumetric Capacity, 2021 to 2036
- Table 23: Western Europe Market Value (USD Million) Forecast by Temperature Resilience, 2021 to 2036
- Table 24: Western Europe Market Value (USD Million) Forecast by End User, 2021 to 2036
- Table 25: Eastern Europe Market Value (USD Million) Forecast by Country, 2021 to 2036
- Table 26: Eastern Europe Market Value (USD Million) Forecast by Closure Architecture, 2021 to 2036
- Table 27: Eastern Europe Market Value (USD Million) Forecast by Barcoding Integration, 2021 to 2036
- Table 28: Eastern Europe Market Value (USD Million) Forecast by Volumetric Capacity, 2021 to 2036
- Table 29: Eastern Europe Market Value (USD Million) Forecast by Temperature Resilience, 2021 to 2036
- Table 30: Eastern Europe Market Value (USD Million) Forecast by End User, 2021 to 2036
- Table 31: East Asia Market Value (USD Million) Forecast by Country, 2021 to 2036
- Table 32: East Asia Market Value (USD Million) Forecast by Closure Architecture, 2021 to 2036
- Table 33: East Asia Market Value (USD Million) Forecast by Barcoding Integration, 2021 to 2036
- Table 34: East Asia Market Value (USD Million) Forecast by Volumetric Capacity, 2021 to 2036
- Table 35: East Asia Market Value (USD Million) Forecast by Temperature Resilience, 2021 to 2036
- Table 36: East Asia Market Value (USD Million) Forecast by End User, 2021 to 2036
- Table 37: South Asia and Pacific Market Value (USD Million) Forecast by Country, 2021 to 2036
- Table 38: South Asia and Pacific Market Value (USD Million) Forecast by Closure Architecture, 2021 to 2036
- Table 39: South Asia and Pacific Market Value (USD Million) Forecast by Barcoding Integration, 2021 to 2036
- Table 40: South Asia and Pacific Market Value (USD Million) Forecast by Volumetric Capacity, 2021 to 2036
- Table 41: South Asia and Pacific Market Value (USD Million) Forecast by Temperature Resilience, 2021 to 2036
- Table 42: South Asia and Pacific Market Value (USD Million) Forecast by End User, 2021 to 2036
- Table 43: Middle East and Africa Market Value (USD Million) Forecast by Country, 2021 to 2036
- Table 44: Middle East and Africa Market Value (USD Million) Forecast by Closure Architecture, 2021 to 2036
- Table 45: Middle East and Africa Market Value (USD Million) Forecast by Barcoding Integration, 2021 to 2036
- Table 46: Middle East and Africa Market Value (USD Million) Forecast by Volumetric Capacity, 2021 to 2036
- Table 47: Middle East and Africa Market Value (USD Million) Forecast by Temperature Resilience, 2021 to 2036
- Table 48: Middle East and Africa Market Value (USD Million) Forecast by End User, 2021 to 2036
List of Figures
- Figure 1: Global Market Pricing Analysis
- Figure 2: Global Market Value (USD Million) Forecast 2021-2036
- Figure 3: Global Market Value Share and BPS Analysis by Closure Architecture, 2026 and 2036
- Figure 4: Global Market Y-o-Y Growth Comparison by Closure Architecture, 2026-2036
- Figure 5: Global Market Attractiveness Analysis by Closure Architecture
- Figure 6: Global Market Value Share and BPS Analysis by Barcoding Integration, 2026 and 2036
- Figure 7: Global Market Y-o-Y Growth Comparison by Barcoding Integration, 2026-2036
- Figure 8: Global Market Attractiveness Analysis by Barcoding Integration
- Figure 9: Global Market Value Share and BPS Analysis by Volumetric Capacity, 2026 and 2036
- Figure 10: Global Market Y-o-Y Growth Comparison by Volumetric Capacity, 2026-2036
- Figure 11: Global Market Attractiveness Analysis by Volumetric Capacity
- Figure 12: Global Market Value Share and BPS Analysis by Temperature Resilience, 2026 and 2036
- Figure 13: Global Market Y-o-Y Growth Comparison by Temperature Resilience, 2026-2036
- Figure 14: Global Market Attractiveness Analysis by Temperature Resilience
- Figure 15: Global Market Value Share and BPS Analysis by End User, 2026 and 2036
- Figure 16: Global Market Y-o-Y Growth Comparison by End User, 2026-2036
- Figure 17: Global Market Attractiveness Analysis by End User
- Figure 18: Global Market Value (USD Million) Share and BPS Analysis by Region, 2026 and 2036
- Figure 19: Global Market Y-o-Y Growth Comparison by Region, 2026-2036
- Figure 20: Global Market Attractiveness Analysis by Region
- Figure 21: North America Market Incremental Dollar Opportunity, 2026-2036
- Figure 22: Latin America Market Incremental Dollar Opportunity, 2026-2036
- Figure 23: Western Europe Market Incremental Dollar Opportunity, 2026-2036
- Figure 24: Eastern Europe Market Incremental Dollar Opportunity, 2026-2036
- Figure 25: East Asia Market Incremental Dollar Opportunity, 2026-2036
- Figure 26: South Asia and Pacific Market Incremental Dollar Opportunity, 2026-2036
- Figure 27: Middle East and Africa Market Incremental Dollar Opportunity, 2026-2036
- Figure 28: North America Market Value Share and BPS Analysis by Country, 2026 and 2036
- Figure 29: North America Market Value Share and BPS Analysis by Closure Architecture, 2026 and 2036
- Figure 30: North America Market Y-o-Y Growth Comparison by Closure Architecture, 2026-2036
- Figure 31: North America Market Attractiveness Analysis by Closure Architecture
- Figure 32: North America Market Value Share and BPS Analysis by Barcoding Integration, 2026 and 2036
- Figure 33: North America Market Y-o-Y Growth Comparison by Barcoding Integration, 2026-2036
- Figure 34: North America Market Attractiveness Analysis by Barcoding Integration
- Figure 35: North America Market Value Share and BPS Analysis by Volumetric Capacity, 2026 and 2036
- Figure 36: North America Market Y-o-Y Growth Comparison by Volumetric Capacity, 2026-2036
- Figure 37: North America Market Attractiveness Analysis by Volumetric Capacity
- Figure 38: North America Market Value Share and BPS Analysis by Temperature Resilience, 2026 and 2036
- Figure 39: North America Market Y-o-Y Growth Comparison by Temperature Resilience, 2026-2036
- Figure 40: North America Market Attractiveness Analysis by Temperature Resilience
- Figure 41: North America Market Value Share and BPS Analysis by End User, 2026 and 2036
- Figure 42: North America Market Y-o-Y Growth Comparison by End User, 2026-2036
- Figure 43: North America Market Attractiveness Analysis by End User
- Figure 44: Latin America Market Value Share and BPS Analysis by Country, 2026 and 2036
- Figure 45: Latin America Market Value Share and BPS Analysis by Closure Architecture, 2026 and 2036
- Figure 46: Latin America Market Y-o-Y Growth Comparison by Closure Architecture, 2026-2036
- Figure 47: Latin America Market Attractiveness Analysis by Closure Architecture
- Figure 48: Latin America Market Value Share and BPS Analysis by Barcoding Integration, 2026 and 2036
- Figure 49: Latin America Market Y-o-Y Growth Comparison by Barcoding Integration, 2026-2036
- Figure 50: Latin America Market Attractiveness Analysis by Barcoding Integration
- Figure 51: Latin America Market Value Share and BPS Analysis by Volumetric Capacity, 2026 and 2036
- Figure 52: Latin America Market Y-o-Y Growth Comparison by Volumetric Capacity, 2026-2036
- Figure 53: Latin America Market Attractiveness Analysis by Volumetric Capacity
- Figure 54: Latin America Market Value Share and BPS Analysis by Temperature Resilience, 2026 and 2036
- Figure 55: Latin America Market Y-o-Y Growth Comparison by Temperature Resilience, 2026-2036
- Figure 56: Latin America Market Attractiveness Analysis by Temperature Resilience
- Figure 57: Latin America Market Value Share and BPS Analysis by End User, 2026 and 2036
- Figure 58: Latin America Market Y-o-Y Growth Comparison by End User, 2026-2036
- Figure 59: Latin America Market Attractiveness Analysis by End User
- Figure 60: Western Europe Market Value Share and BPS Analysis by Country, 2026 and 2036
- Figure 61: Western Europe Market Value Share and BPS Analysis by Closure Architecture, 2026 and 2036
- Figure 62: Western Europe Market Y-o-Y Growth Comparison by Closure Architecture, 2026-2036
- Figure 63: Western Europe Market Attractiveness Analysis by Closure Architecture
- Figure 64: Western Europe Market Value Share and BPS Analysis by Barcoding Integration, 2026 and 2036
- Figure 65: Western Europe Market Y-o-Y Growth Comparison by Barcoding Integration, 2026-2036
- Figure 66: Western Europe Market Attractiveness Analysis by Barcoding Integration
- Figure 67: Western Europe Market Value Share and BPS Analysis by Volumetric Capacity, 2026 and 2036
- Figure 68: Western Europe Market Y-o-Y Growth Comparison by Volumetric Capacity, 2026-2036
- Figure 69: Western Europe Market Attractiveness Analysis by Volumetric Capacity
- Figure 70: Western Europe Market Value Share and BPS Analysis by Temperature Resilience, 2026 and 2036
- Figure 71: Western Europe Market Y-o-Y Growth Comparison by Temperature Resilience, 2026-2036
- Figure 72: Western Europe Market Attractiveness Analysis by Temperature Resilience
- Figure 73: Western Europe Market Value Share and BPS Analysis by End User, 2026 and 2036
- Figure 74: Western Europe Market Y-o-Y Growth Comparison by End User, 2026-2036
- Figure 75: Western Europe Market Attractiveness Analysis by End User
- Figure 76: Eastern Europe Market Value Share and BPS Analysis by Country, 2026 and 2036
- Figure 77: Eastern Europe Market Value Share and BPS Analysis by Closure Architecture, 2026 and 2036
- Figure 78: Eastern Europe Market Y-o-Y Growth Comparison by Closure Architecture, 2026-2036
- Figure 79: Eastern Europe Market Attractiveness Analysis by Closure Architecture
- Figure 80: Eastern Europe Market Value Share and BPS Analysis by Barcoding Integration, 2026 and 2036
- Figure 81: Eastern Europe Market Y-o-Y Growth Comparison by Barcoding Integration, 2026-2036
- Figure 82: Eastern Europe Market Attractiveness Analysis by Barcoding Integration
- Figure 83: Eastern Europe Market Value Share and BPS Analysis by Volumetric Capacity, 2026 and 2036
- Figure 84: Eastern Europe Market Y-o-Y Growth Comparison by Volumetric Capacity, 2026-2036
- Figure 85: Eastern Europe Market Attractiveness Analysis by Volumetric Capacity
- Figure 86: Eastern Europe Market Value Share and BPS Analysis by Temperature Resilience, 2026 and 2036
- Figure 87: Eastern Europe Market Y-o-Y Growth Comparison by Temperature Resilience, 2026-2036
- Figure 88: Eastern Europe Market Attractiveness Analysis by Temperature Resilience
- Figure 89: Eastern Europe Market Value Share and BPS Analysis by End User, 2026 and 2036
- Figure 90: Eastern Europe Market Y-o-Y Growth Comparison by End User, 2026-2036
- Figure 91: Eastern Europe Market Attractiveness Analysis by End User
- Figure 92: East Asia Market Value Share and BPS Analysis by Country, 2026 and 2036
- Figure 93: East Asia Market Value Share and BPS Analysis by Closure Architecture, 2026 and 2036
- Figure 94: East Asia Market Y-o-Y Growth Comparison by Closure Architecture, 2026-2036
- Figure 95: East Asia Market Attractiveness Analysis by Closure Architecture
- Figure 96: East Asia Market Value Share and BPS Analysis by Barcoding Integration, 2026 and 2036
- Figure 97: East Asia Market Y-o-Y Growth Comparison by Barcoding Integration, 2026-2036
- Figure 98: East Asia Market Attractiveness Analysis by Barcoding Integration
- Figure 99: East Asia Market Value Share and BPS Analysis by Volumetric Capacity, 2026 and 2036
- Figure 100: East Asia Market Y-o-Y Growth Comparison by Volumetric Capacity, 2026-2036
- Figure 101: East Asia Market Attractiveness Analysis by Volumetric Capacity
- Figure 102: East Asia Market Value Share and BPS Analysis by Temperature Resilience, 2026 and 2036
- Figure 103: East Asia Market Y-o-Y Growth Comparison by Temperature Resilience, 2026-2036
- Figure 104: East Asia Market Attractiveness Analysis by Temperature Resilience
- Figure 105: East Asia Market Value Share and BPS Analysis by End User, 2026 and 2036
- Figure 106: East Asia Market Y-o-Y Growth Comparison by End User, 2026-2036
- Figure 107: East Asia Market Attractiveness Analysis by End User
- Figure 108: South Asia and Pacific Market Value Share and BPS Analysis by Country, 2026 and 2036
- Figure 109: South Asia and Pacific Market Value Share and BPS Analysis by Closure Architecture, 2026 and 2036
- Figure 110: South Asia and Pacific Market Y-o-Y Growth Comparison by Closure Architecture, 2026-2036
- Figure 111: South Asia and Pacific Market Attractiveness Analysis by Closure Architecture
- Figure 112: South Asia and Pacific Market Value Share and BPS Analysis by Barcoding Integration, 2026 and 2036
- Figure 113: South Asia and Pacific Market Y-o-Y Growth Comparison by Barcoding Integration, 2026-2036
- Figure 114: South Asia and Pacific Market Attractiveness Analysis by Barcoding Integration
- Figure 115: South Asia and Pacific Market Value Share and BPS Analysis by Volumetric Capacity, 2026 and 2036
- Figure 116: South Asia and Pacific Market Y-o-Y Growth Comparison by Volumetric Capacity, 2026-2036
- Figure 117: South Asia and Pacific Market Attractiveness Analysis by Volumetric Capacity
- Figure 118: South Asia and Pacific Market Value Share and BPS Analysis by Temperature Resilience, 2026 and 2036
- Figure 119: South Asia and Pacific Market Y-o-Y Growth Comparison by Temperature Resilience, 2026-2036
- Figure 120: South Asia and Pacific Market Attractiveness Analysis by Temperature Resilience
- Figure 121: South Asia and Pacific Market Value Share and BPS Analysis by End User, 2026 and 2036
- Figure 122: South Asia and Pacific Market Y-o-Y Growth Comparison by End User, 2026-2036
- Figure 123: South Asia and Pacific Market Attractiveness Analysis by End User
- Figure 124: Middle East and Africa Market Value Share and BPS Analysis by Country, 2026 and 2036
- Figure 125: Middle East and Africa Market Value Share and BPS Analysis by Closure Architecture, 2026 and 2036
- Figure 126: Middle East and Africa Market Y-o-Y Growth Comparison by Closure Architecture, 2026-2036
- Figure 127: Middle East and Africa Market Attractiveness Analysis by Closure Architecture
- Figure 128: Middle East and Africa Market Value Share and BPS Analysis by Barcoding Integration, 2026 and 2036
- Figure 129: Middle East and Africa Market Y-o-Y Growth Comparison by Barcoding Integration, 2026-2036
- Figure 130: Middle East and Africa Market Attractiveness Analysis by Barcoding Integration
- Figure 131: Middle East and Africa Market Value Share and BPS Analysis by Volumetric Capacity, 2026 and 2036
- Figure 132: Middle East and Africa Market Y-o-Y Growth Comparison by Volumetric Capacity, 2026-2036
- Figure 133: Middle East and Africa Market Attractiveness Analysis by Volumetric Capacity
- Figure 134: Middle East and Africa Market Value Share and BPS Analysis by Temperature Resilience, 2026 and 2036
- Figure 135: Middle East and Africa Market Y-o-Y Growth Comparison by Temperature Resilience, 2026-2036
- Figure 136: Middle East and Africa Market Attractiveness Analysis by Temperature Resilience
- Figure 137: Middle East and Africa Market Value Share and BPS Analysis by End User, 2026 and 2036
- Figure 138: Middle East and Africa Market Y-o-Y Growth Comparison by End User, 2026-2036
- Figure 139: Middle East and Africa Market Attractiveness Analysis by End User
- Figure 140: Global Market - Tier Structure Analysis
- Figure 141: Global Market - Company Share Analysis
Frequently Asked Questions
How big is the cryotubes market in 2026, and what is forecast for 2036?
FMI estimates that the global cryotubes market size stood at USD 631.0 million in 2025 and reached USD 656.2 million in 2026. Overall industry valuation is on track to hit USD 990.2 million by 2036 as genomic biobanks and cell-therapy plants expand automated vapor-phase storage.
What is the CAGR for the cryotubes market from 2026 to 2036?
The cryotubes sector is projected to expand at a 4.2% CAGR over the 2026 to 2036 window, adding USD 334.0 million in net market value across biopharmaceutical and academic biorepository channels.
Which closure architecture segment leads the cryotubes market?
External Thread Cryotubes with Silicone O-Ring hold 57.6% of closure architecture demand in 2026 because external cap threads prevent sample-to-thread contact and simplify robotic decapping.
Which barcoding integration segment leads the cryotubes market?
2D Laser-Etched Bottom DataMatrix Barcodes represent 44.7% of the barcoding category in 2026 as flatbed optical scanners read entire 96-well SBS racks simultaneously without frost interference.
Which country has a notable growth outlook during the assessment period?
Canada leads national expansion projections at a 4.7% CAGR through 2036, supported by federal biomanufacturing investments and automated stem-cell and cancer biobanks.
Who are the key players in the market?
Thermo Fisher Scientific Inc. and Danaher Corporation with Abbott Laboratories and Roche Holding AG lead across cryogenic consumables, bioprocessing, and diagnostic specimen workflows. Sanofi SA and AstraZeneca plc with Novartis AG, Merck and Co Inc, Medtronic plc and Boston Scientific Corporation anchor cGMP cell banking and clinical systems.
Preview the report firsthand - request a free sample
Get SampleGet the brochure for pricing and purchase details.
Get PDF
