Reports

- Global Locations -

Headquarters

Future Market Insights, Inc.

Christiana Corporate, 200
Continental Drive, Suite 401,
Newark, Delaware - 19713,
United States

T: +1-845-579-5705

Americas

Future Market Insights, Inc.

616 Corporate Way, Suite 2-9018,
Valley Cottage, NY 10989, United States

T: +1-347-918-3531

MEA

Future Market Insights

1602-6 Jumeirah Bay X2 Tower, Plot No: JLT-PH2-X2A,
Jumeirah Lakes Towers, Dubai,
United Arab Emirates

Europe

Future Market Insights

3rd Floor, 207 Regent Street,
W1B 3HH London
United Kingdom

T: + 44 (0) 20 8123 9659
D: +44 (0) 20 3287 4268

Asia Pacific

Future Market Insights

IndiaLand Global Tech Park, Unit UG-1, Behind Grand HighStreet, Phase 1, Hinjawadi, MH, Pune – 411057, India

Polymer-based Prefilled Syringe Market Snapshot (2023 to 2033)

The global polymer-based prefilled syringe market size is expected to be valued at US$ 7.2 billion in 2023. Growing demand for vaccines, bolsters the overall scope for polymer-based prefilled syringe market, which is projected to grow at a CAGR of 9.0% between 2023 and 2033, totaling around US$ 17.1 billion by 2033.

Data Points Key Statistics
Polymer-based Prefilled Syringe Market Value 2023 US$ 7.2 billion
Polymer-based Prefilled Syringe Market Projected Value (2033) US$ 17.1 billion
Polymer-based Prefilled Syringe Market CAGR (2023 to 2033) 9.0%

The rising demand for biologics is a significant factor driving the growth of polymer-based prefilled syringes in the healthcare industry. Biologics are a class of therapeutic drugs derived from living organisms, such as proteins, antibodies, and vaccines, that are used to treat a wide range of chronic and complex diseases, including cancer, autoimmune disorders, and infectious diseases.

Accurate and safe delivery of biologics is crucial for their efficacy and patient outcomes. Biologics, unlike traditional small-molecule drugs are large and complex molecules that can be sensitive to external factors such as temperature, pH, and mechanical stress. The drugs must be administered with precision and care, to ensure their stability and effectiveness.

Polymer materials, such as cyclic olefin copolymer (COC) and cyclic olefin polymer (COP), used in prefilled syringes offer excellent compatibility with biologics. They have low protein adsorption and minimal interaction with the drug, reducing the risk of drug degradation and contamination during storage and administration. Polymer-based materials are inert and do not release extractable substances that could interact with the biologic drug, which ensures that the drug's purity and efficacy remain intact throughout its shelf life.

Compared to glass syringes, polymer-based prefilled syringes are less prone to breakage, which is essential when handling sensitive biologic drugs. The lower risk of breakage also contributes to reduced wastage and improved patient safety.

Don't pay for what you don't need

Customize your report by selecting specific countries or regions and save 30%!

Global Polymer-based Prefilled Syringe Market Historical Analysis (2018 to 2022) Vs. Forecast Outlook (2023 to 2033)

The global demand for polymer-based prefilled syringe is projected to increase at a CAGR of 5.5% during the forecast period between 2018 and 2022, reaching a total of US$ 17.1 billion in 2033.

According to Future Market Insights, a market research and competitive intelligence provider, the polymer-based prefilled syringe market was valued at US$ 6.6 billion in 2022.

The growing focus on self-administration of medications is a significant trend in the healthcare industry, driven by several factors, including the rising prevalence of chronic diseases and the increasing aging population. Patients with chronic conditions, such as diabetes, rheumatoid arthritis, multiple sclerosis, and certain autoimmune disorders, often require regular injections of medications to manage their conditions effectively.

In recent years, there has been a shift towards empowering patients to take control of their healthcare by enabling them to administer medications themselves. Self-administration offers numerous benefits to patients, including increased independence, reduced healthcare costs, and improved quality of life. Polymer-based prefilled syringes play a crucial role in facilitating self-injection at home due to their user-friendly design and features:

Polymer-based prefilled syringes are designed with clear and easy-to-read dosing scales, making it simple for patients to measure and administer the correct dosage of the medication. The feature is especially important for patients with visual impairments or limited dexterity, as it ensures accurate dosing and reduces the risk of dosing errors.

Many polymer-based prefilled syringes are engineered with ergonomic features, such as finger grips and smooth plunger movement, to enhance the ease of use. The design elements make the syringes comfortable to handle and enable patients to administer injections with minimal effort and discomfort.

What is Primarily Driving the Market for Polymer-based Prefilled Syringe?

Advancements in Polymer Technology Sales is Likely to be Beneficial for Market Growth

Advancements in polymer technology have revolutionized the design and manufacturing of prefilled syringes, leading to the development of high-performance syringe systems that offer numerous advantages in drug delivery and patient safety. The innovations have significantly improved the compatibility, performance, and reliability of polymer-based prefilled syringes, making them a preferred choice for pharmaceutical manufacturers and healthcare providers.

Drug developers are introducing complex and sensitive biologics, vaccines, and other medications, with the continuous evolution of pharmaceutical formulations. The advanced drug formulations require specialized packaging solutions to maintain their stability and efficacy. Polymer technology advancements have allowed for the creation of syringes with materials that are highly compatible with a wide range of drugs, including biologics, vaccines, monoclonal antibodies, and high-viscosity formulations. The syringes minimize the risk of drug interactions, degradation, or adsorption, ensuring that the drug remains intact and effective during storage and administration.

Extractables and leachables refer to the substances that may be released from the syringe material into the drug product over time. Advanced polymer technologies have enabled the development of syringe materials with reduced levels of extractables and leachables. The advancements ensure that the drug's purity and stability are preserved, reducing the potential for adverse reactions or drug contamination. Pharmaceutical manufacturers can now confidently use polymer-based prefilled syringes, knowing that the syringe material will not compromise the drug's quality or safety.

Expansion of Biopharmaceutical Pipeline to Fuel the Market Growth

The expansion of the biopharmaceutical pipeline is a major driver of the increasing demand for specialized and advanced prefilled syringes. Biopharmaceuticals are a class of drugs produced using living organisms or biological processes, including monoclonal antibodies, vaccines, gene therapies, and cell-based treatments. The innovative therapies offer promising solutions for various chronic and life-threatening diseases, such as cancer, autoimmune disorders, and genetic disorders. The need for suitable delivery systems, like prefilled syringes, becomes critical, as more biopharmaceuticals enter clinical development and receive regulatory approval.

Biopharmaceuticals are often complex and sensitive drugs that require specialized handling and delivery systems. They may be susceptible to degradation, denaturation, or instability when exposed to certain conditions, such as light, oxygen, or temperature variations. Prefilled syringes made from advanced polymer materials are designed to provide excellent protection against these environmental factors, ensuring the stability and potency of biopharmaceuticals throughout their shelf life.

Biopharmaceuticals are manufactured using living cells or genetic material, making them more susceptible to contamination from external sources. Prefilled syringes with advanced polymer materials offer excellent barrier properties, minimizing the risk of microbial or particulate contamination during drug administration, which is especially crucial for biopharmaceuticals intended for chronic therapies, as contamination could lead to serious health risks for patients.

Ismail Sutaria
Ismail Sutaria

Principal Consultant

Talk to Analyst

Find your sweet spots for generating winning opportunities in this market.

Category-wise Insights

Which is the Most Desired Application?

Vaccine and Other Biotech Drugs to Take the Lion’s Share

By application, vaccines and other biotech drugs segment is estimated to be the leading segment at a CAGR of 8.9% during the forecast period.

There is a growing emphasis on vaccination programs globally, driven by the need to prevent and control infectious diseases. Polymer-based prefilled syringes are well-suited for vaccines as they offer accurate dosing and reduce the risk of dosing errors. Governments and healthcare organizations worldwide are actively promoting vaccination campaigns, which is propelling the demand for prefilled syringes for vaccine administration.

Biologic drugs, including monoclonal antibodies, insulin, and other biotech drugs, are becoming increasingly prevalent in the treatment of various chronic and complex diseases. Polymer-based prefilled syringes provide a reliable and convenient way to store and deliver these sensitive biologic medications, ensuring their stability and efficacy.

Prefilled syringes offer significant advantages in terms of convenience and ease of use for patients. For self-administered medications, such as in the case of diabetes and some biologic drugs, prefilled syringes provide a user-friendly solution, improving patient compliance and overall treatment outcomes.

Polymer-based prefilled syringes are manufactured under strict quality control standards, reducing the risk of contamination and enhancing the safety of drug administration, which is particularly crucial for vaccines and biologic drugs, where product integrity is essential.

Why the Hospitals Segment is considered to be the Most Lucrative Segment in Polymer-based Prefilled Syringe Market?

Hospitals to Take the Lion’s Share

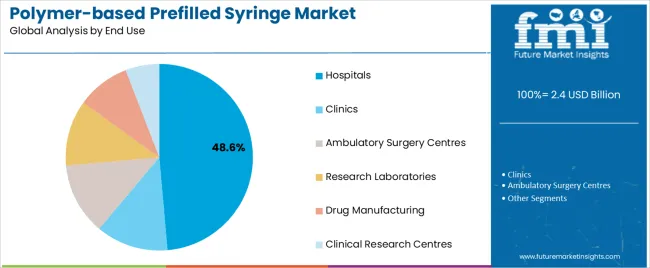
Based on the end-use, the hospitals segment holds the largest share of the market. The segment is expected to hold a CAGR of 8.8% during the forecast period.

Hospitals are primary healthcare facilities where a significant number of patients are admitted for various medical conditions and treatments. The growing number of hospitalizations increases the demand for prefilled syringes as they offer a convenient and efficient drug delivery method for healthcare professionals.

Hospitals prioritize the use of ready-to-use medical products to streamline their workflow and save time. Polymer-based prefilled syringes eliminate the need for manual drug preparation, reducing the risk of dosing errors and ensuring accurate and consistent drug administration.

In a hospital setting, quick and accurate drug administration is crucial for patient care. Prefilled syringes provide a reliable and precise method for delivering medications, especially during emergency situations or when rapid interventions are required.

Prefilled syringes are manufactured in a controlled environment, minimizing the risk of contamination and maintaining the sterility of medications. Hospitals prioritize the safety of patients, and prefilled syringes contribute to infection prevention and control.

Comparative View of the Adjacent Market

Polymer-based Prefilled Syringe Market:

Attributes Polymer-based Prefilled Syringe Market
CAGR (2023 to 2033) 9.0%
Market Value 2023 US$ 7.2 billion
Growth Factor Growing home healthcare, is enhancing the market growth.
Future Opportunities Drug patent expirations, are expected to create lucrative opportunities in the near future.
Market trends Advantages in biologics administration, is also expected to augment the market growth.

Syringes Market:

Attributes Syringes Market
CAGR (2023 to 2033) 9.2%
Market Value 2023 US$ 22.4 billion
Growth Factor Increasing prevalence of chronic diseases, is enhancing the market growth.
Future Opportunities Growing vaccination programs, is expected to create lucrative opportunities in the near future.
Market trends Technological advancements, is also expected to augment the market growth.

Prefilled Syringes Drug Molecules Market:

Attributes Prefilled Syringes Drug Molecules Market
CAGR (2023 to 2033) 5.6%
Market Value 2023 US$ 59.1 billion
Growth Factor Rising demand for self-injection devices, is boosting the market growth.
Future Opportunities Growing biologics market, is expected to create lucrative opportunities in the near future.
Market trends Advantages of prefilled syringes, is a major trend that is expected to augment the market growth.

Get the data you need at a Fraction of the cost

Personalize your report by choosing insights you need
and save 40%!

Region-wise Insights

What is the Current Scenario of the Polymer-based Prefilled Syringe Market in Asia?

Rapidly Increasing Aging Population to Boost the Market Growth

Asia is witnessing a rapid increase in its aging population. Elderly individuals often require frequent medication, and prefilled syringes offer a convenient and easy-to-use drug delivery system for healthcare providers and patients. The rising elderly population is expected to drive the demand for polymer-based prefilled syringes in the region.

The prevalence of chronic diseases, such as diabetes, cardiovascular diseases, and rheumatoid arthritis, is on the rise in Asia. Prefilled syringes are commonly used for the administration of chronic disease medications, providing accurate dosing and reducing the risk of errors in self-injection. The rising burden of chronic illnesses is expected to fuel the demand for prefilled syringes in the region.

Asia has witnessed a surge in the adoption of biologic drugs and biosimilars. Prefilled syringes are well-suited for the delivery of biologics, which are often sensitive to environmental factors. The increasing demand for biologic therapies is anticipated to drive the market for polymer-based prefilled syringes in the region.

Several countries in South Asia and Pacific as well as East Asia are implementing healthcare reforms and initiatives to improve access to quality healthcare services. Government support for the adoption of advanced medical technologies and devices, including prefilled syringes, is likely to boost market growth. The region is expected to hold a CAGR of 8.9% over the analysis period.

How is the North America Polymer-based Prefilled Syringe Market Faring?

Patient Safety & Convenience to Boost the Regional Market

North America is a hub for the biopharmaceutical industry, with numerous pharmaceutical and biotech companies engaged in the development of biologic drugs and biosimilars. Prefilled syringes are well-suited for the administration of these complex and sensitive medications. The expansion of the biopharmaceutical industry is likely to fuel the adoption of polymer-based prefilled syringes.

Patient safety and convenience are paramount in the healthcare sector. Polymer-based prefilled syringes with safety features, such as needlestick prevention mechanisms and tamper-evident caps, are becoming increasingly popular among healthcare providers and patients alike. The safety features reduce the risk of needlestick injuries and enhance patient compliance with self-administered medications.

There is a growing trend towards home-based healthcare in North America, driven by the aging population and the desire for more convenient healthcare solutions. Prefilled syringes enable patients to self-administer medications at home, reducing the need for frequent hospital visits and improving patient outcomes.

Advancements in polymer-based materials and manufacturing technologies have led to the development of high-quality prefilled syringes with improved barrier properties, reduced leachables, and enhanced drug compatibility. The technological advancements are expected to drive the adoption of polymer-based prefilled syringes in the region. The region is expected to hold a CAGR of 8.8% over the analysis period.

The Start-Up Ecosystem: How key Players are opening Frontiers for Future Growth?

Polymer-based prefilled syringe market startup players are adopting various marketing strategies such as new product launches, geographical expansion, merger and acquisitions, partnerships and collaboration to create a larger customer base. For instance,

  • Founded in 2019, SoluBlend Technologies is a United States-based startup that specializes in the development of advanced polymer-based drug delivery systems, including prefilled syringes with unique formulations for specific medical applications.
  • Started in 2017, ONdrugDelivery is a United Kingdom-based startup that specializes in providing a platform for drug delivery innovation, including polymer-based prefilled syringes, through conferences, publications, and industry partnerships.
  • Established in 2017, Sorano Pharma is a Japanese startup that is dedicated to developing innovative pharmaceuticals and medical devices, including polymer-based prefilled syringes.
  • Founded in 2016, PDC PharmaConnect is a Canadian startup that focuses on developing connected drug delivery systems, including polymer-based prefilled syringes with smart features for data monitoring and patient adherence.

Competitive Landscape

Key players in the polymer-based prefilled syringe market are strongly focusing on profit generation from their existing product portfolios along while exploring potential new applications. The players are emphasizing on increasing their polymer-based prefilled syringe production capacities, to cater to the demand from numerous end use industries. Prominent players are also pushing for geographical expansion to decrease the dependency on imported polymer-based prefilled syringe.

Recent Developments:

  • In May 2023, Unilife Corporation announced the launch of its new Unifill prefilled syringe, which is a single-use, polymer-based syringe that is designed to be more patient-friendly and safer than traditional syringes. The syringe has a unique design that makes it easier to insert the needle, and it also has a built-in safety feature that prevents accidental needlestick injuries.
  • In April 2023, SHL Medical announced the launch of its new Sure-Ject prefilled syringe, which is also a single-use, polymer-based syringe.
  • In March 2023, West Pharmaceutical Services Inc. announced the launch of its new Safe-Lok prefilled syringe.
  • In February 2023, Nipro Corporation announced the launch of its new Nipro Injecta Safe prefilled syringe.

Scope of the Report

Attribute Details
Forecast Period 2023 to 2033
Historical Data Available for 2018 to 2022
Market Analysis USD billion for value and Tons for Volume
Key Regions Covered North America, Latin America, Western Europe, Eastern Europe, South Asia & Pacific, East Asia, and Middle East & Africa
Key Countries Covered United States, Canada, Brazil, Mexico, Germany, U.K., France, Spain, Italy, Poland, Russia, Czech Republic, Romania, India, Bangladesh, Australia, New Zealand, China, Japan, South Korea, GCC Countries, South Africa, Israel.
Key Segments Covered Application, End-Use, Region
Key Companies Profiled
  • Ajinomoto Bio-Pharma, Inc.
  • Aptar Pharma (India) Pvt. Ltd.
  • Baxter International Inc.
  • Biocorp
  • Enable Injections, Inc.
  • Nipro Corp.
  • SHL Medical
  • Shandong Weigao Group
  • Stevanato Group
  • Unilife Corporation
Report Coverage Market Forecast, brand share analysis, competition intelligence, DROT analysis, Market Dynamics and Challenges, Strategic Growth Initiatives
Customization & Pricing Available upon Request

Key Segments Profiled In The Global Polymer-based Prefilled Syringe Market

Application:

  • Anaphylaxis
  • Rheumatoid Arthritis
  • Diabetes
  • Others
    • Vaccines and Other Biotech Drugs

End-Use

  • Hospitals
  • Mail Order Pharmacies
  • Ambulatory Surgery Centers

Region:

  • North America
  • Latin America
  • Western Europe
  • Eastern Europe
  • South Asia and Pacific
  • East Asia
  • Middle East and Africa (MEA)

Frequently Asked Questions

How the Environment Testing Inspection and Certification Market Developed in the Past?

From 2018 to 2022, the global market exhibited 4.3% CAGR.

What is the Projected Size of the Polymer-based Prefilled Syringe Market by 2033?

The global market size is expected to reach US$ 17.1 billion by 2033.

Who are the Prominent Market Players in the Polymer-based Prefilled Syringe Market?

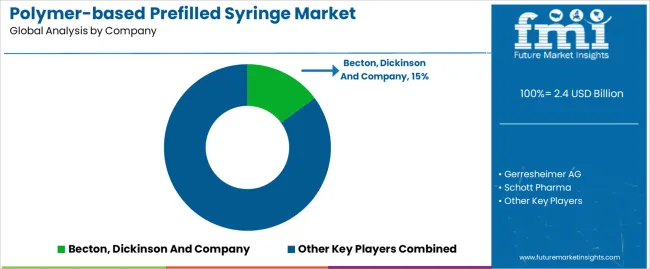
Biocorp and SHL Medical are the prominent key players.

What is the Growth Potential of the Polymer-based Prefilled Syringe Market?

The global market is estimated to secure a CAGR of 9% through 2033.

What Limits the Growth Potential of the Polymer-based Prefilled Syringe Market?

Expensive treatment costs are likely to limit market growth.

Table of Content

1. Executive Summary

    1.1. Global Market Outlook

    1.2. Demand-side Trends

    1.3. Supply-side Trends

    1.4. Technology Roadmap Analysis

    1.5. Analysis and Recommendations

2. Market Overview

    2.1. Market Coverage / Taxonomy

    2.2. Market Definition / Scope / Limitations

3. Market Background

    3.1. Market Dynamics

        3.1.1. Drivers

        3.1.2. Restraints

        3.1.3. Opportunity

        3.1.4. Trends

    3.2. Scenario Forecast

        3.2.1. Demand in Optimistic Scenario

        3.2.2. Demand in Likely Scenario

        3.2.3. Demand in Conservative Scenario

    3.3. Opportunity Map Analysis

    3.4. Product Life Cycle Analysis

    3.5. Supply Chain Analysis

        3.5.1. Supply Side Participants and their Roles

            3.5.1.1. Producers

            3.5.1.2. Mid-Level Participants (Traders/ Agents/ Brokers)

            3.5.1.3. Wholesalers and Distributors

        3.5.2. Value Added and Value Created at Node in the Supply Chain

        3.5.3. List of Raw Material Suppliers

        3.5.4. List of Existing and Potential Buyer’s

    3.6. Investment Feasibility Matrix

    3.7. Value Chain Analysis

        3.7.1. Profit Margin Analysis

        3.7.2. Wholesalers and Distributors

        3.7.3. Retailers

    3.8. PESTLE and Porter’s Analysis

    3.9. Regulatory Landscape

        3.9.1. By Key Regions

        3.9.2. By Key Countries

    3.10. Regional Parent Market Outlook

    3.11. Production and Consumption Statistics

    3.12. Import and Export Statistics

4. Global Market Analysis 2018 to 2022 and Forecast, 2023 to 2033

    4.1. Historical Market Size Value (US$ Million) & Volume (Units) Analysis, 2018 to 2022

    4.2. Current and Future Market Size Value (US$ Million) & Volume (Units) Projections, 2023 to 2033

        4.2.1. Y-o-Y Growth Trend Analysis

        4.2.2. Absolute $ Opportunity Analysis

5. Global Market Analysis 2018 to 2022 and Forecast 2023 to 2033, By Product Type

    5.1. Introduction / Key Findings

    5.2. Historical Market Size Value (US$ Million) & Volume (Units) Analysis By Product Type, 2018 to 2022

    5.3. Current and Future Market Size Value (US$ Million) & Volume (Units) Analysis and Forecast By Product Type, 2023 to 2033

        5.3.1. Disposable

        5.3.2. Reusable

    5.4. Y-o-Y Growth Trend Analysis By Product Type, 2018 to 2022

    5.5. Absolute $ Opportunity Analysis By Product Type, 2023 to 2033

6. Global Market Analysis 2018 to 2022 and Forecast 2023 to 2033, By Function Type

    6.1. Introduction / Key Findings

    6.2. Historical Market Size Value (US$ Million) & Volume (Units) Analysis By Function Type, 2018 to 2022

    6.3. Current and Future Market Size Value (US$ Million) & Volume (Units) Analysis and Forecast By Function Type, 2023 to 2033

        6.3.1. Single-Chambered Prefilled Syringes

        6.3.2. Dual/Multi-Chambered Prefilled Syringes

    6.4. Y-o-Y Growth Trend Analysis By Function Type, 2018 to 2022

    6.5. Absolute $ Opportunity Analysis By Function Type, 2023 to 2033

7. Global Market Analysis 2018 to 2022 and Forecast 2023 to 2033, By End Use

    7.1. Introduction / Key Findings

    7.2. Historical Market Size Value (US$ Million) & Volume (Units) Analysis By End Use, 2018 to 2022

    7.3. Current and Future Market Size Value (US$ Million) & Volume (Units) Analysis and Forecast By End Use, 2023 to 2033

        7.3.1. Hospitals

        7.3.2. Research Laboratories

        7.3.3. Drug Manufacturing

        7.3.4. Clinical Research

    7.4. Y-o-Y Growth Trend Analysis By End Use, 2018 to 2022

    7.5. Absolute $ Opportunity Analysis By End Use, 2023 to 2033

8. Global Market Analysis 2018 to 2022 and Forecast 2023 to 2033, By Region

    8.1. Introduction

    8.2. Historical Market Size Value (US$ Million) & Volume (Units) Analysis By Region, 2018 to 2022

    8.3. Current Market Size Value (US$ Million) & Volume (Units) Analysis and Forecast By Region, 2023 to 2033

        8.3.1. North America

        8.3.2. Latin America

        8.3.3. Western Europe

        8.3.4. Eastern Europe

        8.3.5. South Asia and Pacific

        8.3.6. East Asia

        8.3.7. Middle East and Africa

    8.4. Market Attractiveness Analysis By Region

9. North America Market Analysis 2018 to 2022 and Forecast 2023 to 2033, By Country

    9.1. Historical Market Size Value (US$ Million) & Volume (Units) Trend Analysis By Market Taxonomy, 2018 to 2022

    9.2. Market Size Value (US$ Million) & Volume (Units) Forecast By Market Taxonomy, 2023 to 2033

        9.2.1. By Country

            9.2.1.1. USA

            9.2.1.2. Canada

        9.2.2. By Product Type

        9.2.3. By Function Type

        9.2.4. By End Use

    9.3. Market Attractiveness Analysis

        9.3.1. By Country

        9.3.2. By Product Type

        9.3.3. By Function Type

        9.3.4. By End Use

    9.4. Key Takeaways

10. Latin America Market Analysis 2018 to 2022 and Forecast 2023 to 2033, By Country

    10.1. Historical Market Size Value (US$ Million) & Volume (Units) Trend Analysis By Market Taxonomy, 2018 to 2022

    10.2. Market Size Value (US$ Million) & Volume (Units) Forecast By Market Taxonomy, 2023 to 2033

        10.2.1. By Country

            10.2.1.1. Brazil

            10.2.1.2. Mexico

            10.2.1.3. Rest of Latin America

        10.2.2. By Product Type

        10.2.3. By Function Type

        10.2.4. By End Use

    10.3. Market Attractiveness Analysis

        10.3.1. By Country

        10.3.2. By Product Type

        10.3.3. By Function Type

        10.3.4. By End Use

    10.4. Key Takeaways

11. Western Europe Market Analysis 2018 to 2022 and Forecast 2023 to 2033, By Country

    11.1. Historical Market Size Value (US$ Million) & Volume (Units) Trend Analysis By Market Taxonomy, 2018 to 2022

    11.2. Market Size Value (US$ Million) & Volume (Units) Forecast By Market Taxonomy, 2023 to 2033

        11.2.1. By Country

            11.2.1.1. Germany

            11.2.1.2. UK

            11.2.1.3. France

            11.2.1.4. Spain

            11.2.1.5. Italy

            11.2.1.6. Rest of Western Europe

        11.2.2. By Product Type

        11.2.3. By Function Type

        11.2.4. By End Use

    11.3. Market Attractiveness Analysis

        11.3.1. By Country

        11.3.2. By Product Type

        11.3.3. By Function Type

        11.3.4. By End Use

    11.4. Key Takeaways

12. Eastern Europe Market Analysis 2018 to 2022 and Forecast 2023 to 2033, By Country

    12.1. Historical Market Size Value (US$ Million) & Volume (Units) Trend Analysis By Market Taxonomy, 2018 to 2022

    12.2. Market Size Value (US$ Million) & Volume (Units) Forecast By Market Taxonomy, 2023 to 2033

        12.2.1. By Country

            12.2.1.1. Poland

            12.2.1.2. Russia

            12.2.1.3. Czech Republic

            12.2.1.4. Romania

            12.2.1.5. Rest of Eastern Europe

        12.2.2. By Product Type

        12.2.3. By Function Type

        12.2.4. By End Use

    12.3. Market Attractiveness Analysis

        12.3.1. By Country

        12.3.2. By Product Type

        12.3.3. By Function Type

        12.3.4. By End Use

    12.4. Key Takeaways

13. South Asia and Pacific Market Analysis 2018 to 2022 and Forecast 2023 to 2033, By Country

    13.1. Historical Market Size Value (US$ Million) & Volume (Units) Trend Analysis By Market Taxonomy, 2018 to 2022

    13.2. Market Size Value (US$ Million) & Volume (Units) Forecast By Market Taxonomy, 2023 to 2033

        13.2.1. By Country

            13.2.1.1. India

            13.2.1.2. Bangladesh

            13.2.1.3. Australia

            13.2.1.4. New Zealand

            13.2.1.5. Rest of South Asia and Pacific

        13.2.2. By Product Type

        13.2.3. By Function Type

        13.2.4. By End Use

    13.3. Market Attractiveness Analysis

        13.3.1. By Country

        13.3.2. By Product Type

        13.3.3. By Function Type

        13.3.4. By End Use

    13.4. Key Takeaways

14. East Asia Market Analysis 2018 to 2022 and Forecast 2023 to 2033, By Country

    14.1. Historical Market Size Value (US$ Million) & Volume (Units) Trend Analysis By Market Taxonomy, 2018 to 2022

    14.2. Market Size Value (US$ Million) & Volume (Units) Forecast By Market Taxonomy, 2023 to 2033

        14.2.1. By Country

            14.2.1.1. China

            14.2.1.2. Japan

            14.2.1.3. South Korea

        14.2.2. By Product Type

        14.2.3. By Function Type

        14.2.4. By End Use

    14.3. Market Attractiveness Analysis

        14.3.1. By Country

        14.3.2. By Product Type

        14.3.3. By Function Type

        14.3.4. By End Use

    14.4. Key Takeaways

15. Middle East and Africa Market Analysis 2018 to 2022 and Forecast 2023 to 2033, By Country

    15.1. Historical Market Size Value (US$ Million) & Volume (Units) Trend Analysis By Market Taxonomy, 2018 to 2022

    15.2. Market Size Value (US$ Million) & Volume (Units) Forecast By Market Taxonomy, 2023 to 2033

        15.2.1. By Country

            15.2.1.1. GCC Countries

            15.2.1.2. South Africa

            15.2.1.3. Israel

            15.2.1.4. Rest of MEA

        15.2.2. By Product Type

        15.2.3. By Function Type

        15.2.4. By End Use

    15.3. Market Attractiveness Analysis

        15.3.1. By Country

        15.3.2. By Product Type

        15.3.3. By Function Type

        15.3.4. By End Use

    15.4. Key Takeaways

16. Key Countries Market Analysis

    16.1. USA

        16.1.1. Pricing Analysis

        16.1.2. Market Share Analysis, 2022

            16.1.2.1. By Product Type

            16.1.2.2. By Function Type

            16.1.2.3. By End Use

    16.2. Canada

        16.2.1. Pricing Analysis

        16.2.2. Market Share Analysis, 2022

            16.2.2.1. By Product Type

            16.2.2.2. By Function Type

            16.2.2.3. By End Use

    16.3. Brazil

        16.3.1. Pricing Analysis

        16.3.2. Market Share Analysis, 2022

            16.3.2.1. By Product Type

            16.3.2.2. By Function Type

            16.3.2.3. By End Use

    16.4. Mexico

        16.4.1. Pricing Analysis

        16.4.2. Market Share Analysis, 2022

            16.4.2.1. By Product Type

            16.4.2.2. By Function Type

            16.4.2.3. By End Use

    16.5. Germany

        16.5.1. Pricing Analysis

        16.5.2. Market Share Analysis, 2022

            16.5.2.1. By Product Type

            16.5.2.2. By Function Type

            16.5.2.3. By End Use

    16.6. UK

        16.6.1. Pricing Analysis

        16.6.2. Market Share Analysis, 2022

            16.6.2.1. By Product Type

            16.6.2.2. By Function Type

            16.6.2.3. By End Use

    16.7. France

        16.7.1. Pricing Analysis

        16.7.2. Market Share Analysis, 2022

            16.7.2.1. By Product Type

            16.7.2.2. By Function Type

            16.7.2.3. By End Use

    16.8. Spain

        16.8.1. Pricing Analysis

        16.8.2. Market Share Analysis, 2022

            16.8.2.1. By Product Type

            16.8.2.2. By Function Type

            16.8.2.3. By End Use

    16.9. Italy

        16.9.1. Pricing Analysis

        16.9.2. Market Share Analysis, 2022

            16.9.2.1. By Product Type

            16.9.2.2. By Function Type

            16.9.2.3. By End Use

    16.10. Poland

        16.10.1. Pricing Analysis

        16.10.2. Market Share Analysis, 2022

            16.10.2.1. By Product Type

            16.10.2.2. By Function Type

            16.10.2.3. By End Use

    16.11. Russia

        16.11.1. Pricing Analysis

        16.11.2. Market Share Analysis, 2022

            16.11.2.1. By Product Type

            16.11.2.2. By Function Type

            16.11.2.3. By End Use

    16.12. Czech Republic

        16.12.1. Pricing Analysis

        16.12.2. Market Share Analysis, 2022

            16.12.2.1. By Product Type

            16.12.2.2. By Function Type

            16.12.2.3. By End Use

    16.13. Romania

        16.13.1. Pricing Analysis

        16.13.2. Market Share Analysis, 2022

            16.13.2.1. By Product Type

            16.13.2.2. By Function Type

            16.13.2.3. By End Use

    16.14. India

        16.14.1. Pricing Analysis

        16.14.2. Market Share Analysis, 2022

            16.14.2.1. By Product Type

            16.14.2.2. By Function Type

            16.14.2.3. By End Use

    16.15. Bangladesh

        16.15.1. Pricing Analysis

        16.15.2. Market Share Analysis, 2022

            16.15.2.1. By Product Type

            16.15.2.2. By Function Type

            16.15.2.3. By End Use

    16.16. Australia

        16.16.1. Pricing Analysis

        16.16.2. Market Share Analysis, 2022

            16.16.2.1. By Product Type

            16.16.2.2. By Function Type

            16.16.2.3. By End Use

    16.17. New Zealand

        16.17.1. Pricing Analysis

        16.17.2. Market Share Analysis, 2022

            16.17.2.1. By Product Type

            16.17.2.2. By Function Type

            16.17.2.3. By End Use

    16.18. China

        16.18.1. Pricing Analysis

        16.18.2. Market Share Analysis, 2022

            16.18.2.1. By Product Type

            16.18.2.2. By Function Type

            16.18.2.3. By End Use

    16.19. Japan

        16.19.1. Pricing Analysis

        16.19.2. Market Share Analysis, 2022

            16.19.2.1. By Product Type

            16.19.2.2. By Function Type

            16.19.2.3. By End Use

    16.20. South Korea

        16.20.1. Pricing Analysis

        16.20.2. Market Share Analysis, 2022

            16.20.2.1. By Product Type

            16.20.2.2. By Function Type

            16.20.2.3. By End Use

    16.21. GCC Countries

        16.21.1. Pricing Analysis

        16.21.2. Market Share Analysis, 2022

            16.21.2.1. By Product Type

            16.21.2.2. By Function Type

            16.21.2.3. By End Use

    16.22. South Africa

        16.22.1. Pricing Analysis

        16.22.2. Market Share Analysis, 2022

            16.22.2.1. By Product Type

            16.22.2.2. By Function Type

            16.22.2.3. By End Use

    16.23. Israel

        16.23.1. Pricing Analysis

        16.23.2. Market Share Analysis, 2022

            16.23.2.1. By Product Type

            16.23.2.2. By Function Type

            16.23.2.3. By End Use

17. Market Structure Analysis

    17.1. Competition Dashboard

    17.2. Competition Benchmarking

    17.3. Market Share Analysis of Top Players

        17.3.1. By Regional

        17.3.2. By Product Type

        17.3.3. By Function Type

        17.3.4. By End Use

18. Competition Analysis

    18.1. Competition Deep Dive

        18.1.1. Ajinomoto Bio-Pharma

            18.1.1.1. Overview

            18.1.1.2. Product Portfolio

            18.1.1.3. Profitability by Market Segments

            18.1.1.4. Sales Footprint

            18.1.1.5. Strategy Overview

                18.1.1.5.1. Marketing Strategy

                18.1.1.5.2. Product Strategy

                18.1.1.5.3. Channel Strategy

        18.1.2. Aptar Pharma (India) Pvt. Ltd.

            18.1.2.1. Overview

            18.1.2.2. Product Portfolio

            18.1.2.3. Profitability by Market Segments

            18.1.2.4. Sales Footprint

            18.1.2.5. Strategy Overview

                18.1.2.5.1. Marketing Strategy

                18.1.2.5.2. Product Strategy

                18.1.2.5.3. Channel Strategy

        18.1.3. Baxter International Inc.

            18.1.3.1. Overview

            18.1.3.2. Product Portfolio

            18.1.3.3. Profitability by Market Segments

            18.1.3.4. Sales Footprint

            18.1.3.5. Strategy Overview

                18.1.3.5.1. Marketing Strategy

                18.1.3.5.2. Product Strategy

                18.1.3.5.3. Channel Strategy

        18.1.4. Biocorp

            18.1.4.1. Overview

            18.1.4.2. Product Portfolio

            18.1.4.3. Profitability by Market Segments

            18.1.4.4. Sales Footprint

            18.1.4.5. Strategy Overview

                18.1.4.5.1. Marketing Strategy

                18.1.4.5.2. Product Strategy

                18.1.4.5.3. Channel Strategy

        18.1.5. Enable Injections

            18.1.5.1. Overview

            18.1.5.2. Product Portfolio

            18.1.5.3. Profitability by Market Segments

            18.1.5.4. Sales Footprint

            18.1.5.5. Strategy Overview

                18.1.5.5.1. Marketing Strategy

                18.1.5.5.2. Product Strategy

                18.1.5.5.3. Channel Strategy

        18.1.6. Nipro Corp.

            18.1.6.1. Overview

            18.1.6.2. Product Portfolio

            18.1.6.3. Profitability by Market Segments

            18.1.6.4. Sales Footprint

            18.1.6.5. Strategy Overview

                18.1.6.5.1. Marketing Strategy

                18.1.6.5.2. Product Strategy

                18.1.6.5.3. Channel Strategy

        18.1.7. SHL Medical

            18.1.7.1. Overview

            18.1.7.2. Product Portfolio

            18.1.7.3. Profitability by Market Segments

            18.1.7.4. Sales Footprint

            18.1.7.5. Strategy Overview

                18.1.7.5.1. Marketing Strategy

                18.1.7.5.2. Product Strategy

                18.1.7.5.3. Channel Strategy

        18.1.8. Shandong Weigao Group

            18.1.8.1. Overview

            18.1.8.2. Product Portfolio

            18.1.8.3. Profitability by Market Segments

            18.1.8.4. Sales Footprint

            18.1.8.5. Strategy Overview

                18.1.8.5.1. Marketing Strategy

                18.1.8.5.2. Product Strategy

                18.1.8.5.3. Channel Strategy

        18.1.9. Stevanato Group

            18.1.9.1. Overview

            18.1.9.2. Product Portfolio

            18.1.9.3. Profitability by Market Segments

            18.1.9.4. Sales Footprint

            18.1.9.5. Strategy Overview

                18.1.9.5.1. Marketing Strategy

                18.1.9.5.2. Product Strategy

                18.1.9.5.3. Channel Strategy

        18.1.10. Unilife Corporation

            18.1.10.1. Overview

            18.1.10.2. Product Portfolio

            18.1.10.3. Profitability by Market Segments

            18.1.10.4. Sales Footprint

            18.1.10.5. Strategy Overview

                18.1.10.5.1. Marketing Strategy

                18.1.10.5.2. Product Strategy

                18.1.10.5.3. Channel Strategy

19. Assumptions & Acronyms Used

20. Research Methodology

Don't pay for what you don't need

Customize your report by selecting specific countries or regions and save 30%!

List of Tables

Table 1: Global Market Value (US$ Million) Forecast by Region, 2018 to 2033

Table 2: Global Market Volume (Units) Forecast by Region, 2018 to 2033

Table 3: Global Market Value (US$ Million) Forecast by Product Type, 2018 to 2033

Table 4: Global Market Volume (Units) Forecast by Product Type, 2018 to 2033

Table 5: Global Market Value (US$ Million) Forecast by Function Type, 2018 to 2033

Table 6: Global Market Volume (Units) Forecast by Function Type, 2018 to 2033

Table 7: Global Market Value (US$ Million) Forecast by End Use, 2018 to 2033

Table 8: Global Market Volume (Units) Forecast by End Use, 2018 to 2033

Table 9: North America Market Value (US$ Million) Forecast by Country, 2018 to 2033

Table 10: North America Market Volume (Units) Forecast by Country, 2018 to 2033

Table 11: North America Market Value (US$ Million) Forecast by Product Type, 2018 to 2033

Table 12: North America Market Volume (Units) Forecast by Product Type, 2018 to 2033

Table 13: North America Market Value (US$ Million) Forecast by Function Type, 2018 to 2033

Table 14: North America Market Volume (Units) Forecast by Function Type, 2018 to 2033

Table 15: North America Market Value (US$ Million) Forecast by End Use, 2018 to 2033

Table 16: North America Market Volume (Units) Forecast by End Use, 2018 to 2033

Table 17: Latin America Market Value (US$ Million) Forecast by Country, 2018 to 2033

Table 18: Latin America Market Volume (Units) Forecast by Country, 2018 to 2033

Table 19: Latin America Market Value (US$ Million) Forecast by Product Type, 2018 to 2033

Table 20: Latin America Market Volume (Units) Forecast by Product Type, 2018 to 2033

Table 21: Latin America Market Value (US$ Million) Forecast by Function Type, 2018 to 2033

Table 22: Latin America Market Volume (Units) Forecast by Function Type, 2018 to 2033

Table 23: Latin America Market Value (US$ Million) Forecast by End Use, 2018 to 2033

Table 24: Latin America Market Volume (Units) Forecast by End Use, 2018 to 2033

Table 25: Western Europe Market Value (US$ Million) Forecast by Country, 2018 to 2033

Table 26: Western Europe Market Volume (Units) Forecast by Country, 2018 to 2033

Table 27: Western Europe Market Value (US$ Million) Forecast by Product Type, 2018 to 2033

Table 28: Western Europe Market Volume (Units) Forecast by Product Type, 2018 to 2033

Table 29: Western Europe Market Value (US$ Million) Forecast by Function Type, 2018 to 2033

Table 30: Western Europe Market Volume (Units) Forecast by Function Type, 2018 to 2033

Table 31: Western Europe Market Value (US$ Million) Forecast by End Use, 2018 to 2033

Table 32: Western Europe Market Volume (Units) Forecast by End Use, 2018 to 2033

Table 33: Eastern Europe Market Value (US$ Million) Forecast by Country, 2018 to 2033

Table 34: Eastern Europe Market Volume (Units) Forecast by Country, 2018 to 2033

Table 35: Eastern Europe Market Value (US$ Million) Forecast by Product Type, 2018 to 2033

Table 36: Eastern Europe Market Volume (Units) Forecast by Product Type, 2018 to 2033

Table 37: Eastern Europe Market Value (US$ Million) Forecast by Function Type, 2018 to 2033

Table 38: Eastern Europe Market Volume (Units) Forecast by Function Type, 2018 to 2033

Table 39: Eastern Europe Market Value (US$ Million) Forecast by End Use, 2018 to 2033

Table 40: Eastern Europe Market Volume (Units) Forecast by End Use, 2018 to 2033

Table 41: South Asia and Pacific Market Value (US$ Million) Forecast by Country, 2018 to 2033

Table 42: South Asia and Pacific Market Volume (Units) Forecast by Country, 2018 to 2033

Table 43: South Asia and Pacific Market Value (US$ Million) Forecast by Product Type, 2018 to 2033

Table 44: South Asia and Pacific Market Volume (Units) Forecast by Product Type, 2018 to 2033

Table 45: South Asia and Pacific Market Value (US$ Million) Forecast by Function Type, 2018 to 2033

Table 46: South Asia and Pacific Market Volume (Units) Forecast by Function Type, 2018 to 2033

Table 47: South Asia and Pacific Market Value (US$ Million) Forecast by End Use, 2018 to 2033

Table 48: South Asia and Pacific Market Volume (Units) Forecast by End Use, 2018 to 2033

Table 49: East Asia Market Value (US$ Million) Forecast by Country, 2018 to 2033

Table 50: East Asia Market Volume (Units) Forecast by Country, 2018 to 2033

Table 51: East Asia Market Value (US$ Million) Forecast by Product Type, 2018 to 2033

Table 52: East Asia Market Volume (Units) Forecast by Product Type, 2018 to 2033

Table 53: East Asia Market Value (US$ Million) Forecast by Function Type, 2018 to 2033

Table 54: East Asia Market Volume (Units) Forecast by Function Type, 2018 to 2033

Table 55: East Asia Market Value (US$ Million) Forecast by End Use, 2018 to 2033

Table 56: East Asia Market Volume (Units) Forecast by End Use, 2018 to 2033

Table 57: Middle East and Africa Market Value (US$ Million) Forecast by Country, 2018 to 2033

Table 58: Middle East and Africa Market Volume (Units) Forecast by Country, 2018 to 2033

Table 59: Middle East and Africa Market Value (US$ Million) Forecast by Product Type, 2018 to 2033

Table 60: Middle East and Africa Market Volume (Units) Forecast by Product Type, 2018 to 2033

Table 61: Middle East and Africa Market Value (US$ Million) Forecast by Function Type, 2018 to 2033

Table 62: Middle East and Africa Market Volume (Units) Forecast by Function Type, 2018 to 2033

Table 63: Middle East and Africa Market Value (US$ Million) Forecast by End Use, 2018 to 2033

Table 64: Middle East and Africa Market Volume (Units) Forecast by End Use, 2018 to 2033
Ismail Sutaria
Ismail Sutaria

Principal Consultant

Talk to Analyst

Find your sweet spots for generating winning opportunities in this market.

List of Charts

Figure 1: Global Market Value (US$ Million) by Product Type, 2023 to 2033

Figure 2: Global Market Value (US$ Million) by Function Type, 2023 to 2033

Figure 3: Global Market Value (US$ Million) by End Use, 2023 to 2033

Figure 4: Global Market Value (US$ Million) by Region, 2023 to 2033

Figure 5: Global Market Value (US$ Million) Analysis by Region, 2018 to 2033

Figure 6: Global Market Volume (Units) Analysis by Region, 2018 to 2033

Figure 7: Global Market Value Share (%) and BPS Analysis by Region, 2023 to 2033

Figure 8: Global Market Y-o-Y Growth (%) Projections by Region, 2023 to 2033

Figure 9: Global Market Value (US$ Million) Analysis by Product Type, 2018 to 2033

Figure 10: Global Market Volume (Units) Analysis by Product Type, 2018 to 2033

Figure 11: Global Market Value Share (%) and BPS Analysis by Product Type, 2023 to 2033

Figure 12: Global Market Y-o-Y Growth (%) Projections by Product Type, 2023 to 2033

Figure 13: Global Market Value (US$ Million) Analysis by Function Type, 2018 to 2033

Figure 14: Global Market Volume (Units) Analysis by Function Type, 2018 to 2033

Figure 15: Global Market Value Share (%) and BPS Analysis by Function Type, 2023 to 2033

Figure 16: Global Market Y-o-Y Growth (%) Projections by Function Type, 2023 to 2033

Figure 17: Global Market Value (US$ Million) Analysis by End Use, 2018 to 2033

Figure 18: Global Market Volume (Units) Analysis by End Use, 2018 to 2033

Figure 19: Global Market Value Share (%) and BPS Analysis by End Use, 2023 to 2033

Figure 20: Global Market Y-o-Y Growth (%) Projections by End Use, 2023 to 2033

Figure 21: Global Market Attractiveness by Product Type, 2023 to 2033

Figure 22: Global Market Attractiveness by Function Type, 2023 to 2033

Figure 23: Global Market Attractiveness by End Use, 2023 to 2033

Figure 24: Global Market Attractiveness by Region, 2023 to 2033

Figure 25: North America Market Value (US$ Million) by Product Type, 2023 to 2033

Figure 26: North America Market Value (US$ Million) by Function Type, 2023 to 2033

Figure 27: North America Market Value (US$ Million) by End Use, 2023 to 2033

Figure 28: North America Market Value (US$ Million) by Country, 2023 to 2033

Figure 29: North America Market Value (US$ Million) Analysis by Country, 2018 to 2033

Figure 30: North America Market Volume (Units) Analysis by Country, 2018 to 2033

Figure 31: North America Market Value Share (%) and BPS Analysis by Country, 2023 to 2033

Figure 32: North America Market Y-o-Y Growth (%) Projections by Country, 2023 to 2033

Figure 33: North America Market Value (US$ Million) Analysis by Product Type, 2018 to 2033

Figure 34: North America Market Volume (Units) Analysis by Product Type, 2018 to 2033

Figure 35: North America Market Value Share (%) and BPS Analysis by Product Type, 2023 to 2033

Figure 36: North America Market Y-o-Y Growth (%) Projections by Product Type, 2023 to 2033

Figure 37: North America Market Value (US$ Million) Analysis by Function Type, 2018 to 2033

Figure 38: North America Market Volume (Units) Analysis by Function Type, 2018 to 2033

Figure 39: North America Market Value Share (%) and BPS Analysis by Function Type, 2023 to 2033

Figure 40: North America Market Y-o-Y Growth (%) Projections by Function Type, 2023 to 2033

Figure 41: North America Market Value (US$ Million) Analysis by End Use, 2018 to 2033

Figure 42: North America Market Volume (Units) Analysis by End Use, 2018 to 2033

Figure 43: North America Market Value Share (%) and BPS Analysis by End Use, 2023 to 2033

Figure 44: North America Market Y-o-Y Growth (%) Projections by End Use, 2023 to 2033

Figure 45: North America Market Attractiveness by Product Type, 2023 to 2033

Figure 46: North America Market Attractiveness by Function Type, 2023 to 2033

Figure 47: North America Market Attractiveness by End Use, 2023 to 2033

Figure 48: North America Market Attractiveness by Country, 2023 to 2033

Figure 49: Latin America Market Value (US$ Million) by Product Type, 2023 to 2033

Figure 50: Latin America Market Value (US$ Million) by Function Type, 2023 to 2033

Figure 51: Latin America Market Value (US$ Million) by End Use, 2023 to 2033

Figure 52: Latin America Market Value (US$ Million) by Country, 2023 to 2033

Figure 53: Latin America Market Value (US$ Million) Analysis by Country, 2018 to 2033

Figure 54: Latin America Market Volume (Units) Analysis by Country, 2018 to 2033

Figure 55: Latin America Market Value Share (%) and BPS Analysis by Country, 2023 to 2033

Figure 56: Latin America Market Y-o-Y Growth (%) Projections by Country, 2023 to 2033

Figure 57: Latin America Market Value (US$ Million) Analysis by Product Type, 2018 to 2033

Figure 58: Latin America Market Volume (Units) Analysis by Product Type, 2018 to 2033

Figure 59: Latin America Market Value Share (%) and BPS Analysis by Product Type, 2023 to 2033

Figure 60: Latin America Market Y-o-Y Growth (%) Projections by Product Type, 2023 to 2033

Figure 61: Latin America Market Value (US$ Million) Analysis by Function Type, 2018 to 2033

Figure 62: Latin America Market Volume (Units) Analysis by Function Type, 2018 to 2033

Figure 63: Latin America Market Value Share (%) and BPS Analysis by Function Type, 2023 to 2033

Figure 64: Latin America Market Y-o-Y Growth (%) Projections by Function Type, 2023 to 2033

Figure 65: Latin America Market Value (US$ Million) Analysis by End Use, 2018 to 2033

Figure 66: Latin America Market Volume (Units) Analysis by End Use, 2018 to 2033

Figure 67: Latin America Market Value Share (%) and BPS Analysis by End Use, 2023 to 2033

Figure 68: Latin America Market Y-o-Y Growth (%) Projections by End Use, 2023 to 2033

Figure 69: Latin America Market Attractiveness by Product Type, 2023 to 2033

Figure 70: Latin America Market Attractiveness by Function Type, 2023 to 2033

Figure 71: Latin America Market Attractiveness by End Use, 2023 to 2033

Figure 72: Latin America Market Attractiveness by Country, 2023 to 2033

Figure 73: Western Europe Market Value (US$ Million) by Product Type, 2023 to 2033

Figure 74: Western Europe Market Value (US$ Million) by Function Type, 2023 to 2033

Figure 75: Western Europe Market Value (US$ Million) by End Use, 2023 to 2033

Figure 76: Western Europe Market Value (US$ Million) by Country, 2023 to 2033

Figure 77: Western Europe Market Value (US$ Million) Analysis by Country, 2018 to 2033

Figure 78: Western Europe Market Volume (Units) Analysis by Country, 2018 to 2033

Figure 79: Western Europe Market Value Share (%) and BPS Analysis by Country, 2023 to 2033

Figure 80: Western Europe Market Y-o-Y Growth (%) Projections by Country, 2023 to 2033

Figure 81: Western Europe Market Value (US$ Million) Analysis by Product Type, 2018 to 2033

Figure 82: Western Europe Market Volume (Units) Analysis by Product Type, 2018 to 2033

Figure 83: Western Europe Market Value Share (%) and BPS Analysis by Product Type, 2023 to 2033

Figure 84: Western Europe Market Y-o-Y Growth (%) Projections by Product Type, 2023 to 2033

Figure 85: Western Europe Market Value (US$ Million) Analysis by Function Type, 2018 to 2033

Figure 86: Western Europe Market Volume (Units) Analysis by Function Type, 2018 to 2033

Figure 87: Western Europe Market Value Share (%) and BPS Analysis by Function Type, 2023 to 2033

Figure 88: Western Europe Market Y-o-Y Growth (%) Projections by Function Type, 2023 to 2033

Figure 89: Western Europe Market Value (US$ Million) Analysis by End Use, 2018 to 2033

Figure 90: Western Europe Market Volume (Units) Analysis by End Use, 2018 to 2033

Figure 91: Western Europe Market Value Share (%) and BPS Analysis by End Use, 2023 to 2033

Figure 92: Western Europe Market Y-o-Y Growth (%) Projections by End Use, 2023 to 2033

Figure 93: Western Europe Market Attractiveness by Product Type, 2023 to 2033

Figure 94: Western Europe Market Attractiveness by Function Type, 2023 to 2033

Figure 95: Western Europe Market Attractiveness by End Use, 2023 to 2033

Figure 96: Western Europe Market Attractiveness by Country, 2023 to 2033

Figure 97: Eastern Europe Market Value (US$ Million) by Product Type, 2023 to 2033

Figure 98: Eastern Europe Market Value (US$ Million) by Function Type, 2023 to 2033

Figure 99: Eastern Europe Market Value (US$ Million) by End Use, 2023 to 2033

Figure 100: Eastern Europe Market Value (US$ Million) by Country, 2023 to 2033

Figure 101: Eastern Europe Market Value (US$ Million) Analysis by Country, 2018 to 2033

Figure 102: Eastern Europe Market Volume (Units) Analysis by Country, 2018 to 2033

Figure 103: Eastern Europe Market Value Share (%) and BPS Analysis by Country, 2023 to 2033

Figure 104: Eastern Europe Market Y-o-Y Growth (%) Projections by Country, 2023 to 2033

Figure 105: Eastern Europe Market Value (US$ Million) Analysis by Product Type, 2018 to 2033

Figure 106: Eastern Europe Market Volume (Units) Analysis by Product Type, 2018 to 2033

Figure 107: Eastern Europe Market Value Share (%) and BPS Analysis by Product Type, 2023 to 2033

Figure 108: Eastern Europe Market Y-o-Y Growth (%) Projections by Product Type, 2023 to 2033

Figure 109: Eastern Europe Market Value (US$ Million) Analysis by Function Type, 2018 to 2033

Figure 110: Eastern Europe Market Volume (Units) Analysis by Function Type, 2018 to 2033

Figure 111: Eastern Europe Market Value Share (%) and BPS Analysis by Function Type, 2023 to 2033

Figure 112: Eastern Europe Market Y-o-Y Growth (%) Projections by Function Type, 2023 to 2033

Figure 113: Eastern Europe Market Value (US$ Million) Analysis by End Use, 2018 to 2033

Figure 114: Eastern Europe Market Volume (Units) Analysis by End Use, 2018 to 2033

Figure 115: Eastern Europe Market Value Share (%) and BPS Analysis by End Use, 2023 to 2033

Figure 116: Eastern Europe Market Y-o-Y Growth (%) Projections by End Use, 2023 to 2033

Figure 117: Eastern Europe Market Attractiveness by Product Type, 2023 to 2033

Figure 118: Eastern Europe Market Attractiveness by Function Type, 2023 to 2033

Figure 119: Eastern Europe Market Attractiveness by End Use, 2023 to 2033

Figure 120: Eastern Europe Market Attractiveness by Country, 2023 to 2033

Figure 121: South Asia and Pacific Market Value (US$ Million) by Product Type, 2023 to 2033

Figure 122: South Asia and Pacific Market Value (US$ Million) by Function Type, 2023 to 2033

Figure 123: South Asia and Pacific Market Value (US$ Million) by End Use, 2023 to 2033

Figure 124: South Asia and Pacific Market Value (US$ Million) by Country, 2023 to 2033

Figure 125: South Asia and Pacific Market Value (US$ Million) Analysis by Country, 2018 to 2033

Figure 126: South Asia and Pacific Market Volume (Units) Analysis by Country, 2018 to 2033

Figure 127: South Asia and Pacific Market Value Share (%) and BPS Analysis by Country, 2023 to 2033

Figure 128: South Asia and Pacific Market Y-o-Y Growth (%) Projections by Country, 2023 to 2033

Figure 129: South Asia and Pacific Market Value (US$ Million) Analysis by Product Type, 2018 to 2033

Figure 130: South Asia and Pacific Market Volume (Units) Analysis by Product Type, 2018 to 2033

Figure 131: South Asia and Pacific Market Value Share (%) and BPS Analysis by Product Type, 2023 to 2033

Figure 132: South Asia and Pacific Market Y-o-Y Growth (%) Projections by Product Type, 2023 to 2033

Figure 133: South Asia and Pacific Market Value (US$ Million) Analysis by Function Type, 2018 to 2033

Figure 134: South Asia and Pacific Market Volume (Units) Analysis by Function Type, 2018 to 2033

Figure 135: South Asia and Pacific Market Value Share (%) and BPS Analysis by Function Type, 2023 to 2033

Figure 136: South Asia and Pacific Market Y-o-Y Growth (%) Projections by Function Type, 2023 to 2033

Figure 137: South Asia and Pacific Market Value (US$ Million) Analysis by End Use, 2018 to 2033

Figure 138: South Asia and Pacific Market Volume (Units) Analysis by End Use, 2018 to 2033

Figure 139: South Asia and Pacific Market Value Share (%) and BPS Analysis by End Use, 2023 to 2033

Figure 140: South Asia and Pacific Market Y-o-Y Growth (%) Projections by End Use, 2023 to 2033

Figure 141: South Asia and Pacific Market Attractiveness by Product Type, 2023 to 2033

Figure 142: South Asia and Pacific Market Attractiveness by Function Type, 2023 to 2033

Figure 143: South Asia and Pacific Market Attractiveness by End Use, 2023 to 2033

Figure 144: South Asia and Pacific Market Attractiveness by Country, 2023 to 2033

Figure 145: East Asia Market Value (US$ Million) by Product Type, 2023 to 2033

Figure 146: East Asia Market Value (US$ Million) by Function Type, 2023 to 2033

Figure 147: East Asia Market Value (US$ Million) by End Use, 2023 to 2033

Figure 148: East Asia Market Value (US$ Million) by Country, 2023 to 2033

Figure 149: East Asia Market Value (US$ Million) Analysis by Country, 2018 to 2033

Figure 150: East Asia Market Volume (Units) Analysis by Country, 2018 to 2033

Figure 151: East Asia Market Value Share (%) and BPS Analysis by Country, 2023 to 2033

Figure 152: East Asia Market Y-o-Y Growth (%) Projections by Country, 2023 to 2033

Figure 153: East Asia Market Value (US$ Million) Analysis by Product Type, 2018 to 2033

Figure 154: East Asia Market Volume (Units) Analysis by Product Type, 2018 to 2033

Figure 155: East Asia Market Value Share (%) and BPS Analysis by Product Type, 2023 to 2033

Figure 156: East Asia Market Y-o-Y Growth (%) Projections by Product Type, 2023 to 2033

Figure 157: East Asia Market Value (US$ Million) Analysis by Function Type, 2018 to 2033

Figure 158: East Asia Market Volume (Units) Analysis by Function Type, 2018 to 2033

Figure 159: East Asia Market Value Share (%) and BPS Analysis by Function Type, 2023 to 2033

Figure 160: East Asia Market Y-o-Y Growth (%) Projections by Function Type, 2023 to 2033

Figure 161: East Asia Market Value (US$ Million) Analysis by End Use, 2018 to 2033

Figure 162: East Asia Market Volume (Units) Analysis by End Use, 2018 to 2033

Figure 163: East Asia Market Value Share (%) and BPS Analysis by End Use, 2023 to 2033

Figure 164: East Asia Market Y-o-Y Growth (%) Projections by End Use, 2023 to 2033

Figure 165: East Asia Market Attractiveness by Product Type, 2023 to 2033

Figure 166: East Asia Market Attractiveness by Function Type, 2023 to 2033

Figure 167: East Asia Market Attractiveness by End Use, 2023 to 2033

Figure 168: East Asia Market Attractiveness by Country, 2023 to 2033

Figure 169: Middle East and Africa Market Value (US$ Million) by Product Type, 2023 to 2033

Figure 170: Middle East and Africa Market Value (US$ Million) by Function Type, 2023 to 2033

Figure 171: Middle East and Africa Market Value (US$ Million) by End Use, 2023 to 2033

Figure 172: Middle East and Africa Market Value (US$ Million) by Country, 2023 to 2033

Figure 173: Middle East and Africa Market Value (US$ Million) Analysis by Country, 2018 to 2033

Figure 174: Middle East and Africa Market Volume (Units) Analysis by Country, 2018 to 2033

Figure 175: Middle East and Africa Market Value Share (%) and BPS Analysis by Country, 2023 to 2033

Figure 176: Middle East and Africa Market Y-o-Y Growth (%) Projections by Country, 2023 to 2033

Figure 177: Middle East and Africa Market Value (US$ Million) Analysis by Product Type, 2018 to 2033

Figure 178: Middle East and Africa Market Volume (Units) Analysis by Product Type, 2018 to 2033

Figure 179: Middle East and Africa Market Value Share (%) and BPS Analysis by Product Type, 2023 to 2033

Figure 180: Middle East and Africa Market Y-o-Y Growth (%) Projections by Product Type, 2023 to 2033

Figure 181: Middle East and Africa Market Value (US$ Million) Analysis by Function Type, 2018 to 2033

Figure 182: Middle East and Africa Market Volume (Units) Analysis by Function Type, 2018 to 2033

Figure 183: Middle East and Africa Market Value Share (%) and BPS Analysis by Function Type, 2023 to 2033

Figure 184: Middle East and Africa Market Y-o-Y Growth (%) Projections by Function Type, 2023 to 2033

Figure 185: Middle East and Africa Market Value (US$ Million) Analysis by End Use, 2018 to 2033

Figure 186: Middle East and Africa Market Volume (Units) Analysis by End Use, 2018 to 2033

Figure 187: Middle East and Africa Market Value Share (%) and BPS Analysis by End Use, 2023 to 2033

Figure 188: Middle East and Africa Market Y-o-Y Growth (%) Projections by End Use, 2023 to 2033

Figure 189: Middle East and Africa Market Attractiveness by Product Type, 2023 to 2033

Figure 190: Middle East and Africa Market Attractiveness by Function Type, 2023 to 2033

Figure 191: Middle East and Africa Market Attractiveness by End Use, 2023 to 2033

Figure 192: Middle East and Africa Market Attractiveness by Country, 2023 to 2033

Recommendations

Packaging

Eccentric Tip Syringe Market

Published : April 2023

Packaging

Robotic Aseptic Syringe Filler Capper Market

Published : July 2022

Packaging

Slip Tip Syringe Market

Published : July 2021

Packaging

Single-Use Syringe Market

Published : July 2021

Explore Packaging Insights

View Reports

Polymer-based Prefilled Syringe Market