BFS Syringes Market Size and Share Forecast Outlook 2025 to 2035

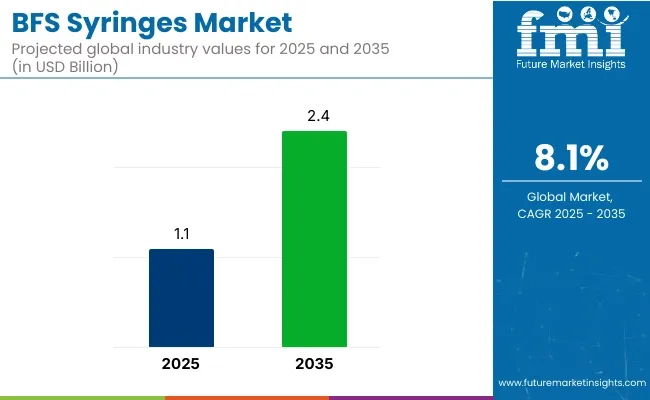
The BFS syringes market is projected to grow from USD 1.1 billion in 2025 to USD 2.4 billion by 2035, registering a CAGR of 8.1% during the forecast period. Sales in 2024 reached USD 900 million. This expansion has been driven by rising demand for unit-dose packaging, increased adoption of aseptic delivery in biopharmaceuticals, and reduced risk of contamination.

BFS technology has been favored for its single-step process, integrating blow molding, filling, and sealing. Enhanced product integrity and reduced dependency on glass have made BFS syringes suitable for vaccines and biologics. Technological innovations in nozzle designs and mold control systems have improved precision.

Quick Stats of Syringes Market

  • Market Value (2025): USD 1.1 billion

  • Forecast Value (2035): USD 2.4 billion
  • Forecast CAGR: 48.1%
  • Top Material Type in 2025: Polypropylene (51.4% market share)
  • Top End Use: Pharmaceuticals (expanding rapidly)

Bfs Syringes Market

In June 2024, The Ritedose Corporation, the leading contract development and manufacturing organization (CDMO) specializing in sterile Blow Fill Seal (BFS) production, announces a significant expansion of its production capabilities to meet the demand for ophthalmic and respiratory medications. “This expansion marks a pivotal moment in our company’s history,” said CEO of Ritedose Jody Chastain.

“We’re passionately dedicated to advancing the health and well-being of patients across the United States it’s why we come to work every single day. We are perfectly positioned to support our partners and deliver quality medications, and both they and our patients count on us to be steps ahead in capacity, capabilities and without a doubt, quality. It’s our forward-looking strategy and commitment that has allowed us to maintain a 100% customer retention rate over the past 25 years.”

Sustainability and innovation have become critical factors in shaping the BFS syringes market. Manufacturers have been focusing on developing recyclable polymer-based BFS syringes with reduced carbon footprints. Automation technologies, including robotic filling systems and AI-driven quality checks, have been integrated to boost production throughput and consistency.

Regulatory compliance with USP for container closure integrity has driven innovation in testing protocols and BFS unit validation. Emphasis has also been placed on the minimization of waste during production and the optimization of energy-efficient sterilization techniques.

Robust growth for BFS syringes is anticipated across biopharmaceuticals, ophthalmology, and respiratory segments. Stringent regulations from the FDA and EMA have been influencing market entry and setting high standards for sterility and quality assurance.

Competitive advantage is expected to be gained by firms offering integrated BFS platforms with modular scalability and digital traceability. Rapid expansion of drug delivery infrastructure in emerging economies has opened new market opportunities, especially for contract manufacturing organizations. Rising preference for single-use, prefilled units in post-pandemic healthcare settings is also contributing to this shift.

Analyzing BFS Syringes Market by Top Investment Segments

The market is segmented based on capacity, material type, end use, and region. By capacity, the market is categorized into 0.5-1 ml, 1-3 ml, and above 3 ml. In terms of material type, the market is divided into polypropylene (PP), polyvinyl chloride (PVC), and others, including polyethylene. Based on end use, the market is segmented into pharmaceuticals and healthcare, personal care and cosmetics, and others. Regionally, the BFS syringes market is analyzed across North America, Latin America, Europe, East Asia, South Asia, and the Middle East and Africa.

Polypropylene Projected to Lead Material Segment Due to Sterility and Barrier Protection

Polypropylene (PP) has been projected to account for 51.4% of the global BFS syringes market by 2025, owing to its excellent thermal and chemical resistance, which has enabled safe sterilization and compatibility with pharmaceutical substances. This material has been commonly selected in BFS processes for its ability to maintain dimensional integrity during aseptic blow-fill-seal operations.

Its low moisture transmission rate has helped prevent degradation of sensitive drug formulations. Its recyclability and cost-efficiency have made it favorable for single-use medical packaging, particularly in mass immunization and ophthalmic therapy applications.

PP has been widely used in BFS syringes because it can easily be molded into complex geometries while maintaining a smooth internal surface, thereby preventing drug interaction. Furthermore, PP syringes have demonstrated robust performance in low-temperature storage, essential for biologics and vaccines.

Drug developers have continued to specify polypropylene for BFS syringe production due to its inert nature and compatibility with both aqueous and lipid-based formulations. Migration testing and stability studies have consistently validated its safe use in injectable drug delivery systems.

Lightweight construction and breakage resistance have also contributed to its extensive deployment in hospital and clinical settings. As global demand for prefilled syringes increases and stricter sterility norms are enforced, the use of polypropylene in BFS syringe production is expected to grow steadily. Its dominance has been reinforced by the expanding role of biologics, combination therapies, and government-led vaccination programs, which have required reliable and sterile primary packaging materials.

Pharmaceuticals Segment to Dominate Due to Rising Injectable Demand

The pharmaceuticals segment is projected to hold 67.9% of the BFS syringes market by 2025, primarily due to the growing reliance on sterile, unit-dose packaging formats in hospitals, clinics, and immunization programs. BFS syringes have been extensively used for ophthalmic drops, inhalable formulations, biologicals, and vaccines that demand precise dosing and contamination-free filling. Injectable drug delivery trends have further accelerated the segment’s expansion.

Hospitals and ambulatory surgical centers have adopted BFS syringes to reduce medication errors, improve patient safety, and streamline aseptic administration workflows. These syringes have been favored for their tamper-evident designs and prefilled convenience, reducing the need for on-site compounding or vial reconstitution. Compliance with global regulatory standards such as FDA 21 CFR and EU GMP has been achieved through BFS technology’s closed-system capabilities.

Major pharmaceutical manufacturers have collaborated with contract packaging organizations (CPOs) to increase capacity for BFS syringe production. Innovations in 2-chamber and multi-dose BFS syringe systems have allowed broader drug compatibility and enhanced patient compliance.

Drug stability and long shelf life have been ensured through the use of protective PP or PVC materials in tandem with BFS filling. The pharmaceuticals and healthcare segment is expected to continue leading the market, as injectable therapies become more prevalent and global health agencies emphasize mass drug administration programs.

Challenges and Opportunities

Challenge

Regulatory Compliance and Quality Assurance

Stringent regulatory requirements and quality assurance pose challenges for the BFS Syringes Market. Manufacturers must meet different international standards when packaging pharmaceuticals and delivering sterile drugs, which can hamper production in addition to contributing to higher costs.

High Initial Investment and Production Costs

For Blow-Fill-Seal (BFS) technology, there would be a need to invest in machinery, infrastructure and skilled workforce. Small and mid-sized manufacturers are further deterred by the high cost of establishing BFS syringe production facilities.

Opportunity

Rising Demand for Prefilled and Single-Dose Syringes

This has led to an increase in adoption of prefilled syringes and single-dose drug administration which fuels the demand for BFS syringes. BFS technology is booming due to its expanding application in the production of vaccines, biologics and emergency medications, creating major growth opportunities.

Expansion in Emerging Markets and Sustainable Packaging

Increasing urbanization across emerging economies is generating demand for BFS syringes as healthcare infrastructure and vaccine delivery are being implemented. Moreover, the trend of sustainability and adopting eco-friendly packaging solutions could be a promising approach for innovation within BFS syringe manufacturing process.
Region-wise Outlook - BFS Syringes Market

Bfs Syringes Market Country Wise Analysis

United States

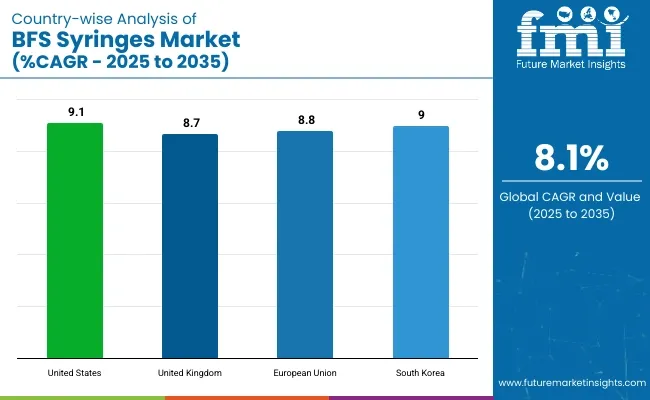
Increased adoption of BFS (Blow-Fill-Seal) syringes in pharmaceutical packaging, as well as a rise in demand for prefilled syringes and stringent regulations to guarantee drug safety and sterility, is fuelling growth in the USA market for BFS. Increased automation and aseptic filling technology also fuel the expansion of the market.

Region CAGR (2025 to 2035)
United States 9.1%

United Kingdom

The UK market is anticipated to grow steadily, owing to strong pharmaceutical infrasuture, surging investments in BFS technology, and growing preference of single dose administration of drug. Growing demand for eco-friendly and contamination-free packaging solutions also promotes the growth of the market.

Region CAGR (2025 to 2035)
United Kingdom 8.7%

European Union

According to the Global BFS Syringe Market Report, the European Union holds the largest market share owing to the strict pharmaceutical safety regulations, increased focus on reduction in medical waste, and technological progression in drug delivery mechanisms. The market is benefitted by the presence of prominent BFS manufacturers.

Region CAGR (2025 to 2035)
European Union 8.8%

South Korea

The BFS syringes market in South Korea is growing quickly owing to recent government initiatives that encourage innovation in the healthcare sector, increased pharmaceutical exports, and a growing demand for advanced drug packaging technologies. In addition, the expanding biotech sector also drives growth in the market.

Region CAGR (2025 to 2035)
South Korea 9.0%

Competitive Outlook: BFS Syringes Market

The Blow-Fill-Seal (BFS) syringes market is witnessing steady growth due to rising demand for prefilled syringes, advancements in pharmaceutical packaging, and increasing regulatory emphasis on sterile drug delivery systems. Key drivers include the adoption of BFS technology for aseptic manufacturing, growing preference for single-dose drug administration, and the expansion of biologics and vaccine applications.

Top Segments Studied in the BFS Syringes Market Research Report

By Capacity:

  • 0.5-1 ml
  • 1-3 ml
  • Above 3 ml

By Material Type:

  • Polypropylene (PP)
  • Polyvinyl Chloride (PVC)
  • Others (Polyethylene)

By End Use:

  • Pharmaceuticals and Healthcare
  • Personal Care and Cosmetics
  • Others

By Region:

  • North America
  • Latin America
  • Europe
  • The Middle East and Africa
  • East Asia
  • South Asia
  • Oceania

Table of Content

  1. Executive Summary
  2. Industry Introduction, including Taxonomy and Market Definition
  3. Market Trends and Success Factors, including Macro-economic Factors, Market Dynamics, and Recent Industry Developments
  4. Market Demand Analysis 2020 to 2024 and Forecast 2025 to 2035, including Historical Analysis and Future Projections
  5. Market Analysis 2020 to 2024 and Forecast 2025 to 2035
    • Capacity
    • Material Type
    • End Use
  6. Market Analysis 2020 to 2024 and Forecast 2025 to 2035, By Capacity
    • 0.5-1 ml
    • 1-3 ml
    • Above 3 ml
    • Vacuums
  7. Market Analysis 2020 to 2024 and Forecast 2025 to 2035, By Material Type
    • Polypropylene (PP)
    • Polyvinyl Chloride (PVC)
    • Others (Polyethylene)
  8. Market Analysis 2020 to 2024 and Forecast 2025 to 2035, By End Use
    • Pharmaceuticals and Healthcare
    • Personal Care and Cosmetics
    • Others
  9. Market Analysis 2020 to 2024 and Forecast 2025 to 2035, By Region
    • North America
    • Latin America
    • Western Europe
    • Eastern Europe
    • East Asia
    • South Asia Pacific
    • Middle East and Africa
  10. North America Sales Analysis 2020 to 2024 and Forecast 2025 to 2035, by Key Segments and Countries
  11. Latin America Sales Analysis 2020 to 2024 and Forecast 2025 to 2035, by Key Segments and Countries
  12. Western Europe Sales Analysis 2020 to 2024 and Forecast 2025 to 2035, by Key Segments and Countries
  13. Eastern Europe Sales Analysis 2020 to 2024 and Forecast 2025 to 2035, by Key Segments and Countries
  14. East Asia Sales Analysis 2020 to 2024 and Forecast 2025 to 2035, by Key Segments and Countries
  15. South Asia Pacific Sales Analysis 2020 to 2024 and Forecast 2025 to 2035, by Key Segments and Countries
  16. Middle East and Africa Sales Analysis 2020 to 2024 and Forecast 2025 to 2035, by Key Segments and Countries
  17. Sales Forecast 2025 to 2035 by Capacity, Material Type, and End Use for 30 Countries
  18. Competition Outlook, including Market Structure Analysis, Company Share Analysis by Key Players, and Competition Dashboard
  19. Company Profile
    • IVEN Pharmatech Engineering Co., Ltd.
    • Brevetti Angela S.R.L
    • OPTIMA Packaging Group GmbH
    • Vanrx
    • AST, Inc.
    • B. Braun Melsungen
    • Nipro
    • Takeda Pharmaceuticals International AG
    • Nephron Pharmaceuticals Corporation
    • Horizon Pharmaceutical Inc.

List of Tables

  • Table 1: Global Market Value (USD Million) Forecast by Region, 2020 to 2035
  • Table 2: Global Market Volume (Units) Forecast by Region, 2020 to 2035
  • Table 3: Global Market Value (USD Million) Forecast by Capacity, 2020 to 2035
  • Table 4: Global Market Volume (Units) Forecast by Capacity, 2020 to 2035
  • Table 5: Global Market Value (USD Million) Forecast by Material Type, 2020 to 2035
  • Table 6: Global Market Volume (Units) Forecast by Material Type, 2020 to 2035
  • Table 7: Global Market Value (USD Million) Forecast by End Use, 2020 to 2035
  • Table 8: Global Market Volume (Units) Forecast by End Use, 2020 to 2035
  • Table 9: North America Market Value (USD Million) Forecast by Country, 2020 to 2035
  • Table 10: North America Market Volume (Units) Forecast by Country, 2020 to 2035
  • Table 11: North America Market Value (USD Million) Forecast by Capacity, 2020 to 2035
  • Table 12: North America Market Volume (Units) Forecast by Capacity, 2020 to 2035
  • Table 13: North America Market Value (USD Million) Forecast by Material Type, 2020 to 2035
  • Table 14: North America Market Volume (Units) Forecast by Material Type, 2020 to 2035
  • Table 15: North America Market Value (USD Million) Forecast by End Use, 2020 to 2035
  • Table 16: North America Market Volume (Units) Forecast by End Use, 2020 to 2035
  • Table 17: Latin America Market Value (USD Million) Forecast by Country, 2020 to 2035
  • Table 18: Latin America Market Volume (Units) Forecast by Country, 2020 to 2035
  • Table 19: Latin America Market Value (USD Million) Forecast by Capacity, 2020 to 2035
  • Table 20: Latin America Market Volume (Units) Forecast by Capacity, 2020 to 2035
  • Table 21: Latin America Market Value (USD Million) Forecast by Material Type, 2020 to 2035
  • Table 22: Latin America Market Volume (Units) Forecast by Material Type, 2020 to 2035
  • Table 23: Latin America Market Value (USD Million) Forecast by End Use, 2020 to 2035
  • Table 24: Latin America Market Volume (Units) Forecast by End Use, 2020 to 2035
  • Table 25: Western Europe Market Value (USD Million) Forecast by Country, 2020 to 2035
  • Table 26: Western Europe Market Volume (Units) Forecast by Country, 2020 to 2035
  • Table 27: Western Europe Market Value (USD Million) Forecast by Capacity, 2020 to 2035
  • Table 28: Western Europe Market Volume (Units) Forecast by Capacity, 2020 to 2035
  • Table 29: Western Europe Market Value (USD Million) Forecast by Material Type, 2020 to 2035
  • Table 30: Western Europe Market Volume (Units) Forecast by Material Type, 2020 to 2035
  • Table 31: Western Europe Market Value (USD Million) Forecast by End Use, 2020 to 2035
  • Table 32: Western Europe Market Volume (Units) Forecast by End Use, 2020 to 2035
  • Table 33: Eastern Europe Market Value (USD Million) Forecast by Country, 2020 to 2035
  • Table 34: Eastern Europe Market Volume (Units) Forecast by Country, 2020 to 2035
  • Table 35: Eastern Europe Market Value (USD Million) Forecast by Capacity, 2020 to 2035
  • Table 36: Eastern Europe Market Volume (Units) Forecast by Capacity, 2020 to 2035
  • Table 37: Eastern Europe Market Value (USD Million) Forecast by Material Type, 2020 to 2035
  • Table 38: Eastern Europe Market Volume (Units) Forecast by Material Type, 2020 to 2035
  • Table 39: Eastern Europe Market Value (USD Million) Forecast by End Use, 2020 to 2035
  • Table 40: Eastern Europe Market Volume (Units) Forecast by End Use, 2020 to 2035
  • Table 41: South Asia and Pacific Market Value (USD Million) Forecast by Country, 2020 to 2035
  • Table 42: South Asia and Pacific Market Volume (Units) Forecast by Country, 2020 to 2035
  • Table 43: South Asia and Pacific Market Value (USD Million) Forecast by Capacity, 2020 to 2035
  • Table 44: South Asia and Pacific Market Volume (Units) Forecast by Capacity, 2020 to 2035
  • Table 45: South Asia and Pacific Market Value (USD Million) Forecast by Material Type, 2020 to 2035
  • Table 46: South Asia and Pacific Market Volume (Units) Forecast by Material Type, 2020 to 2035
  • Table 47: South Asia and Pacific Market Value (USD Million) Forecast by End Use, 2020 to 2035
  • Table 48: South Asia and Pacific Market Volume (Units) Forecast by End Use, 2020 to 2035
  • Table 49: East Asia Market Value (USD Million) Forecast by Country, 2020 to 2035
  • Table 50: East Asia Market Volume (Units) Forecast by Country, 2020 to 2035
  • Table 51: East Asia Market Value (USD Million) Forecast by Capacity, 2020 to 2035
  • Table 52: East Asia Market Volume (Units) Forecast by Capacity, 2020 to 2035
  • Table 53: East Asia Market Value (USD Million) Forecast by Material Type, 2020 to 2035
  • Table 54: East Asia Market Volume (Units) Forecast by Material Type, 2020 to 2035
  • Table 55: East Asia Market Value (USD Million) Forecast by End Use, 2020 to 2035
  • Table 56: East Asia Market Volume (Units) Forecast by End Use, 2020 to 2035
  • Table 57: Middle East and Africa Market Value (USD Million) Forecast by Country, 2020 to 2035
  • Table 58: Middle East and Africa Market Volume (Units) Forecast by Country, 2020 to 2035
  • Table 59: Middle East and Africa Market Value (USD Million) Forecast by Capacity, 2020 to 2035
  • Table 60: Middle East and Africa Market Volume (Units) Forecast by Capacity, 2020 to 2035
  • Table 61: Middle East and Africa Market Value (USD Million) Forecast by Material Type, 2020 to 2035
  • Table 62: Middle East and Africa Market Volume (Units) Forecast by Material Type, 2020 to 2035
  • Table 63: Middle East and Africa Market Value (USD Million) Forecast by End Use, 2020 to 2035
  • Table 64: Middle East and Africa Market Volume (Units) Forecast by End Use, 2020 to 2035

List of Figures

  • Figure 1: Global Market Value (USD Million) by Capacity, 2025 to 2035
  • Figure 2: Global Market Value (USD Million) by Material Type, 2025 to 2035
  • Figure 3: Global Market Value (USD Million) by End Use, 2025 to 2035
  • Figure 4: Global Market Value (USD Million) by Region, 2025 to 2035
  • Figure 5: Global Market Value (USD Million) Analysis by Region, 2020 to 2035
  • Figure 6: Global Market Volume (Units) Analysis by Region, 2020 to 2035
  • Figure 7: Global Market Value Share (%) and BPS Analysis by Region, 2025 to 2035
  • Figure 8: Global Market Y-o-Y Growth (%) Projections by Region, 2025 to 2035
  • Figure 9: Global Market Value (USD Million) Analysis by Capacity, 2020 to 2035
  • Figure 10: Global Market Volume (Units) Analysis by Capacity, 2020 to 2035
  • Figure 11: Global Market Value Share (%) and BPS Analysis by Capacity, 2025 to 2035
  • Figure 12: Global Market Y-o-Y Growth (%) Projections by Capacity, 2025 to 2035
  • Figure 13: Global Market Value (USD Million) Analysis by Material Type, 2020 to 2035
  • Figure 14: Global Market Volume (Units) Analysis by Material Type, 2020 to 2035
  • Figure 15: Global Market Value Share (%) and BPS Analysis by Material Type, 2025 to 2035
  • Figure 16: Global Market Y-o-Y Growth (%) Projections by Material Type, 2025 to 2035
  • Figure 17: Global Market Value (USD Million) Analysis by End Use, 2020 to 2035
  • Figure 18: Global Market Volume (Units) Analysis by End Use, 2020 to 2035
  • Figure 19: Global Market Value Share (%) and BPS Analysis by End Use, 2025 to 2035
  • Figure 20: Global Market Y-o-Y Growth (%) Projections by End Use, 2025 to 2035
  • Figure 21: Global Market Attractiveness by Capacity, 2025 to 2035
  • Figure 22: Global Market Attractiveness by Material Type, 2025 to 2035
  • Figure 23: Global Market Attractiveness by End Use, 2025 to 2035
  • Figure 24: Global Market Attractiveness by Region, 2025 to 2035
  • Figure 25: North America Market Value (USD Million) by Capacity, 2025 to 2035
  • Figure 26: North America Market Value (USD Million) by Material Type, 2025 to 2035
  • Figure 27: North America Market Value (USD Million) by End Use, 2025 to 2035
  • Figure 28: North America Market Value (USD Million) by Country, 2025 to 2035
  • Figure 29: North America Market Value (USD Million) Analysis by Country, 2020 to 2035
  • Figure 30: North America Market Volume (Units) Analysis by Country, 2020 to 2035
  • Figure 31: North America Market Value Share (%) and BPS Analysis by Country, 2025 to 2035
  • Figure 32: North America Market Y-o-Y Growth (%) Projections by Country, 2025 to 2035
  • Figure 33: North America Market Value (USD Million) Analysis by Capacity, 2020 to 2035
  • Figure 34: North America Market Volume (Units) Analysis by Capacity, 2020 to 2035
  • Figure 35: North America Market Value Share (%) and BPS Analysis by Capacity, 2025 to 2035
  • Figure 36: North America Market Y-o-Y Growth (%) Projections by Capacity, 2025 to 2035
  • Figure 37: North America Market Value (USD Million) Analysis by Material Type, 2020 to 2035
  • Figure 38: North America Market Volume (Units) Analysis by Material Type, 2020 to 2035
  • Figure 39: North America Market Value Share (%) and BPS Analysis by Material Type, 2025 to 2035
  • Figure 40: North America Market Y-o-Y Growth (%) Projections by Material Type, 2025 to 2035
  • Figure 41: North America Market Value (USD Million) Analysis by End Use, 2020 to 2035
  • Figure 42: North America Market Volume (Units) Analysis by End Use, 2020 to 2035
  • Figure 43: North America Market Value Share (%) and BPS Analysis by End Use, 2025 to 2035
  • Figure 44: North America Market Y-o-Y Growth (%) Projections by End Use, 2025 to 2035
  • Figure 45: North America Market Attractiveness by Capacity, 2025 to 2035
  • Figure 46: North America Market Attractiveness by Material Type, 2025 to 2035
  • Figure 47: North America Market Attractiveness by End Use, 2025 to 2035
  • Figure 48: North America Market Attractiveness by Country, 2025 to 2035
  • Figure 49: Latin America Market Value (USD Million) by Capacity, 2025 to 2035
  • Figure 50: Latin America Market Value (USD Million) by Material Type, 2025 to 2035
  • Figure 51: Latin America Market Value (USD Million) by End Use, 2025 to 2035
  • Figure 52: Latin America Market Value (USD Million) by Country, 2025 to 2035
  • Figure 53: Latin America Market Value (USD Million) Analysis by Country, 2020 to 2035
  • Figure 54: Latin America Market Volume (Units) Analysis by Country, 2020 to 2035
  • Figure 55: Latin America Market Value Share (%) and BPS Analysis by Country, 2025 to 2035
  • Figure 56: Latin America Market Y-o-Y Growth (%) Projections by Country, 2025 to 2035
  • Figure 57: Latin America Market Value (USD Million) Analysis by Capacity, 2020 to 2035
  • Figure 58: Latin America Market Volume (Units) Analysis by Capacity, 2020 to 2035
  • Figure 59: Latin America Market Value Share (%) and BPS Analysis by Capacity, 2025 to 2035
  • Figure 60: Latin America Market Y-o-Y Growth (%) Projections by Capacity, 2025 to 2035
  • Figure 61: Latin America Market Value (USD Million) Analysis by Material Type, 2020 to 2035
  • Figure 62: Latin America Market Volume (Units) Analysis by Material Type, 2020 to 2035
  • Figure 63: Latin America Market Value Share (%) and BPS Analysis by Material Type, 2025 to 2035
  • Figure 64: Latin America Market Y-o-Y Growth (%) Projections by Material Type, 2025 to 2035
  • Figure 65: Latin America Market Value (USD Million) Analysis by End Use, 2020 to 2035
  • Figure 66: Latin America Market Volume (Units) Analysis by End Use, 2020 to 2035
  • Figure 67: Latin America Market Value Share (%) and BPS Analysis by End Use, 2025 to 2035
  • Figure 68: Latin America Market Y-o-Y Growth (%) Projections by End Use, 2025 to 2035
  • Figure 69: Latin America Market Attractiveness by Capacity, 2025 to 2035
  • Figure 70: Latin America Market Attractiveness by Material Type, 2025 to 2035
  • Figure 71: Latin America Market Attractiveness by End Use, 2025 to 2035
  • Figure 72: Latin America Market Attractiveness by Country, 2025 to 2035
  • Figure 73: Western Europe Market Value (USD Million) by Capacity, 2025 to 2035
  • Figure 74: Western Europe Market Value (USD Million) by Material Type, 2025 to 2035
  • Figure 75: Western Europe Market Value (USD Million) by End Use, 2025 to 2035
  • Figure 76: Western Europe Market Value (USD Million) by Country, 2025 to 2035
  • Figure 77: Western Europe Market Value (USD Million) Analysis by Country, 2020 to 2035
  • Figure 78: Western Europe Market Volume (Units) Analysis by Country, 2020 to 2035
  • Figure 79: Western Europe Market Value Share (%) and BPS Analysis by Country, 2025 to 2035
  • Figure 80: Western Europe Market Y-o-Y Growth (%) Projections by Country, 2025 to 2035
  • Figure 81: Western Europe Market Value (USD Million) Analysis by Capacity, 2020 to 2035
  • Figure 82: Western Europe Market Volume (Units) Analysis by Capacity, 2020 to 2035
  • Figure 83: Western Europe Market Value Share (%) and BPS Analysis by Capacity, 2025 to 2035
  • Figure 84: Western Europe Market Y-o-Y Growth (%) Projections by Capacity, 2025 to 2035
  • Figure 85: Western Europe Market Value (USD Million) Analysis by Material Type, 2020 to 2035
  • Figure 86: Western Europe Market Volume (Units) Analysis by Material Type, 2020 to 2035
  • Figure 87: Western Europe Market Value Share (%) and BPS Analysis by Material Type, 2025 to 2035
  • Figure 88: Western Europe Market Y-o-Y Growth (%) Projections by Material Type, 2025 to 2035
  • Figure 89: Western Europe Market Value (USD Million) Analysis by End Use, 2020 to 2035
  • Figure 90: Western Europe Market Volume (Units) Analysis by End Use, 2020 to 2035
  • Figure 91: Western Europe Market Value Share (%) and BPS Analysis by End Use, 2025 to 2035
  • Figure 92: Western Europe Market Y-o-Y Growth (%) Projections by End Use, 2025 to 2035
  • Figure 93: Western Europe Market Attractiveness by Capacity, 2025 to 2035
  • Figure 94: Western Europe Market Attractiveness by Material Type, 2025 to 2035
  • Figure 95: Western Europe Market Attractiveness by End Use, 2025 to 2035
  • Figure 96: Western Europe Market Attractiveness by Country, 2025 to 2035
  • Figure 97: Eastern Europe Market Value (USD Million) by Capacity, 2025 to 2035
  • Figure 98: Eastern Europe Market Value (USD Million) by Material Type, 2025 to 2035
  • Figure 99: Eastern Europe Market Value (USD Million) by End Use, 2025 to 2035
  • Figure 100: Eastern Europe Market Value (USD Million) by Country, 2025 to 2035
  • Figure 101: Eastern Europe Market Value (USD Million) Analysis by Country, 2020 to 2035
  • Figure 102: Eastern Europe Market Volume (Units) Analysis by Country, 2020 to 2035
  • Figure 103: Eastern Europe Market Value Share (%) and BPS Analysis by Country, 2025 to 2035
  • Figure 104: Eastern Europe Market Y-o-Y Growth (%) Projections by Country, 2025 to 2035
  • Figure 105: Eastern Europe Market Value (USD Million) Analysis by Capacity, 2020 to 2035
  • Figure 106: Eastern Europe Market Volume (Units) Analysis by Capacity, 2020 to 2035
  • Figure 107: Eastern Europe Market Value Share (%) and BPS Analysis by Capacity, 2025 to 2035
  • Figure 108: Eastern Europe Market Y-o-Y Growth (%) Projections by Capacity, 2025 to 2035
  • Figure 109: Eastern Europe Market Value (USD Million) Analysis by Material Type, 2020 to 2035
  • Figure 110: Eastern Europe Market Volume (Units) Analysis by Material Type, 2020 to 2035
  • Figure 111: Eastern Europe Market Value Share (%) and BPS Analysis by Material Type, 2025 to 2035
  • Figure 112: Eastern Europe Market Y-o-Y Growth (%) Projections by Material Type, 2025 to 2035
  • Figure 113: Eastern Europe Market Value (USD Million) Analysis by End Use, 2020 to 2035
  • Figure 114: Eastern Europe Market Volume (Units) Analysis by End Use, 2020 to 2035
  • Figure 115: Eastern Europe Market Value Share (%) and BPS Analysis by End Use, 2025 to 2035
  • Figure 116: Eastern Europe Market Y-o-Y Growth (%) Projections by End Use, 2025 to 2035
  • Figure 117: Eastern Europe Market Attractiveness by Capacity, 2025 to 2035
  • Figure 118: Eastern Europe Market Attractiveness by Material Type, 2025 to 2035
  • Figure 119: Eastern Europe Market Attractiveness by End Use, 2025 to 2035
  • Figure 120: Eastern Europe Market Attractiveness by Country, 2025 to 2035
  • Figure 121: South Asia and Pacific Market Value (USD Million) by Capacity, 2025 to 2035
  • Figure 122: South Asia and Pacific Market Value (USD Million) by Material Type, 2025 to 2035
  • Figure 123: South Asia and Pacific Market Value (USD Million) by End Use, 2025 to 2035
  • Figure 124: South Asia and Pacific Market Value (USD Million) by Country, 2025 to 2035
  • Figure 125: South Asia and Pacific Market Value (USD Million) Analysis by Country, 2020 to 2035
  • Figure 126: South Asia and Pacific Market Volume (Units) Analysis by Country, 2020 to 2035
  • Figure 127: South Asia and Pacific Market Value Share (%) and BPS Analysis by Country, 2025 to 2035
  • Figure 128: South Asia and Pacific Market Y-o-Y Growth (%) Projections by Country, 2025 to 2035
  • Figure 129: South Asia and Pacific Market Value (USD Million) Analysis by Capacity, 2020 to 2035
  • Figure 130: South Asia and Pacific Market Volume (Units) Analysis by Capacity, 2020 to 2035
  • Figure 131: South Asia and Pacific Market Value Share (%) and BPS Analysis by Capacity, 2025 to 2035
  • Figure 132: South Asia and Pacific Market Y-o-Y Growth (%) Projections by Capacity, 2025 to 2035
  • Figure 133: South Asia and Pacific Market Value (USD Million) Analysis by Material Type, 2020 to 2035
  • Figure 134: South Asia and Pacific Market Volume (Units) Analysis by Material Type, 2020 to 2035
  • Figure 135: South Asia and Pacific Market Value Share (%) and BPS Analysis by Material Type, 2025 to 2035
  • Figure 136: South Asia and Pacific Market Y-o-Y Growth (%) Projections by Material Type, 2025 to 2035
  • Figure 137: South Asia and Pacific Market Value (USD Million) Analysis by End Use, 2020 to 2035
  • Figure 138: South Asia and Pacific Market Volume (Units) Analysis by End Use, 2020 to 2035
  • Figure 139: South Asia and Pacific Market Value Share (%) and BPS Analysis by End Use, 2025 to 2035
  • Figure 140: South Asia and Pacific Market Y-o-Y Growth (%) Projections by End Use, 2025 to 2035
  • Figure 141: South Asia and Pacific Market Attractiveness by Capacity, 2025 to 2035
  • Figure 142: South Asia and Pacific Market Attractiveness by Material Type, 2025 to 2035
  • Figure 143: South Asia and Pacific Market Attractiveness by End Use, 2025 to 2035
  • Figure 144: South Asia and Pacific Market Attractiveness by Country, 2025 to 2035
  • Figure 145: East Asia Market Value (USD Million) by Capacity, 2025 to 2035
  • Figure 146: East Asia Market Value (USD Million) by Material Type, 2025 to 2035
  • Figure 147: East Asia Market Value (USD Million) by End Use, 2025 to 2035
  • Figure 148: East Asia Market Value (USD Million) by Country, 2025 to 2035
  • Figure 149: East Asia Market Value (USD Million) Analysis by Country, 2020 to 2035
  • Figure 150: East Asia Market Volume (Units) Analysis by Country, 2020 to 2035
  • Figure 151: East Asia Market Value Share (%) and BPS Analysis by Country, 2025 to 2035
  • Figure 152: East Asia Market Y-o-Y Growth (%) Projections by Country, 2025 to 2035
  • Figure 153: East Asia Market Value (USD Million) Analysis by Capacity, 2020 to 2035
  • Figure 154: East Asia Market Volume (Units) Analysis by Capacity, 2020 to 2035
  • Figure 155: East Asia Market Value Share (%) and BPS Analysis by Capacity, 2025 to 2035
  • Figure 156: East Asia Market Y-o-Y Growth (%) Projections by Capacity, 2025 to 2035
  • Figure 157: East Asia Market Value (USD Million) Analysis by Material Type, 2020 to 2035
  • Figure 158: East Asia Market Volume (Units) Analysis by Material Type, 2020 to 2035
  • Figure 159: East Asia Market Value Share (%) and BPS Analysis by Material Type, 2025 to 2035
  • Figure 160: East Asia Market Y-o-Y Growth (%) Projections by Material Type, 2025 to 2035
  • Figure 161: East Asia Market Value (USD Million) Analysis by End Use, 2020 to 2035
  • Figure 162: East Asia Market Volume (Units) Analysis by End Use, 2020 to 2035
  • Figure 163: East Asia Market Value Share (%) and BPS Analysis by End Use, 2025 to 2035
  • Figure 164: East Asia Market Y-o-Y Growth (%) Projections by End Use, 2025 to 2035
  • Figure 165: East Asia Market Attractiveness by Capacity, 2025 to 2035
  • Figure 166: East Asia Market Attractiveness by Material Type, 2025 to 2035
  • Figure 167: East Asia Market Attractiveness by End Use, 2025 to 2035
  • Figure 168: East Asia Market Attractiveness by Country, 2025 to 2035
  • Figure 169: Middle East and Africa Market Value (USD Million) by Capacity, 2025 to 2035
  • Figure 170: Middle East and Africa Market Value (USD Million) by Material Type, 2025 to 2035
  • Figure 171: Middle East and Africa Market Value (USD Million) by End Use, 2025 to 2035
  • Figure 172: Middle East and Africa Market Value (USD Million) by Country, 2025 to 2035
  • Figure 173: Middle East and Africa Market Value (USD Million) Analysis by Country, 2020 to 2035
  • Figure 174: Middle East and Africa Market Volume (Units) Analysis by Country, 2020 to 2035
  • Figure 175: Middle East and Africa Market Value Share (%) and BPS Analysis by Country, 2025 to 2035
  • Figure 176: Middle East and Africa Market Y-o-Y Growth (%) Projections by Country, 2025 to 2035
  • Figure 177: Middle East and Africa Market Value (USD Million) Analysis by Capacity, 2020 to 2035
  • Figure 178: Middle East and Africa Market Volume (Units) Analysis by Capacity, 2020 to 2035
  • Figure 179: Middle East and Africa Market Value Share (%) and BPS Analysis by Capacity, 2025 to 2035
  • Figure 180: Middle East and Africa Market Y-o-Y Growth (%) Projections by Capacity, 2025 to 2035
  • Figure 181: Middle East and Africa Market Value (USD Million) Analysis by Material Type, 2020 to 2035
  • Figure 182: Middle East and Africa Market Volume (Units) Analysis by Material Type, 2020 to 2035
  • Figure 183: Middle East and Africa Market Value Share (%) and BPS Analysis by Material Type, 2025 to 2035
  • Figure 184: Middle East and Africa Market Y-o-Y Growth (%) Projections by Material Type, 2025 to 2035
  • Figure 185: Middle East and Africa Market Value (USD Million) Analysis by End Use, 2020 to 2035
  • Figure 186: Middle East and Africa Market Volume (Units) Analysis by End Use, 2020 to 2035
  • Figure 187: Middle East and Africa Market Value Share (%) and BPS Analysis by End Use, 2025 to 2035
  • Figure 188: Middle East and Africa Market Y-o-Y Growth (%) Projections by End Use, 2025 to 2035
  • Figure 189: Middle East and Africa Market Attractiveness by Capacity, 2025 to 2035
  • Figure 190: Middle East and Africa Market Attractiveness by Material Type, 2025 to 2035
  • Figure 191: Middle East and Africa Market Attractiveness by End Use, 2025 to 2035
  • Figure 192: Middle East and Africa Market Attractiveness by Country, 2025 to 2035

Frequently Asked Questions

What was the overall size of the BFS Syringes Market in 2025?

The overall market size for BFS Syringes Market was USD 1.1 Billion in 2025.

How big the bio is based BFS Syringes Market expected in 2035?

The BFS Syringes Market is expected to reach USD 2.4 Billion in 2035.

What will drive the demand for BFS Syringes Market during the forecast period?

The BFS Syringes Market will grow due to increasing pharmaceutical demand, eco-friendly materials, and rising personal care applications across capacity segments.

List the top 5 countries contributing in BFS Syringes Market?

The top 5 countries which drives the development of BFS Syringes Market are USA, European Union, Japan, South Korea and UK.

Which segment in type is expected to lead BFS Syringes Market?

0.5-1 ml and 1-3 ml Syringes demand supplier to command significant share over the assessment period.

Explore Similar Insights

Future Market Insights

BFS Syringes Market