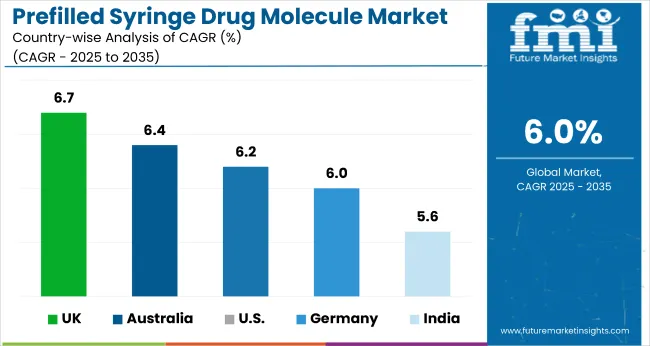
Prefilled Syringes Drug Molecules Market
Market Insights on Prefilled Syringes Drug Molecules covering sales outlook, demand forecast & up-to-date key trends
Prefilled Syringes Drug Molecules Market by Drug Class (Vaccines, Insulin, Adrenaline, Opioids, Others), Application (Cardiovascular Diseases, Diabetes, Immunization, Pain Management, Others), End User (Hospital Pharmacies, Retail Pharmacies, Online Pharmacies, Drug Stores) & Region - Forecast 2022 - 2028
Prefilled Syringes Drug Molecules Market Outlook (2022-2028)
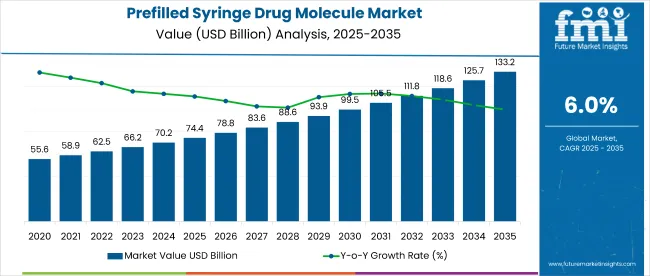
[306 Pages Report] The global Prefilled Syringes Drug Molecules Market is set to be valued at US$ 56 Bn in 2022, and is projected to expand at a CAGR of 5.6% to close in on a valuation of US$ 77.7 Bn by 2028.
Prefilled Syringes Drug Molecules Market Size (2022) |
US$ 56 Bn |
Prefilled Syringes Drug Molecules Sales Forecast (2028) |
US$ 77.7 Bn |
Global Market Growth Rate (2022 to 2028) |
5.6% CAGR |
Share of Top 5 Prefilled Syringes Drug Molecules Providers |
55% |
At present, sales of prefilled syringes drug molecules account for around 23% market share of the global drug delivery market. Demand for prefilled syringes drug molecules in online pharmacies is likely to increase at a CAGR of 6.2% over the assessment period of 2022 to 2028.
Let us know your requirement to get
100% FREE customization
How The Market Progressed Till June 2022?
Particulars |
Details |
H1, 2021 |
5.69% |
H1, 2022 Projected |
5.59% |
H1, 2022 Outlook |
4.99% |
BPS Change - H1, 2022 (O) – H1, 2022 (P) |
(-) 60 ↓ |
BPS Change – H1, 2022 (O) – H1, 2021 |
(-) 70 ↓ |
The comparative analysis and market growth rate of global prefilled syringes drug molecules market as studied by Future Market Insights, will show a negative BPS growth in H1-2022 outlook as compared to H1-2022 projected period by 60 BPS, and, a decline in BPS values is expected in H1-2022 over H1- 2021 duration with 70 Basis Point Share (BPS).
The global prefilled syringes drug molecules market is subject to device regulations, biological safety assessment, approval of new biologics, and sustainable product development features, as per all the macro and industry standards.
The key developments in the market include the advancements in the parenteral administration of APIs, and the siliconization of pre-filled syringes to prevent the interaction of the API molecules with the syringe glass and to protect the drug integrity. The market is highly influenced by the rapid growth and development of novel biologics, and targeted molecular entities such as interferons, monoclonal antibodies, peptides, and vaccines.
The market decline observed through the reduction in the BPS values is addressed by the presence of reported cases of presence of extractables and leachables in the vials compromising the effectiveness of a drug. Moreover, associated similarly to drug integrity, the presence of product recall activities have further disrupted the market growth and is hence associated with the reduced BPS values.
Prefilled Syringes Drug Molecules Consumption Analysis (2012-2021) in Comparison to Market Outlook (2022-2028)
The global prefilled syringes drug molecules market witnessed a growth rate of 5.3% over the historical period of 2012 to 2028.
Prefilled syringes drug delivery is preferred over conventional vials as it comes with various benefits such as less over-filling as well as safe and convenient use, thus driving demand for prefilled syringes drug molecules.
Prefilled syringes drug delivery is convenient for those patients that require parenteral administration of drugs on a daily/weekly basis and long-term treatment. As such, they prefer self-administrated devices as they don’t have to remain dependent on doctors for each dosage.
Prefilled syringes provide inexpensive home setting medication and reduce time consumed at in-patient and out-patient care units. For patients requiring frequent dose administration on a weekly and daily basis, use of prefilled syringes drug molecules reduces the average cost per injection when compared to vials and ampoules.
There is also a decrease in the reliance on healthcare professionals in many regions, and this is likely to boost the small molecule prefilled syringes market. Revenue growth of the market is mainly driven by the effectiveness, convenience, and ease of use of prefilled syringes. This has attracted various healthcare professionals and patients to use prefilled syringe products.
In addition, the minimal contamination of drug molecules and self-administration of drugs at home settings has increased demand for prefilled syringes drug molecules. Prefilled syringe manufacturers are focusing on introducing updated technologies and advanced prefilled syringe products to attract more customers.
Pharmaceutical companies are introducing generic versions for cost-effective auto-injector devices, and are targeting emerging regions to sustain and grow in the global prefilled syringes drug molecules market.
Overall, the global prefilled syringes drug molecules market is slated to surge at a CAGR of 5.6% from 2022 to 2028.
What Makes North America the Largest Regional Market for Prefilled Syringes Drug Molecules?
On the basis of region, North America is expected to lead the global market for prefilled syringes drug molecules. The North American regional market is expected to account for 30.6% share in 2022, closely followed by Western Europe.
Rising need for self-administered equipment for patients' regular prescription doses, breakthroughs in technology, well-developed pharmaceutical system, and growing adoption of auto-injector devices are driving market growth in the region.
Prefilled syringe manufacturers are being compelled to develop cost-effective auto-injector devices as a result of increased global investments in healthcare development, greater disposable income, and improving standard of life.
Find your sweet spots for generating winning opportunities in this market.
Talk to AnalystCountry-wise Analysis
How is the U.S. Prefilled Syringes Drug Molecules Market Faring?
The U.S. prefilled syringes drug molecules market is flourishing as a result of rising lifestyle-related disorders and the growing desire for easy-to-administer injectables among chronic disease patients.
In the market, there is a huge concentration of vendors who sell both, end products and original components. Availability of qualified vendors ensures high usage of prefilled syringes in the United States.
Will Manufacturers of Prefilled Syringes Drug Molecules Gain Profits in China?
Increased pharmaceutical development, ageing population, healthcare innovations, and the highest number of diabetic patients are factors driving prefilled syringes drug molecules demand growth in China.
Prefilled syringe providers are concentrating their efforts in China to strengthen their positions in the global market. This is one of the areas where China is projected to see significant growth in the next few years.
Furthermore, China is predicted to rise significantly in the market over the forecast period as a result of market participants expanding their businesses by investing in new manufacturing facilities.
Category-wise Insights
Which Drug Class Will Hold Maximum Sway in Prefilled Syringes Drug Molecules?
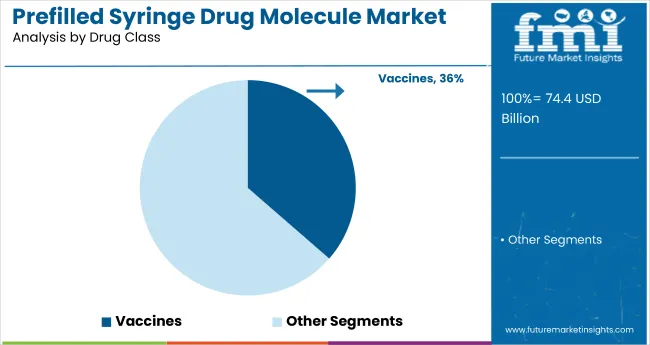
On the basis of drug class, vaccines are anticipated to register the highest CAGR over the forecast period. Sales of vaccines are projected to increase 2.1X by 2028.
Vaccines are antigenic substances prepared from the causative agent of a disease or a synthetic substitute, used to provide immunity against one or several diseases. Vaccines stimulate the immune system to make antibodies in the same way that it does when a person is exposed to a disease.
Vaccination is a simple, safe, and efficient technique to protect oneself from deadly diseases before they infect. It strengthens the immune system by utilizing the body's own defences to create resistance to specific pathogens.
Due to the rapid production of coronavirus vaccines, the impact of COVID-19 on pharmaceutical packaging is projected to be significant. Growing adoption of prefilled syringes for vaccination purposes is set to fueling prefilled syringes drug molecules consumption over the coming years.
Which End User of Prefilled Syringes Drug Molecules Will Emerge as a Key Market Contributor?
In terms of end users, sales of prefilled syringes drug molecules through online pharmacies is projected to register a high growth rate of 6.2% over the forecast period.
Growing trend of self-care, which is fueled by the easy availability of technological gadgets that lessen the need for visits to healthcare professionals, is likely to stifle the growth of hospital pharmacies. Furthermore, online pharmacies assist individuals with chronic illnesses such as diabetes and allergies.
Patients who need to take regular injection doses prefer to get their prescriptions from online order pharmacies. This assists in lowering the total cost to the patient during the course of treatment. Products offered through online pharmacies must be created with the patient's comfort in mind.

A unified Market Research Subscription Platform, built for today's disparate research needs.
Impact of COVID-19 on Prefilled Syringes Drug Molecules Demand Growth
The COVID-19 pandemic and subsequent lockdowns in several nations throughout the world have had a financial impact on enterprises in all sectors, including the healthcare sector.
The COVID-19 pandemic, which began in 2020, affected healthcare delivery all around the world, including delays in the needle or syringe-related diagnosis and treatment. As a result, the impact of COVID-19 restricted the growth of the global prefilled syringes drug molecules market. The pandemic has had an influence on the market, and the impact of the pandemic on medicine manufacturing and supply chain is projected to have a short-term impact on the market.
Because of the lower danger of needle-stick injuries, prefilled syringes are becoming more popular than glass ampoules or any other additional needles. As a result, producers are increasing their production capacity in order to scale up the production of the COVID-19 vaccine. Demand for prefilled syringe products has increased as a result of the COVID-19 pandemic.
Competitive Landscape
The global prefilled syringes drug molecules market is highly competitive due to the presence of well-established top players. However, prefilled syringes drug molecules brands such as EpiPen auto-injector and BD Physioject disposable auto-injector have strategically maintained their position in the market owing to a distinctive value proposition such as providing more precision and accurate dosages.
For instance,
- In December 2020, BD (Becton, Dickinson and Company) decided to invest approximately US$ 1.2 Bn over the next four years to broaden and enhance its production capabilities and innovation for pre-fillable syringes (PFS) and advanced drug delivery systems (ADDS) throughout its six global production sites, as well as to open a new assembly plant in Spain.
Prefilled Syringes Drug Molecules Industry Report Scope
Attribute |
Details |
Forecast Period |
2022-2028 |
Historical Data Available for |
2012-2021 |
Market Analysis |
Value in US$ Mn |
Key Regions Covered |
|
Key Countries Covered |
|
Key Market Segments Covered |
|
Key Companies Profiled |
|
Pricing |
Available upon Request |
Key Segments of Prefilled Syringes Drug Molecules Industry Research
By Drug Class :
- Vaccines
- Insulin
- Adrenaline
- Opioids
- Others
By Application :
- Prefilled Syringes Drug Molecules for Cardiovascular Diseases
- Prefilled Syringes Drug Molecules for Diabetes
- Prefilled Syringes Drug Molecules for Immunization
- Prefilled Syringes Drug Molecules for Pain Management
- Others
By End User :
- Prefilled Syringes Drug Molecules Sold at Hospital Pharmacies
- Prefilled Syringes Drug Molecules Sold at Retail Pharmacies
- Prefilled Syringes Drug Molecules Sold through Online Pharmacies
- Prefilled Syringes Drug Molecules Sold at Drug Stores
By Region :
- North America Prefilled Syringes Drug Molecules Market
- Latin America Prefilled Syringes Drug Molecules Market
- Europe Prefilled Syringes Drug Molecules Market
- East Asia Prefilled Syringes Drug Molecules Market
- South Asia & Pacific Prefilled Syringes Drug Molecules Market
- Middle East & Africa (MEA) Prefilled Syringes Drug Molecules Market
Frequently Asked Questions
How much is the prefilled syringes drug molecules market worth?
The global prefilled syringes drug molecules market is currently valued at around US$ 56 Bn.
What are the drivers for the prefilled syringes drug molecules market?
Rising self-medication and digitalization as well as lower costs and increased efficiency of prefilled syringes are driving market growth.
Which region is expected to witness significant demand for prefilled syringes drug molecules over the coming years?
North America is the largest and fastest-growing regional market for prefilled syringes drug molecules at an expected CAGR of 6.2% over the forecast period.
Who are the leading vendors of prefilled syringes drug molecules?
Amgen Inc., Teva Pharmaceutical Industries Ltd., AstraZeneca plc, Mylan N.V., and Pfizer, Inc. are identified as leading providers of prefilled syringes drug molecules.
Which segment provides the most opportunity for the growth of prefilled syringes drug molecules suppliers?
Vaccines account for 50% share of the prefilled syringes drug molecules industry.
What is the projected CAGR of the prefilled syringes drug molecules market for the forecast period (2022-2028)?
The global prefilled syringes drug molecules market is expected to exhibit a CAGR of 5.6% over the forecast period (2022-2028).
Table of Content
1. Executive Summary 1.1. Market Overview 1.2. Market Analysis 1.3. FMI Analysis and Recommendations 1.4. Wheel of Fortune 2. Market Introduction 2.1. Market Taxonomy 2.2. Market Definition 3. Prefilled Syringes Drug Molecules Market View Point 3.1. Macro-Economic Factors 3.2. Opportunity Analysis 4. North America Prefilled Syringes Drug Molecules Market Analysis 2012–2021 and Forecast 2022–2028 4.1. Introduction 4.2. Regional Market Dynamics 4.2.1. Drivers 4.2.2. Restraints 4.2.3. Trends 4.3. Historical Market Size (US$ Mn) By Country, 2012-2021 4.3.1. U.S. 4.3.2. Canada 4.4. Market Size (US$ Mn) Forecast By Country, 2022-2028 4.4.1. U.S. 4.4.2. Canada 4.5. Historical Market Size (US$ Mn) By Drug Class, 2012–2021 4.5.1. Vaccines 4.5.2. Insulin 4.5.3. Adrenaline 4.5.4. Opioids 4.5.5. Others 4.6. Market Size (US$ Mn) Forecast By Drug Class, 2022–2028 4.6.1. Vaccines 4.6.2. Insulin 4.6.3. Adrenaline 4.6.4. Opioids 4.6.5. Others 4.7. Historical Market Size (US$ Mn) Analysis By Application , 2012-2021 4.7.1. Cardiovascular Diseases 4.7.2. Diabetes 4.7.3. Immunization 4.7.4. Pain Management 4.7.5. Others 4.8. Market Size (US$ Mn) Forecast By Application , 2022-2028 4.8.1. Cardiovascular Diseases 4.8.2. Diabetes 4.8.3. Immunization 4.8.4. Pain Management 4.8.5. Others 4.9. Historical Market Size (US$ Mn) Analysis By End User, 2012–2021 4.9.1. Hospital Pharmacies 4.9.2. Retail Pharmacies 4.9.3. Online Pharmacies 4.9.4. Drug stores 4.10. Market Size (US$ Mn) Forecast By End User, 2022–2028 4.10.1. Hospital Pharmacies 4.10.2. Retail Pharmacies 4.10.3. Online Pharmacies 4.10.4. Drug stores 4.11. Drivers and Restraints: Impact Analysis 4.12. Market Attractiveness Analysis 4.12.1. By Country 4.12.2. By Drug Class 4.12.3. By Application 4.12.4. By End User 4.13. Key Representative Market Participants 4.14. Key Participants Market Presence (Intensity Map) 5. Latin America Prefilled Syringes Drug Molecules Market Analysis 2012–2021 and Forecast 2022–2028 5.1. Introduction 5.2. Regional Market Dynamics 5.2.1. Drivers 5.2.2. Restraints 5.2.3. Trends 5.3. Historical Market Size (US$ Mn) Analysis By Country, 2012-2021 5.3.1. Brazil 5.3.2. Mexico 5.3.3. Rest of Latin America 5.4. Market Size (US$ Mn) Forecast By Country, 2022–2028 5.4.1. Brazil 5.4.2. Mexico 5.4.3. Rest of Latin America 5.5. Historical Market Size (US$ Mn) Analysis By Drug Class, 2012–2021 5.5.1. Vaccines 5.5.2. Insulin 5.5.3. Adrenaline 5.5.4. Opioids 5.5.5. Others 5.6. Market Size (US$ Mn) Forecast By Drug Class, 2022–2028 5.6.1. Vaccines 5.6.2. Insulin 5.6.3. Adrenaline 5.6.4. Opioids 5.6.5. Others 5.7. Historical Market Size (US$ Mn) Analysis By Application , 2012-2021 5.7.1. Cardiovascular Diseases 5.7.2. Diabetes 5.7.3. Immunization 5.7.4. Pain Management 5.7.5. Others 5.8. Market Size (US$ Mn) Forecast By Application , 2022-2028 5.8.1. Cardiovascular Diseases 5.8.2. Diabetes 5.8.3. Immunization 5.8.4. Pain Management 5.8.5. Others 5.9. Historical Market Size (US$ Mn) Analysis By End User, 2012–2021 5.9.1. Hospital Pharmacies 5.9.2. Retail Pharmacies 5.9.3. Online Pharmacies 5.9.4. Drug stores 5.10. Market Size (US$ Mn) Forecast By End User, 2022–2028 5.10.1. Hospital Pharmacies 5.10.2. Retail Pharmacies 5.10.3. Online Pharmacies 5.10.4. Drug stores 5.11. Drivers and Restraints: Impact Analysis 5.12. Market Attractiveness Analysis 5.12.1. By Country 5.12.2. By Drug Class 5.12.3. By Application 5.12.4. By End User 5.13. Key Representative Market Participants 5.14. Key Participants Market Presence (Intensity Map) 6. Western Europe Prefilled Syringes Drug Molecules Market Analysis 2012–2021 and Forecast 2022–2028 6.1. Introduction 6.2. Regional Market Dynamics 6.2.1. Drivers 6.2.2. Restraints 6.2.3. Trends 6.3. Historical Market Size (US$ Mn) Analysis By Country, 2012-2021 6.3.1. United Kingdom 6.3.2. Germany 6.3.3. France 6.3.4. Italy 6.3.5. Spain 6.3.6. Nordic Region 6.3.7. Rest of Western Europe 6.4. Market Size (US$ Mn) Forecast By Country, 2022-2028 6.4.1. United Kingdom 6.4.2. Germany 6.4.3. France 6.4.4. Italy 6.4.5. Spain 6.4.6. Nordic Region 6.4.7. Rest of Western Europe 6.5. Historical Market Size (US$ Mn) Analysis By Drug Class, 2012–2021 6.5.1. Vaccines 6.5.2. Insulin 6.5.3. Adrenaline 6.5.4. Opioids 6.5.5. Others 6.6. Market Size (US$ Mn) Forecast By Drug Class, 2022–2028 6.6.1. Vaccines 6.6.2. Insulin 6.6.3. Adrenaline 6.6.4. Opioids 6.6.5. Others 6.7. Historical Market Size (US$ Mn) Analysis By Application , 2012-2021 6.7.1. Cardiovascular Diseases 6.7.2. Diabetes 6.7.3. Immunization 6.7.4. Pain Management 6.7.5. Others 6.8. Market Size (US$ Mn) Forecast By Application , 2022-2028 6.8.1. Cardiovascular Diseases 6.8.2. Diabetes 6.8.3. Immunization 6.8.4. Pain Management 6.8.5. Others 6.9. Historical Market Size (US$ Mn) Analysis By End User, 2012–2021 6.9.1. Hospital Pharmacies 6.9.2. Retail Pharmacies 6.9.3. Online Pharmacies 6.9.4. Drug stores 6.10. Market Size (US$ Mn) Forecast By End User, 2022–2028 6.10.1. Hospital Pharmacies 6.10.2. Retail Pharmacies 6.10.3. Online Pharmacies 6.10.4. Drug stores 6.11. Drivers and Restraints: Impact Analysis 6.12. Market Attractiveness Analysis 6.12.1. By Country 6.12.2. By Drug Class 6.12.3. By Application 6.12.4. By End User 6.13. Key Representative Market Participants 6.14. Key Participants Market Presence (Intensity Map) 7. Eastern Europe Prefilled Syringes Drug Molecules Market Analysis 2012–2021 and Forecast 2022–2028 7.1. Introduction 7.2. Regional Market Dynamics 7.2.1. Drivers 7.2.2. Restraints 7.2.3. Trends 7.3. Historical Market Size (US$ Mn) Analysis By Country, 2012-2021 7.3.1. Russia 7.3.2. Poland 7.3.3. Rest of Eastern Europe 7.4. Market Size (US$ Mn) Forecast By Country, 2022-2028 7.4.1. Russia 7.4.2. Poland 7.4.3. Rest of Eastern Europe 7.5. Historical Market Size (US$ Mn) Analysis By Drug Class, 2012–2022 7.5.1. Vaccines 7.5.2. Insulin 7.5.3. Adrenaline 7.5.4. Opioids 7.5.5. Others 7.6. Market Size (US$ Mn) Forecast By Drug Class, 2022–2028 7.6.1. Vaccines 7.6.2. Insulin 7.6.3. Adrenaline 7.6.4. Opioids 7.6.5. Others 7.7. Historical Market Size (US$ Mn) Analysis By Application , 2012-2022 7.7.1. Cardiovascular Diseases 7.7.2. Diabetes 7.7.3. Immunization 7.7.4. Pain Management 7.7.5. Others 7.8. Market Size (US$ Mn) Forecast By Application , 2022-2028 7.8.1. Cardiovascular Diseases 7.8.2. Diabetes 7.8.3. Immunization 7.8.4. Pain Management 7.8.5. Others 7.9. Historical Market Size (US$ Mn) Analysis By End User, 2012–2022 7.9.1. Hospital Pharmacies 7.9.2. Retail Pharmacies 7.9.3. Online Pharmacies 7.9.4. Drug stores 7.10. Market Size (US$ Mn) Forecast By End User, 2022–2028 7.10.1. Hospital Pharmacies 7.10.2. Retail Pharmacies 7.10.3. Online Pharmacies 7.10.4. Drug stores 7.11. Drivers and Restraints: Impact Analysis 7.12. Market Attractiveness Analysis 7.12.1. By Country 7.12.2. By Drug Class 7.12.3. By Application 7.12.4. By End User 7.13. Key Representative Market Participants 7.14. Key Participants Market Presence (Intensity Map) 8. Asia Pacific Excluding Japan Prefilled Syringes Drug Molecules Market Analysis 2012–2021 and Forecast 2022–2028 8.1. Introduction 8.2. Regional Market Dynamics 8.2.1. Drivers 8.2.2. Restraints 8.2.3. Trends 8.3. Historical Market Size (US$ Mn) Analysis By Country, 2012-2021 8.3.1. China 8.3.2. India 8.3.3. Australia and New Zealand 8.3.4. ASEAN 8.3.5. Rest of APEJ 8.4. Market Size (US$ Mn) Forecast By Country, 2022-2028 8.4.1. China 8.4.2. India 8.4.3. Australia and New Zealand 8.4.4. ASEAN 8.4.5. Rest of APEJ 8.5. Historical Market Size (US$ Mn) Analysis By Drug Class, 2012–2018 8.5.1. Vaccines 8.5.2. Insulin 8.5.3. Adrenaline 8.5.4. Opioids 8.5.5. Others 8.6. Market Size (US$ Mn) Forecast By Drug Class, 2018–2028 8.6.1. Vaccines 8.6.2. Insulin 8.6.3. Adrenaline 8.6.4. Opioids 8.6.5. Others 8.7. Historical Market Size (US$ Mn) Analysis By Application , 2012-2018 8.7.1. Cardiovascular Diseases 8.7.2. Diabetes 8.7.3. Immunization 8.7.4. Pain Management 8.7.5. Others 8.8. Market Size (US$ Mn) Forecast By Application , 2018-2028 8.8.1. Cardiovascular Diseases 8.8.2. Diabetes 8.8.3. Immunization 8.8.4. Pain Management 8.8.5. Others 8.9. Historical Market Size (US$ Mn) Analysis By End User, 2012–2018 8.9.1. Hospital Pharmacies 8.9.2. Retail Pharmacies 8.9.3. Online Pharmacies 8.9.4. Drug stores 8.10. Market Size (US$ Mn) Forecast By End User, 2018–2028 8.10.1. Hospital Pharmacies 8.10.2. Retail Pharmacies 8.10.3. Online Pharmacies 8.10.4. Drug stores 8.11. Drivers and Restraints: Impact Analysis 8.12. Market Attractiveness Analysis 8.12.1. By Country 8.12.2. By Drug Class 8.12.3. By Application 8.12.4. By End User 8.13. Key Representative Market Participants 8.14. Key Participants Market Presence (Intensity Map) 9. Japan Prefilled Syringes Drug Molecules Market Analysis 2012–2021 and Forecast 2022–2028 9.1. Introduction 9.2. Regional Market Dynamics 9.2.1. Drivers 9.2.2. Restraints 9.2.3. Trends 9.3. Historical Market Size (US$ Mn) Analysis By Drug Class, 2012–2018 9.3.1. Vaccines 9.3.2. Insulin 9.3.3. Adrenaline 9.3.4. Opioids 9.3.5. Others 9.4. Market Size (US$ Mn) Forecast By Drug Class, 2018–2028 9.4.1. Vaccines 9.4.2. Insulin 9.4.3. Adrenaline 9.4.4. Opioids 9.4.5. Others 9.5. Historical Market Size (US$ Mn) Analysis By Application , 2012-2018 9.5.1. Cardiovascular Diseases 9.5.2. Diabetes 9.5.3. Immunization 9.5.4. Pain Management 9.5.5. Others 9.6. Market Size (US$ Mn) Forecast By Application , 2018-2028 9.6.1. Cardiovascular Diseases 9.6.2. Diabetes 9.6.3. Immunization 9.6.4. Pain Management 9.6.5. Others 9.7. Historical Market Size (US$ Mn) Analysis By End User, 2012–2018 9.7.1. Hospital Pharmacies 9.7.2. Retail Pharmacies 9.7.3. Online Pharmacies 9.7.4. Drug stores 9.8. Market Size (US$ Mn) Forecast By End User, 2018–2028 9.8.1. Hospital Pharmacies 9.8.2. Retail Pharmacies 9.8.3. Online Pharmacies 9.8.4. Drug stores 9.9. Drivers and Restraints: Impact Analysis 9.10. Market Attractiveness Analysis 9.10.1. By Drug Class 9.10.2. By Application 9.10.3. By End User 9.11. Key Representative Market Participants 9.12. Key Participants Market Presence (Intensity Map) 10. Middle East and Africa Prefilled Syringes Drug Molecules Market Analysis 2012–2021 and Forecast 2022–2028 10.1. Introduction 10.2. Regional Market Dynamics 10.2.1. Drivers 10.2.2. Restraints 10.2.3. Trends 10.3. Historical Market Size (US$ Mn) By Country, 2012-2021 10.3.1. GCC Countries 10.3.2. South Africa 10.3.3. Rest of MEA 10.4. Market Size (US$ Mn) Forecast By Country, , 2022–2028 10.4.1. GCC Countries 10.4.2. South Africa 10.4.3. Rest of MEA 10.5. Historical Market Size (US$ Mn) Analysis By Drug Class, 2012–20110 10.5.1. Vaccines 10.5.2. Insulin 10.5.3. Adrenaline 10.5.4. Opioids 10.5.5. Others 10.6. Market Size (US$ Mn) Forecast By Drug Class, 20110–20210 10.6.1. Vaccines 10.6.2. Insulin 10.6.3. Adrenaline 10.6.4. Opioids 10.6.5. Others 10.7. Historical Market Size (US$ Mn) Analysis By Application , 2012-20110 10.7.1. Cardiovascular Diseases 10.7.2. Diabetes 10.7.3. Immunization 10.7.4. Pain Management 10.7.5. Others 10.8. Market Size (US$ Mn) Forecast By Application , 20110-20210 10.8.1. Cardiovascular Diseases 10.8.2. Diabetes 10.8.3. Immunization 10.8.4. Pain Management 10.8.5. Others 10.9. Historical Market Size (US$ Mn) Analysis By End User, 2012–20110 10.9.1. Hospital Pharmacies 10.9.2. Retail Pharmacies 10.9.3. Online Pharmacies 10.9.4. Drug stores 10.10. Market Size (US$ Mn) Forecast By End User, 20110–20210 10.10.1. Hospital Pharmacies 10.10.2. Retail Pharmacies 10.10.3. Online Pharmacies 10.10.4. Drug stores 10.11. Drivers and Restraints: Impact Analysis 10.12. Market Attractiveness Analysis 10.12.1. By Country 10.12.2. By Drug Class 10.12.3. By Application 10.12.4. By End User 10.13. Key Representative Market Participants 10.14. Key Participants Market Presence (Intensity Map) 11. Forecast Factors: Relevance and Impact 12. Forecast Assumptions 13. Competition Landscape 13.1. Market Structure (2021) 13.2. Competition Dashboard 13.3. Company Profiles (Details – Overview, Financials, Strategy, Recent Developments) 13.3.1. Amgen Inc. 13.3.2. Teva Pharmaceutical Industries Ltd. 13.3.3. AstraZeneca plc 13.3.4. Mylan N.V. 13.3.5. Pfizer, Inc. 13.3.6. Fresenius Kabi AG 13.3.7. Johnson & Johnson 13.3.8. Sanofi 13.3.9. Merck & Co. Inc. 13.3.10. Novartis AG 14. Global Prefilled Syringes Drug Molecules Market Analysis 2012–2021 and Forecast 2022–2028, By Region 14.1. Introduction / Key Findings 14.2. Historical Market Size (US$ Mn) By Region 14.2.1. North America 14.2.2. Latin America 14.2.3. Western Europe 14.2.4. Eastern Europe 14.2.5. Asia Pacific Excluding Japan 14.2.6. Japan 14.2.7. Middle East and Africa 14.3. Market Size (US$ Mn) Forecast By Region 14.3.1. North America 14.3.2. Latin America 14.3.3. Western Europe 14.3.4. Eastern Europe 14.3.5. Asia Pacific Excluding Japan 14.3.6. Japan 14.3.7. Middle East and Africa 14.4. Market Attractiveness Analysis By Region 15. Global Prefilled Syringes Drug Molecules Market Analysis 2012–2021 and Forecast 2022–2028, By Drug Class 15.1. Introduction 15.2. Historical Market Size (US$ Mn) By Drug Class, 2012-2021 15.2.1. Vaccines 15.2.2. Insulin 15.2.3. Adrenaline 15.2.4. Opioids 15.2.5. Others 15.3. Market Size (US$ Mn) and Forecast By Drug Class, 2022-2028 15.3.1. Vaccines 15.3.2. Insulin 15.3.3. Adrenaline 15.3.4. Opioids 15.3.5. Others 15.4. Market Attractiveness Analysis By Drug Class 16. Global Prefilled Syringes Drug Molecules Market Analysis 2012–2021 and Forecast 2022–2028, By Application 16.1. Introduction 16.2. Historical Market Size (US$ Mn) By Application , 2012-2021 16.2.1. Cardiovascular Diseases 16.2.2. Diabetes 16.2.3. Immunization 16.2.4. Pain Management 16.2.5. Others 16.3. Market Size (US$ Mn) and Forecast By Application , 2022-2028 16.3.1. Cardiovascular Diseases 16.3.2. Diabetes 16.3.3. Immunization 16.3.4. Pain Management 16.3.5. Others 16.4. Market Attractiveness Analysis By Application 17. Global Prefilled Syringes Drug Molecules Market Analysis 2012–2022 and Forecast 2022–2028, By End User 17.1. Introduction 17.2. Historical Market Size (US$ Mn) By End User , 2012-2022 17.2.1. Hospital Pharmacies 17.2.2. Retail Pharmacies 17.2.3. Online Pharmacies 17.2.4. Drug stores 17.3. Market Size (US$ Mn) and Forecast By End User , 2022-2028 17.3.1. Hospital Pharmacies 17.3.2. Retail Pharmacies 17.3.3. Online Pharmacies 17.3.4. Drug stores 17.4. Market Attractiveness Analysis By End User 18. Global Prefilled Syringes Drug Molecules Market Analysis 2012–2021 and Forecast 2022–2028 18.1. Market Size and Y-o-Y Growth 18.2. Absolute $ Opportunity 19. Assumptions and Acronyms Used 20. Research Methodology
Let us know your requirement to get
100% FREE customization
List of Tables
Table 01: North America Prefilled Syringes Drug Molecules Market Size (US$ Mn) Analysis 2012–2021 and Forecast 2017–2028, By Country Table 02: North America Prefilled Syringes Drug Molecules Market Size (US$ Mn) Analysis 2012–2021 and Forecast 2017–2028, By Drug Class Table 03: North America Prefilled Syringes Drug Molecules Market Size (US$ Mn) Analysis 2012–2021 and Forecast 2017–2028, By Application Table 04: North America Prefilled Syringes Drug Molecules Market Size (US$ Mn) Analysis 2012–2021 and Forecast 2017–2028, By End User Table 05: Latin America Prefilled Syringes Drug Molecules Market Size (US$ Mn) Analysis 2012–2021 and Forecast 2017–2028, By Country Table 06: Latin America Prefilled Syringes Drug Molecules Market Size (US$ Mn) Analysis 2012–2021 and Forecast 2017–2028, By Drug Class Table 07: Latin America Prefilled Syringes Drug Molecules Market Size (US$ Mn) Analysis 2012–2021 and Forecast 2017–2028, By Application Table 08: Latin America Prefilled Syringes Drug Molecules Market Size (US$ Mn) Analysis 2012–2021 and Forecast 2017–2028, By End User Table 09: Western Europe Prefilled Syringes Drug Molecules Market Size (US$ Mn) Analysis 2012–2021 and Forecast 2017–2028, By Country Table 10: Western Europe Prefilled Syringes Drug Molecules Market Size (US$ Mn) Analysis 2012–2021 and Forecast 2017–2028, By Drug Class Table 11: Western Europe Prefilled Syringes Drug Molecules Market Size (US$ Mn) Analysis 2012–2021 and Forecast 2017–2028, By Application Table 12: Western Europe Prefilled Syringes Drug Molecules Market Size (US$ Mn) Analysis 2012–2021 and Forecast 2017–2028, By End User Table 13: Eastern Europe Prefilled Syringes Drug Molecules Market Size (US$ Mn) Analysis 2012–2021 and Forecast 2017–2028, By Country Table 14: Eastern Europe Prefilled Syringes Drug Molecules Market Size (US$ Mn) Analysis 2012–2021 and Forecast 2017–2028, By Drug Class Table 15: Eastern Europe Prefilled Syringes Drug Molecules Market Size (US$ Mn) Analysis 2012–2021 and Forecast 2017–2028, By Application Table 16: Eastern Europe Prefilled Syringes Drug Molecules Market Size (US$ Mn) Analysis 2012–2021 and Forecast 2017–2028, By End User Table 17: APEJ Prefilled Syringes Drug Molecules Market Size (US$ Mn) Analysis 2012–2021 and Forecast 2017–2028, By Country Table 18: APEJ Prefilled Syringes Drug Molecules Market Size (US$ Mn) Analysis 2012–2021 and Forecast 2017–2028, By Drug Class Table 19: APEJ Prefilled Syringes Drug Molecules Market Size (US$ Mn) Analysis 2012–2021 and Forecast 2017–2028, By Application Table 20: APEJ Prefilled Syringes Drug Molecules Market Size (US$ Mn) Analysis 2012–2021 and Forecast 2017–2028, By End User Table 21: Japan Prefilled Syringes Drug Molecules Market Size (US$ Mn) Analysis 2012–2021 and Forecast 2017–2028, By Drug Class Table 22: Japan Prefilled Syringes Drug Molecules Market Size (US$ Mn) Analysis 2012–2021 and Forecast 2017–2028, By Application Table 23: Japan Prefilled Syringes Drug Molecules Market Size (US$ Mn) Analysis 2012–2021 and Forecast 2017–2028, By End User Table 24: Middle East & Africa Prefilled Syringes Drug Molecules Market Size (US$ Mn) Analysis 2012–2021 and Forecast 2017–2028, By Country Table 25: Middle East & Africa Prefilled Syringes Drug Molecules Market Size (US$ Mn) Analysis 2012–2021 and Forecast 2017–2028, By Drug Class Table 26: Middle East & Africa Prefilled Syringes Drug Molecules Market Size (US$ Mn) Analysis 2012–2021 and Forecast 2017–2028, By Application Table 27: Middle East & Africa Prefilled Syringes Drug Molecules Market Size (US$ Mn) Analysis 2012–2021 and Forecast 2017–2028, By End User Table 28: Global Prefilled Syringes Drug Molecules Market Size (US$ Mn) Analysis 2012–2021 and Forecast 2017–2028, By Region Table 29: North America Prefilled Syringes Drug Molecules Market Size (US$ Mn) Analysis 2012–2021 and Forecast 2017–2028, By Drug Class Table 30: Global Prefilled Syringes Drug Molecules Market Size (US$ Mn) Analysis 2012–2021 and Forecast 2017–2028, By Application Table 31: Global Prefilled Syringes Drug Molecules Market Size (US$ Mn) Analysis 2012–2021 and Forecast 2017–2028, By End User
Find your sweet spots for generating winning opportunities in this market.
Talk to AnalystList of Charts
Figure 01: North America Prefilled Syringes Drug Molecules Market Value Share By Drug Class (2017E) Figure 02: North America Prefilled Syringes Drug Molecules Market Value Share By Application (2017E) Figure 03: North America Prefilled Syringes Drug Molecules Market Value Share By End User (2017E) Figure 04: North America Prefilled Syringes Drug Molecules Market Value Share By Country (2017E) Figure 05: North America Prefilled Syringes Drug Molecules Historical Market Size (US$ Mn) Analysis, 2012–2021 Figure 06: North America Prefilled Syringes Drug Molecules Market Size (US$ Mn) & Y-o-Y Growth (%), 2017-2028 Figure 11: U.S. Prefilled Syringes Drug Molecules Historical Market Size (US$ Mn) Analysis, 2012–2021 Figure 12: U.S. Prefilled Syringes Drug Molecules Market Size (US$ Mn) & Y-o-Y Growth (%), 2017-2028 Figure 13: Canada Prefilled Syringes Drug Molecules Historical Market Size (US$ Mn) Analysis, 2012–2021 Figure 14: Canada Prefilled Syringes Drug Molecules Market Size (US$ Mn) & Y-o-Y Growth (%), 2017-2028 Figure 15: North America Prefilled Syringes Drug Molecules Historical Market Size (US$ Mn) By Vaccines, 2012–2021 Figure 16: North America Prefilled Syringes Drug Molecules Market Size (US$ Mn) & Y-o-Y Growth (%) By Vaccines, 2017–2028 Figure 17: North America Prefilled Syringes Drug Molecules Historical Market Size (US$ Mn) By Insulin, 2012–2021 Figure 18: North America Prefilled Syringes Drug Molecules Market Size (US$ Mn) & Y-o-Y Growth (%) By Insulin, 2017–2028 Figure 19: North America Prefilled Syringes Drug Molecules Historical Market Size (US$ Mn) By Adrenaline, 2012–2021 Figure 20: North America Prefilled Syringes Drug Molecules Market Size (US$ Mn) & Y-o-Y Growth (%) By Adrenaline, 2017–2028 Figure 21: North America Prefilled Syringes Drug Molecules Historical Market Size (US$ Mn) By Opioids, 2012–2021 Figure 22: North America Prefilled Syringes Drug Molecules Market Size (US$ Mn) & Y-o-Y Growth (%) By Opioids, 2017–2028 Figure 23: North America Prefilled Syringes Drug Molecules Historical Market Size (US$ Mn) By Others, 2012–2021 Figure 24: North America Prefilled Syringes Drug Molecules Market Size (US$ Mn) & Y-o-Y Growth (%) By Others, 2017–2028 Figure 25: North America Prefilled Syringes Drug Molecules Historical Market Size (US$ Mn) By Cardiovascular Diseases, 2012–2021 Figure 26: North America Prefilled Syringes Drug Molecules Market Size (US$ Mn) & Y-o-Y Growth (%) By Cardiovascular Diseases, 2017–2028 Figure 27: North America Prefilled Syringes Drug Molecules Historical Market Size (US$ Mn) By Diabetes, 2012–2021 Figure 28: North America Prefilled Syringes Drug Molecules Market Size (US$ Mn) & Y-o-Y Growth (%) By Diabetes, 2017–2028 Figure 29: North America Prefilled Syringes Drug Molecules Historical Market Size (US$ Mn) By Immunization, 2012–2021 Figure 30: North America Prefilled Syringes Drug Molecules Market Size (US$ Mn) & Y-o-Y Growth (%) By Immunization, 2017–2028 Figure 31: North America Prefilled Syringes Drug Molecules Historical Market Size (US$ Mn) By Pain Management, 2012–2021 Figure 32: North America Prefilled Syringes Drug Molecules Market Size (US$ Mn) & Y-o-Y Growth (%) By Pain Management, 2017–2028 Figure 33: North America Prefilled Syringes Drug Molecules Historical Market Size (US$ Mn) By Others, 2012–2021 Figure 34: North America Prefilled Syringes Drug Molecules Market Size (US$ Mn) & Y-o-Y Growth (%) By Others, 2017–2028 Figure 35: North America Prefilled Syringes Drug Molecules Historical Market Size (US$ Mn) By Hospital Pharmacies, 2012–2021 Figure 36: North America Prefilled Syringes Drug Molecules Market Size (US$ Mn) & Y-o-Y Growth (%) By Hospital Pharmacies, 2017–2028 Figure 37: North America Prefilled Syringes Drug Molecules Historical Market Size (US$ Mn) By Retail Pharmacies, 2012–2021 Figure 38: North America Prefilled Syringes Drug Molecules Market Size (US$ Mn) & Y-o-Y Growth (%) By Retail Pharmacies, 2017–2028 Figure 39: North America Prefilled Syringes Drug Molecules Historical Market Size (US$ Mn) By Online Pharmacies, 2012–2021 Figure 40: North America Prefilled Syringes Drug Molecules Market Size (US$ Mn) & Y-o-Y Growth (%) By Online Pharmacies, 2017–2028 Figure 41: North America Prefilled Syringes Drug Molecules Historical Market Size (US$ Mn) By Drug Stores, 2012–2021 Figure 42: North America Prefilled Syringes Drug Molecules Market Size (US$ Mn) & Y-o-Y Growth (%) By Drug Stores, 2017–2028 Figure 43: North America Prefilled Syringes Drug Molecules Market Attractiveness Analysis By Drug Class , 2017–2028 Figure 44: North America Prefilled Syringes Drug Molecules Market Attractiveness Analysis By Application, 2017–2028 Figure 45: North America Prefilled Syringes Drug Molecules Market Attractiveness Analysis By End User, 2017–2028 Figure 46: North America Prefilled Syringes Drug Molecules Market Attractiveness Analysis By Country, 2017–2028 Figure 47: Latin America Prefilled Syringes Drug Molecules Market Value Share By Drug Class (2017E) Figure 48: Latin America Prefilled Syringes Drug Molecules Market Value Share By Application (2017E) Figure 49: Latin America Prefilled Syringes Drug Molecules Market Value Share By End User (2017E) Figure 50: Latin America Prefilled Syringes Drug Molecules Market Value Share By Country (2017E) Figure 51: Latin America Prefilled Syringes Drug Molecules Historical Market Size (US$ Mn) Analysis, 2012–2021 Figure 52: Latin America Prefilled Syringes Drug Molecules Market Size (US$ Mn) & Y-o-Y Growth (%), 2017-2028 Figure 53: Brazil Prefilled Syringes Drug Molecules Historical Market Size (US$ Mn), 2012–2021 Figure 54: Brazil Prefilled Syringes Drug Molecules Market Size (US$ Mn) & Y-o-Y Growth (%), 2017–2028 Figure 55: Mexico Prefilled Syringes Drug Molecules Historical Market Size (US$ Mn), 2012–2021 Figure 56: Mexico Prefilled Syringes Drug Molecules Market Size (US$ Mn) & Y-o-Y Growth (%), 2017–2028 Figure 57: Rest of Latin America Prefilled Syringes Drug Molecules Historical Market Size (US$ Mn), 2012–2021 Figure 58: Rest of Latin America Prefilled Syringes Drug Molecules Market Size (US$ Mn) & Y-o-Y Growth (%), 2017–2028 Figure 59: Latin America Prefilled Syringes Drug Molecules Historical Market Size (US$ Mn) By Vaccines, 2012–2021 Figure 60: Latin America Prefilled Syringes Drug Molecules Market Size (US$ Mn) & Y-o-Y Growth (%) By Vaccines, 2017–2028 Figure 61: Latin America Prefilled Syringes Drug Molecules Historical Market Size (US$ Mn) By Insulin, 2012–2021 Figure 62: Latin America Prefilled Syringes Drug Molecules Market Size (US$ Mn) & Y-o-Y Growth (%) By Insulin, 2017–2028 Figure 63: Latin America Prefilled Syringes Drug Molecules Historical Market Size (US$ Mn) By Adrenaline, 2012–2021 Figure 64: Latin America Prefilled Syringes Drug Molecules Market Size (US$ Mn) & Y-o-Y Growth (%) By Adrenaline, 2017–2028 Figure 65: Latin America Prefilled Syringes Drug Molecules Historical Market Size (US$ Mn) By Opioids, 2012–2021 Figure 66: Latin America Prefilled Syringes Drug Molecules Market Size (US$ Mn) & Y-o-Y Growth (%) By Opioids, 2017–2028 Figure 67: Latin America Prefilled Syringes Drug Molecules Historical Market Size (US$ Mn) By Others, 2012–2021 Figure 68: Latin America Prefilled Syringes Drug Molecules Market Size (US$ Mn) & Y-o-Y Growth (%) By Others, 2017–2028 Figure 69: Latin America Prefilled Syringes Drug Molecules Historical Market Size (US$ Mn) By Cardiovascular Diseases, 2012–2021 Figure 70: Latin America Prefilled Syringes Drug Molecules Market Size (US$ Mn) & Y-o-Y Growth (%) By Cardiovascular Diseases, 2017–2028 Figure 71: Latin America Prefilled Syringes Drug Molecules Historical Market Size (US$ Mn) By Diabetes, 2012–2021 Figure 72: Latin America Prefilled Syringes Drug Molecules Market Size (US$ Mn) & Y-o-Y Growth (%) By Diabetes, 2017–2028 Figure 73: Latin America Prefilled Syringes Drug Molecules Historical Market Size (US$ Mn) By Immunization, 2012–2021 Figure 74: Latin America Prefilled Syringes Drug Molecules Market Size (US$ Mn) & Y-o-Y Growth (%) By Immunization, 2017–2028 Figure 75: Latin America Prefilled Syringes Drug Molecules Historical Market Size (US$ Mn) By Pain Management, 2012–2021 Figure 76: Latin America Prefilled Syringes Drug Molecules Market Size (US$ Mn) & Y-o-Y Growth (%) By Pain Management, 2017–2028 Figure 77: Latin America Prefilled Syringes Drug Molecules Historical Market Size (US$ Mn) By Others, 2012–2021 Figure 78: Latin America Prefilled Syringes Drug Molecules Market Size (US$ Mn) & Y-o-Y Growth (%) By Others, 2017–2028 Figure 79: Latin America Prefilled Syringes Drug Molecules Historical Market Size (US$ Mn) By Hospital Pharmacies, 2012–2021 Figure 80: Latin America Prefilled Syringes Drug Molecules Market Size (US$ Mn) & Y-o-Y Growth (%) By Hospital Pharmacies, 2017–2028 Figure 81: Latin America Prefilled Syringes Drug Molecules Historical Market Size (US$ Mn) By Retail Pharmacies, 2012–2021 Figure 82: Latin America Prefilled Syringes Drug Molecules Market Size (US$ Mn) & Y-o-Y Growth (%) By Retail Pharmacies, 2017–2028 Figure 83: Latin America Prefilled Syringes Drug Molecules Historical Market Size (US$ Mn) By Online Pharmacies, 2012–2021 Figure 84: Latin America Prefilled Syringes Drug Molecules Market Size (US$ Mn) & Y-o-Y Growth (%) By Online Pharmacies, 2017–2028 Figure 85: Latin America Prefilled Syringes Drug Molecules Historical Market Size (US$ Mn) By Drug Stores, 2012–2021 Figure 86: Latin America Prefilled Syringes Drug Molecules Market Size (US$ Mn) & Y-o-Y Growth (%) By Drug Stores, 2017–2028 Figure 87: Latin America Prefilled Syringes Drug Molecules Market Attractiveness Analysis By Drug Class , 2017–2028 Figure 88: Latin America Prefilled Syringes Drug Molecules Market Attractiveness Analysis By Application, 2017–2028 Figure 89: Latin America Prefilled Syringes Drug Molecules Market Attractiveness Analysis By End User, 2017–2028 Figure 90: Latin America Prefilled Syringes Drug Molecules Market Attractiveness Analysis By Country, 2017–2028 Figure 91: Western Europe Prefilled Syringes Drug Molecules Market Value Share By Drug Class (2017E) Figure 92: Western Europe Prefilled Syringes Drug Molecules Market Value Share By Application (2017E) Figure 93: Western Europe Prefilled Syringes Drug Molecules Market Value Share By End User (2017E) Figure 94: Western Europe Prefilled Syringes Drug Molecules Market Value Share By Country (2017E) Figure 95: Western Europe Prefilled Syringes Drug Molecules Historical Market Size (US$ Mn) Analysis, 2012–2021 Figure 96: Western Europe Prefilled Syringes Drug Molecules Market Size (US$ Mn) & Y-o-Y Growth (%), 2017-2028 Figure 97: U.K. Prefilled Syringes Drug Molecules Historical Market Size (US$ Mn) By 2012–2021 Figure 98: U.K. Prefilled Syringes Drug Molecules Market Size (US$ Mn) & Y-o-Y Growth (%) 2017–2028 Figure 99: Germany Prefilled Syringes Drug Molecules Historical Market Size (US$ Mn), 2012–2021 Figure 100: Germany Prefilled Syringes Drug Molecules Market Size (US$ Mn) & Y-o-Y Growth (%), 2017–2028 Figure 101: France Prefilled Syringes Drug Molecules Historical Market Size (US$ Mn) By, 2012–2021 Figure 102: France Prefilled Syringes Drug Molecules Market Size (US$ Mn) & Y-o-Y Growth (%), 2017–2028 Figure 103: Italy Prefilled Syringes Drug Molecules Historical Market Size (US$ Mn), 2012–2021 Figure 104: Italy Prefilled Syringes Drug Molecules Market Size (US$ Mn) & Y-o-Y Growth (%), 2017–2028 Figure 105: Spain Prefilled Syringes Drug Molecules Historical Market Size (US$ Mn), 2012–2021 Figure 106: Spain Prefilled Syringes Drug Molecules Market Size (US$ Mn) & Y-o-Y Growth (%), 2017–2028 Figure 107: Nordics Prefilled Syringes Drug Molecules Historical Market Size (US$ Mn), 2012–2021 Figure 108: Nordics Prefilled Syringes Drug Molecules Market Size (US$ Mn) & Y-o-Y Growth (%), 2017–2028 Figure 109: Rest of Western Europe Prefilled Syringes Drug Molecules Historical Market Size (US$ Mn), 2012–2021 Figure 110: Rest of Western Europe Prefilled Syringes Drug Molecules Market Size (US$ Mn) & Y-o-Y Growth (%), 2017–2028 Figure 111: Western Europe Prefilled Syringes Drug Molecules Historical Market Size (US$ Mn) By Vaccines, 2012–2021 Figure 112: Western Europe Prefilled Syringes Drug Molecules Market Size (US$ Mn) & Y-o-Y Growth (%) By Vaccines, 2017–2028 Figure 113: Western Europe Prefilled Syringes Drug Molecules Historical Market Size (US$ Mn) By Insulin, 2012–2021 Figure 114: Western Europe Prefilled Syringes Drug Molecules Market Size (US$ Mn) & Y-o-Y Growth (%) By Insulin, 2017–2028 Figure 115: Western Europe Prefilled Syringes Drug Molecules Historical Market Size (US$ Mn) By Adrenaline, 2012–2021 Figure 116: Western Europe Prefilled Syringes Drug Molecules Market Size (US$ Mn) & Y-o-Y Growth (%) By Adrenaline, 2017–2028 Figure 117: Western Europe Prefilled Syringes Drug Molecules Historical Market Size (US$ Mn) By Opioids, 2012–2021 Figure 118: Western Europe Prefilled Syringes Drug Molecules Market Size (US$ Mn) & Y-o-Y Growth (%) By Opioids, 2017–2028 Figure 119: Western Europe Prefilled Syringes Drug Molecules Historical Market Size (US$ Mn) By Others, 2012–2021 Figure 120: Western Europe Prefilled Syringes Drug Molecules Market Size (US$ Mn) & Y-o-Y Growth (%) By Others, 2017–2028 Figure 121: Western Europe Prefilled Syringes Drug Molecules Historical Market Size (US$ Mn) By Cardiovascular Diseases, 2012–2021 Figure 122: Western Europe Prefilled Syringes Drug Molecules Market Size (US$ Mn) & Y-o-Y Growth (%) By Cardiovascular Diseases, 2017–2028 Figure 123: Western Europe Prefilled Syringes Drug Molecules Historical Market Size (US$ Mn) By Diabetes, 2012–2021 Figure 124: Western Europe Prefilled Syringes Drug Molecules Market Size (US$ Mn) & Y-o-Y Growth (%) By Diabetes, 2017–2028 Figure 125: Western Europe Prefilled Syringes Drug Molecules Historical Market Size (US$ Mn) By Immunization, 2012–2021 Figure 126: Western Europe Prefilled Syringes Drug Molecules Market Size (US$ Mn) & Y-o-Y Growth (%) By Immunization, 2017–2028 Figure 127: Western Europe Prefilled Syringes Drug Molecules Historical Market Size (US$ Mn) By Pain Management, 2012–2021 Figure 128: Western Europe Prefilled Syringes Drug Molecules Market Size (US$ Mn) & Y-o-Y Growth (%) By Pain Management, 2017–2028 Figure 129: Western Europe Prefilled Syringes Drug Molecules Historical Market Size (US$ Mn) By Others, 2012–2021 Figure 130: Western Europe Prefilled Syringes Drug Molecules Market Size (US$ Mn) & Y-o-Y Growth (%) By Others, 2017–2028 Figure 131: Western Europe Prefilled Syringes Drug Molecules Historical Market Size (US$ Mn) By Hospital Pharmacies, 2012–2021 Figure 132: Western Europe Prefilled Syringes Drug Molecules Market Size (US$ Mn) & Y-o-Y Growth (%) By Hospital Pharmacies, 2017–2028 Figure 133: Western Europe Prefilled Syringes Drug Molecules Historical Market Size (US$ Mn) By Retail Pharmacies, 2012–2021 Figure 134: Western Europe Prefilled Syringes Drug Molecules Market Size (US$ Mn) & Y-o-Y Growth (%) By Retail Pharmacies, 2017–2028 Figure 135: Western Europe Prefilled Syringes Drug Molecules Historical Market Size (US$ Mn) By Online Pharmacies, 2012–2021 Figure 136: Western Europe Prefilled Syringes Drug Molecules Market Size (US$ Mn) & Y-o-Y Growth (%) By Online Pharmacies, 2017–2028 Figure 137: Western Europe Prefilled Syringes Drug Molecules Historical Market Size (US$ Mn) By Drug Stores, 2012–2021 Figure 138: Western Europe Prefilled Syringes Drug Molecules Market Size (US$ Mn) & Y-o-Y Growth (%) By Drug Stores, 2017–2028 Figure 139: Western Europe Prefilled Syringes Drug Molecules Market Attractiveness Analysis By Drug Class , 2017–2028 Figure 140: Western Europe Prefilled Syringes Drug Molecules Market Attractiveness Analysis By Application, 2017–2028 Figure 141: Western Europe Prefilled Syringes Drug Molecules Market Attractiveness Analysis By End User, 2017–2028 Figure 142: Western Europe Prefilled Syringes Drug Molecules Market Attractiveness Analysis By Country, 2017–2028 Figure 143: Eastern Europe Prefilled Syringes Drug Molecules Market Value Share By Drug Class (2017E) Figure 144: Eastern Europe Prefilled Syringes Drug Molecules Market Value Share By Application (2017E) Figure 145: Eastern Europe Prefilled Syringes Drug Molecules Market Value Share By End User(2017) Figure 146: Eastern Europe Prefilled Syringes Drug Molecules Market Value Share By Country (2017) Figure 147: Eastern Europe Prefilled Syringes Drug Molecules Historical Market Size (US$ Mn) Analysis, 2012–2021 Figure 148: Eastern Europe Prefilled Syringes Drug Molecules Market Size (US$ Mn) & Y-o-Y Growth (%), 2017-2028 Figure 149: Russia Prefilled Syringes Drug Molecules Historical Market Size (US$ Mn), 2012–2021 Figure 150: Russia Prefilled Syringes Drug Molecules Market Size (US$ Mn) & Y-o-Y Growth (%), 2017–2028 Figure 151: Poland Prefilled Syringes Drug Molecules Historical Market Size (US$ Mn), 2012–2021 Figure 152: Poland Prefilled Syringes Drug Molecules Market Size (US$ Mn) & Y-o-Y Growth (%), 2017–2028 Figure 153: Rest of Eastern Europe Prefilled Syringes Drug Molecules Historical Market Size (US$ Mn), 2012–2021 Figure 154: Rest of Eastern Europe Prefilled Syringes Drug Molecules Market Size (US$ Mn) & Y-o-Y Growth (%), 2017–2028 Figure 155: Eastern Europe Prefilled Syringes Drug Molecules Historical Market Size (US$ Mn) By Vaccines, 2012–2021 Figure 156: Eastern Europe Prefilled Syringes Drug Molecules Market Size (US$ Mn) & Y-o-Y Growth (%) By Vaccines, 2017–2028 Figure 157: Eastern Europe Prefilled Syringes Drug Molecules Historical Market Size (US$ Mn) By Insulin, 2012–2021 Figure 158: Eastern Europe Prefilled Syringes Drug Molecules Market Size (US$ Mn) & Y-o-Y Growth (%) By Insulin, 2017–2028 Figure 159: Eastern Europe Prefilled Syringes Drug Molecules Historical Market Size (US$ Mn) By Adrenaline, 2012–2021 Figure 160: Eastern Europe Prefilled Syringes Drug Molecules Market Size (US$ Mn) & Y-o-Y Growth (%) By Adrenaline, 2017–2028 Figure 161: Eastern Europe Prefilled Syringes Drug Molecules Historical Market Size (US$ Mn) By Opioids, 2012–2021 Figure 162: Eastern Europe Prefilled Syringes Drug Molecules Market Size (US$ Mn) & Y-o-Y Growth (%) By Opioids, 2017–2028 Figure 163: Eastern Europe Prefilled Syringes Drug Molecules Historical Market Size (US$ Mn) By Others, 2012–2021 Figure 164: Eastern Europe Prefilled Syringes Drug Molecules Market Size (US$ Mn) & Y-o-Y Growth (%) By Others, 2017–2028 Figure 165: Eastern Europe Prefilled Syringes Drug Molecules Historical Market Size (US$ Mn) By Cardiovascular Diseases, 2012–2021 Figure 166: Eastern Europe Prefilled Syringes Drug Molecules Market Size (US$ Mn) & Y-o-Y Growth (%) By Cardiovascular Diseases, 2017–2028 Figure 167: Eastern Europe Prefilled Syringes Drug Molecules Historical Market Size (US$ Mn) By Diabetes, 2012–2021 Figure 168: Eastern Europe Prefilled Syringes Drug Molecules Market Size (US$ Mn) & Y-o-Y Growth (%) By Diabetes, 2017–2028 Figure 169: Eastern Europe Prefilled Syringes Drug Molecules Historical Market Size (US$ Mn) By Immunization, 2012–2021 Figure 170: Eastern Europe Prefilled Syringes Drug Molecules Market Size (US$ Mn) & Y-o-Y Growth (%) By Immunization, 2017–2028 Figure 171: Eastern Europe Prefilled Syringes Drug Molecules Historical Market Size (US$ Mn) By Pain Management, 2012–2021 Figure 172: Eastern Europe Prefilled Syringes Drug Molecules Market Size (US$ Mn) & Y-o-Y Growth (%) By Pain Management, 2017–2028 Figure 173: Eastern Europe Prefilled Syringes Drug Molecules Historical Market Size (US$ Mn) By Others, 2012–2021 Figure 174: Eastern Europe Prefilled Syringes Drug Molecules Market Size (US$ Mn) & Y-o-Y Growth (%) By Others, 2017–2028 Figure 175: Eastern Europe Prefilled Syringes Drug Molecules Historical Market Size (US$ Mn) By Hospital Pharmacies, 2012–2021 Figure 176: Eastern Europe Prefilled Syringes Drug Molecules Market Size (US$ Mn) & Y-o-Y Growth (%) By Hospital Pharmacies, 2017–2028 Figure 177: Eastern Europe Prefilled Syringes Drug Molecules Historical Market Size (US$ Mn) By Retail Pharmacies, 2012–2021 Figure 178: Eastern Europe Prefilled Syringes Drug Molecules Market Size (US$ Mn) & Y-o-Y Growth (%) By Retail Pharmacies, 2017–2028 Figure 179: Eastern Europe Prefilled Syringes Drug Molecules Historical Market Size (US$ Mn) By Online Pharmacies, 2012–2021 Figure 180: Eastern Europe Prefilled Syringes Drug Molecules Market Size (US$ Mn) & Y-o-Y Growth (%) By Online Pharmacies, 2017–2028 Figure 181: Eastern Europe Prefilled Syringes Drug Molecules Historical Market Size (US$ Mn) By Drug Stores, 2012–2021 Figure 182: Eastern Europe Prefilled Syringes Drug Molecules Market Size (US$ Mn) & Y-o-Y Growth (%) By Drug Stores, 2017–2028 Figure 183: Eastern Europe Prefilled Syringes Drug Molecules Market Attractiveness Analysis By Drug Class , 2017–2028 Figure 184: Eastern Europe Prefilled Syringes Drug Molecules Market Attractiveness Analysis By Application, 2017–2028 Figure 185: Eastern Europe Prefilled Syringes Drug Molecules Market Attractiveness Analysis By End User, 2017–2028 Figure 186: Eastern Europe Prefilled Syringes Drug Molecules Market Attractiveness Analysis By Country, 2017–2028 Figure 187: APEJ Prefilled Syringes Drug Molecules Market Value Share By Drug Class (2017E) Figure 188: APEJ Prefilled Syringes Drug Molecules Market Value Share By Application (2017E) Figure 189: APEJ Prefilled Syringes Drug Molecules Market Value Share By End User (2017E) Figure 190: APEJ Prefilled Syringes Drug Molecules Market Value Share By Country (2017E) Figure 191: APEJ Prefilled Syringes Drug Molecules Historical Market Size (US$ Mn) Analysis, 2012–2021 Figure 192: APEJ Prefilled Syringes Drug Molecules Market Size (US$ Mn) & Y-o-Y Growth (%), 2017-2028 Figure 193: China Prefilled Syringes Drug Molecules Historical Market Size (US$ Mn), 2012–2021 Figure 194: China Prefilled Syringes Drug Molecules Market Size (US$ Mn) & Y-o-Y Growth (%), 2017–2028 Figure 195: India Prefilled Syringes Drug Molecules Historical Market Size (US$ Mn), 2012–2021 Figure 196: India Prefilled Syringes Drug Molecules Market Size (US$ Mn) & Y-o-Y Growth (%), 2017–2028 Figure 197: Australia & New Zealand Prefilled Syringes Drug Molecules Historical Market Size (US$ Mn), 2012–2021 Figure 198: Australia & New Zealand Prefilled Syringes Drug Molecules Market Size (US$ Mn) & Y-o-Y Growth (%), 2017–2028 Figure 199: ASEAN Prefilled Syringes Drug Molecules Historical Market Size (US$ Mn) By, 2012–2021 Figure 200: ASEAN Prefilled Syringes Drug Molecules Market Size (US$ Mn) & Y-o-Y Growth (%), 2017–2028 Figure 201: Rest of APEJ Prefilled Syringes Drug Molecules Historical Market Size (US$ Mn), 2012–2021 Figure 202: Rest of APEJ Prefilled Syringes Drug Molecules Market Size (US$ Mn) & Y-o-Y Growth (%), 2017–2028 Figure 203: APEJ Prefilled Syringes Drug Molecules Historical Market Size (US$ Mn) By Vaccines, 2012–2021 Figure 204: APEJ Prefilled Syringes Drug Molecules Market Size (US$ Mn) & Y-o-Y Growth (%) By Vaccines, 2017–2028 Figure 205: APEJ Prefilled Syringes Drug Molecules Historical Market Size (US$ Mn) By Insulin, 2012–2021 Figure 206: APEJ Prefilled Syringes Drug Molecules Market Size (US$ Mn) & Y-o-Y Growth (%) By Insulin, 2017–2028 Figure 207: APEJ Prefilled Syringes Drug Molecules Historical Market Size (US$ Mn) By Adrenaline, 2012–2021 Figure 208: APEJ Prefilled Syringes Drug Molecules Market Size (US$ Mn) & Y-o-Y Growth (%) By Adrenaline, 2017–2028 Figure 209: APEJ Prefilled Syringes Drug Molecules Historical Market Size (US$ Mn) By Opioids, 2012–2021 Figure 210: APEJ Prefilled Syringes Drug Molecules Market Size (US$ Mn) & Y-o-Y Growth (%) By Opioids, 2017–2028 Figure 211: APEJ Prefilled Syringes Drug Molecules Historical Market Size (US$ Mn) By Others, 2012–2021 Figure 212: APEJ Prefilled Syringes Drug Molecules Market Size (US$ Mn) & Y-o-Y Growth (%) By Others, 2017–2028 Figure 213: APEJ Prefilled Syringes Drug Molecules Historical Market Size (US$ Mn) By Cardiovascular Diseases, 2012–2021 Figure 214: APEJ Prefilled Syringes Drug Molecules Market Size (US$ Mn) & Y-o-Y Growth (%) By Cardiovascular Diseases, 2017–2028 Figure 215: APEJ Prefilled Syringes Drug Molecules Historical Market Size (US$ Mn) By Diabetes, 2012–2021 Figure 216: APEJ Prefilled Syringes Drug Molecules Market Size (US$ Mn) & Y-o-Y Growth (%) By Diabetes, 2017–2028 Figure 217: APEJ Prefilled Syringes Drug Molecules Historical Market Size (US$ Mn) By Immunization, 2012–2021 Figure 218: APEJ Prefilled Syringes Drug Molecules Market Size (US$ Mn) & Y-o-Y Growth (%) By Immunization, 2017–2028 Figure 219: APEJ Prefilled Syringes Drug Molecules Historical Market Size (US$ Mn) By Pain Management, 2012–2021 Figure 220: APEJ Prefilled Syringes Drug Molecules Market Size (US$ Mn) & Y-o-Y Growth (%) By Pain Management, 2017–2028 Figure 221: APEJ Prefilled Syringes Drug Molecules Historical Market Size (US$ Mn) By Others, 2012–2021 Figure 222: APEJ Prefilled Syringes Drug Molecules Market Size (US$ Mn) & Y-o-Y Growth (%) By Others, 2017–2028 Figure 223: APEJ Prefilled Syringes Drug Molecules Historical Market Size (US$ Mn) By Hospital Pharmacies, 2012–2021 Figure 224: APEJ Prefilled Syringes Drug Molecules Market Size (US$ Mn) & Y-o-Y Growth (%) By Hospital Pharmacies, 2017–2028 Figure 225: APEJ Prefilled Syringes Drug Molecules Historical Market Size (US$ Mn) By Retail Pharmacies, 2012–2021 Figure 226: APEJ Prefilled Syringes Drug Molecules Market Size (US$ Mn) & Y-o-Y Growth (%) By Retail Pharmacies, 2017–2028 Figure 227: APEJ Prefilled Syringes Drug Molecules Historical Market Size (US$ Mn) By Online Pharmacies, 2012–2021 Figure 228: APEJ Prefilled Syringes Drug Molecules Market Size (US$ Mn) & Y-o-Y Growth (%) By Online Pharmacies, 2017–2028 Figure 229: APEJ Prefilled Syringes Drug Molecules Historical Market Size (US$ Mn) By Drug Stores, 2012–2021 Figure 230: APEJ Prefilled Syringes Drug Molecules Market Size (US$ Mn) & Y-o-Y Growth (%) By Drug Stores, 2017–2028 Figure 231: APEJ Prefilled Syringes Drug Molecules Market Attractiveness Analysis By Drug Class, 2017–2028 Figure 232: APEJ Prefilled Syringes Drug Molecules Market Attractiveness Analysis By Application, 2017–2028 Figure 233: APEJ Prefilled Syringes Drug Molecules Market Attractiveness Analysis By Therapeutic Area, 2017–2028 Figure 234: APEJ Prefilled Syringes Drug Molecules Market Attractiveness Analysis By Country, 2017–2028 Figure 235: Japan Prefilled Syringes Drug Molecules Market Value Share By Drug Class (2017) Figure 236: Japan Prefilled Syringes Drug Molecules Market Value Share By Application (2017) Figure 237: Japan Prefilled Syringes Drug Molecules Market Value Share By End User (2017) Figure 238: Japan Prefilled Syringes Drug Molecules Historical Market Size (US$ Mn) Analysis, 2012–2021 Figure 239: Japan Prefilled Syringes Drug Molecules Market Size (US$ Mn) & Y-o-Y Growth (%), 2017–2028 Figure 240: Japan Prefilled Syringes Drug Molecules Historical Market Size (US$ Mn) By Vaccines, 2012–2021 Figure 241: Japan Prefilled Syringes Drug Molecules Market Size (US$ Mn) & Y-o-Y Growth (%) By Vaccines, 2017–2028 Figure 242: Japan Prefilled Syringes Drug Molecules Historical Market Size (US$ Mn) By Insulin, 2012–2021 Figure 243: Japan Prefilled Syringes Drug Molecules Market Size (US$ Mn) & Y-o-Y Growth (%) By Insulin, 2017–2028 Figure 244: Japan Prefilled Syringes Drug Molecules Historical Market Size (US$ Mn) By Adrenaline, 2012–2021 Figure 245: Japan Prefilled Syringes Drug Molecules Market Size (US$ Mn) & Y-o-Y Growth (%) By Adrenaline, 2017–2028 Figure 246: Japan Prefilled Syringes Drug Molecules Historical Market Size (US$ Mn) By Opioids, 2012–2021 Figure 247: Japan Prefilled Syringes Drug Molecules Market Size (US$ Mn) & Y-o-Y Growth (%) By Opioids, 2017–2028 Figure 248: Japan Prefilled Syringes Drug Molecules Historical Market Size (US$ Mn) By Others, 2012–2021 Figure 249: Japan Prefilled Syringes Drug Molecules Market Size (US$ Mn) & Y-o-Y Growth (%) By Others, 2017–2028 Figure 250: Japan Prefilled Syringes Drug Molecules Historical Market Size (US$ Mn) By Cardiovascular Diseases, 2012–2021 Figure 251: Japan Prefilled Syringes Drug Molecules Market Size (US$ Mn) & Y-o-Y Growth (%) By Cardiovascular Diseases, 2017–2028 Figure 252: Japan Prefilled Syringes Drug Molecules Historical Market Size (US$ Mn) By Diabetes, 2012–2021 Figure 253: Japan Prefilled Syringes Drug Molecules Market Size (US$ Mn) & Y-o-Y Growth (%) By Diabetes, 2017–2028 Figure 254: Japan Prefilled Syringes Drug Molecules Historical Market Size (US$ Mn) By Immunization, 2012–2021 Figure 255: Japan Prefilled Syringes Drug Molecules Market Size (US$ Mn) & Y-o-Y Growth (%) By Immunization, 2017–2028 Figure 256: Japan Prefilled Syringes Drug Molecules Historical Market Size (US$ Mn) By Pain Management, 2012–2021 Figure 257: Japan Prefilled Syringes Drug Molecules Market Size (US$ Mn) & Y-o-Y Growth (%) By Pain Management, 2017–2028 Figure 258: Japan Prefilled Syringes Drug Molecules Historical Market Size (US$ Mn) By Others, 2012–2021 Figure 259: Japan Prefilled Syringes Drug Molecules Market Size (US$ Mn) & Y-o-Y Growth (%) By Others, 2017–2028 Figure 260: Japan Prefilled Syringes Drug Molecules Historical Market Size (US$ Mn) By Hospital Pharmacies, 2012–2021 Figure 261: Japan Prefilled Syringes Drug Molecules Market Size (US$ Mn) & Y-o-Y Growth (%) By Hospital Pharmacies, 2017–2028 Figure 262: Japan Prefilled Syringes Drug Molecules Historical Market Size (US$ Mn) By Retail Pharmacies, 2012–2021 Figure 263: Japan Prefilled Syringes Drug Molecules Market Size (US$ Mn) & Y-o-Y Growth (%) By Retail Pharmacies, 2017–2028 Figure 264: Japan Prefilled Syringes Drug Molecules Historical Market Size (US$ Mn) By Online Pharmacies, 2012–2021 Figure 265: Japan Prefilled Syringes Drug Molecules Market Size (US$ Mn) & Y-o-Y Growth (%) By Online Pharmacies, 2017–2028 Figure 266: Japan Prefilled Syringes Drug Molecules Historical Market Size (US$ Mn) By Drug Stores, 2012–2021 Figure 267: Japan Prefilled Syringes Drug Molecules Market Size (US$ Mn) & Y-o-Y Growth (%) By Drug Stores, 2017–2028 Figure 268: Japan Prefilled Syringes Drug Molecules Market Attractiveness Analysis By Drug Class, 2017–2028 Figure 269: Japan Prefilled Syringes Drug Molecules Market Attractiveness Analysis By Application, 2017–2028 Figure 270: Japan Prefilled Syringes Drug Molecules Market Attractiveness Analysis By End User, 2017–2028 Figure 271: Middle East & Africa Prefilled Syringes Drug Molecules Market Value Share By Drug Class (2017E) Figure 272: Middle East & Africa Prefilled Syringes Drug Molecules Market Value Share By Application (2017E) Figure 273: Middle East & Africa Prefilled Syringes Drug Molecules Market Value Share By End User (2017E) Figure 274: Middle East & Africa Prefilled Syringes Drug Molecules Market Value Share By Country (2017E) Figure 275: Middle East & Africa Prefilled Syringes Drug Molecules Historical Market Size (US$ Mn) Analysis, 2012–2021 Figure 276: Middle East & Africa Prefilled Syringes Drug Molecules Market Size (US$ Mn) & Y-o-Y Growth (%), 2017-2028 Figure 277: GCC Countries Prefilled Syringes Drug Molecules Historical Market Size (US$ Mn), 2012–2021 Figure 278: GCC Countries Prefilled Syringes Drug Molecules Market Size (US$ Mn) & Y-o-Y Growth (%), 2017–2028 Figure 279: South Africa Prefilled Syringes Drug Molecules Historical Market Size (US$ Mn), 2012–2021 Figure 280: South Africa Prefilled Syringes Drug Molecules Market Size (US$ Mn) & Y-o-Y Growth (%), 2017–2028 Figure 281: Rest of Middle East & Africa Prefilled Syringes Drug Molecules Historical Market Size (US$ Mn), 2012–2021 Figure 282:Rest of Middle East & Africa Prefilled Syringes Drug Molecules Market Size (US$ Mn) & Y-o-Y Growth (%), 2017–2028 Figure 283: Middle East & Africa Prefilled Syringes Drug Molecules Historical Market Size (US$ Mn) By Vaccines, 2012–2021 Figure 284: Middle East & Africa Prefilled Syringes Drug Molecules Market Size (US$ Mn) & Y-o-Y Growth (%) By Vaccines, 2017–2028 Figure 285: Middle East & Africa Prefilled Syringes Drug Molecules Historical Market Size (US$ Mn) By Insulin, 2012–2021 Figure 286: Middle East & Africa Prefilled Syringes Drug Molecules Market Size (US$ Mn) & Y-o-Y Growth (%) By Insulin, 2017–2028 Figure 287: Middle East & Africa Prefilled Syringes Drug Molecules Historical Market Size (US$ Mn) By Adrenaline, 2012–2021 Figure 288: Middle East & Africa Prefilled Syringes Drug Molecules Market Size (US$ Mn) & Y-o-Y Growth (%) By Adrenaline, 2017–2028 Figure 289: Middle East & Africa Prefilled Syringes Drug Molecules Historical Market Size (US$ Mn) By Opioids, 2012–2021 Figure 290: Middle East & Africa Prefilled Syringes Drug Molecules Market Size (US$ Mn) & Y-o-Y Growth (%) By Opioids, 2017–2028 Figure 291: Middle East & Africa Prefilled Syringes Drug Molecules Historical Market Size (US$ Mn) By Others, 2012–2021 Figure 292: Middle East & Africa Prefilled Syringes Drug Molecules Market Size (US$ Mn) & Y-o-Y Growth (%) By Others, 2017–2028 Figure 293: Middle East & Africa Prefilled Syringes Drug Molecules Historical Market Size (US$ Mn) By Cardiovascular Diseases, 2012–2021 Figure 294: Middle East & Africa Prefilled Syringes Drug Molecules Market Size (US$ Mn) & Y-o-Y Growth (%) By Cardiovascular Diseases, 2017–2028 Figure 295: Middle East & Africa Prefilled Syringes Drug Molecules Historical Market Size (US$ Mn) By Diabetes, 2012–2021 Figure 296: Middle East & Africa Prefilled Syringes Drug Molecules Market Size (US$ Mn) & Y-o-Y Growth (%) By Diabetes, 2017–2028 Figure 297: Middle East & Africa Prefilled Syringes Drug Molecules Historical Market Size (US$ Mn) By Immunization, 2012–2021 Figure 298: Middle East & Africa Prefilled Syringes Drug Molecules Market Size (US$ Mn) & Y-o-Y Growth (%) By Immunization, 2017–2028 Figure 299: Middle East & Africa Prefilled Syringes Drug Molecules Historical Market Size (US$ Mn) By Pain Management, 2012–2021 Figure 300: Middle East & Africa Prefilled Syringes Drug Molecules Market Size (US$ Mn) & Y-o-Y Growth (%) By Pain Management, 2017–2028 Figure 301: Middle East & Africa Prefilled Syringes Drug Molecules Historical Market Size (US$ Mn) By Others, 2012–2021 Figure 302: Middle East & Africa Prefilled Syringes Drug Molecules Market Size (US$ Mn) & Y-o-Y Growth (%) By Others, 2017–2028 Figure 303: Middle East & Africa Prefilled Syringes Drug Molecules Historical Market Size (US$ Mn) By Hospital Pharmacies, 2012–2021 Figure 304: Middle East & Africa Prefilled Syringes Drug Molecules Market Size (US$ Mn) & Y-o-Y Growth (%) By Hospital Pharmacies, 2017–2028 Figure 305: Middle East & Africa Prefilled Syringes Drug Molecules Historical Market Size (US$ Mn) By Retail Pharmacies, 2012–2021 Figure 306: Middle East & Africa Prefilled Syringes Drug Molecules Market Size (US$ Mn) & Y-o-Y Growth (%) By Retail Pharmacies, 2017–2028 Figure 307: Middle East & Africa Prefilled Syringes Drug Molecules Historical Market Size (US$ Mn) By Online Pharmacies, 2012–2021 Figure 308: Middle East & Africa Prefilled Syringes Drug Molecules Market Size (US$ Mn) & Y-o-Y Growth (%) By Online Pharmacies, 2017–2028 Figure 309: Middle East & Africa Prefilled Syringes Drug Molecules Historical Market Size (US$ Mn) By Drug Stores, 2012–2021 Figure 310: Middle East & Africa Prefilled Syringes Drug Molecules Market Size (US$ Mn) & Y-o-Y Growth (%) By Drug Stores, 2017–2028 Figure 311: Middle East & Africa Prefilled Syringes Drug Molecules Market Attractiveness Analysis By Drug Class, 2017–2028 Figure 312: Middle East & Africa Prefilled Syringes Drug Molecules Market Attractiveness Analysis By Application, 2017–2028 Figure 313: Middle East & Africa Prefilled Syringes Drug Molecules Market Attractiveness Analysis By End User, 2017–2028 Figure 314: Middle East & Africa Prefilled Syringes Drug Molecules Market Attractiveness Analysis By Country, 2017–2028 Figure 315: Global Prefilled Syringes Drug Molecules Market Y-o-Y Growth (%) 2017–2028, By Region Figure 316: Global Prefilled Syringes Drug Molecules Market Attractiveness Analysis By Region, 2017–2028 Figure 317: Global Prefilled Syringes Drug Molecules Market Y-o-Y Growth (%) 2017–2028, By Drug Class Figure 318: Global Prefilled Syringes Drug Molecules Historical Market Size (US$ Mn) By Vaccines, 2012–2021 Figure 319: Global Prefilled Syringes Drug Molecules Market Size (US$ Mn) & Y-o-Y Growth (%) By Vaccines, 2017–2028 Figure 320: Global Prefilled Syringes Drug Molecules Historical Market Size (US$ Mn) By Insulin, 2012–2021 Figure 321: Global Prefilled Syringes Drug Molecules Market Size (US$ Mn) & Y-o-Y Growth (%) By Insulin, 2017–2028 Figure 322: Global Prefilled Syringes Drug Molecules Historical Market Size (US$ Mn) By Adrenaline, 2012–2021 Figure 323: Global Prefilled Syringes Drug Molecules Market Size (US$ Mn) & Y-o-Y Growth (%) By Adrenaline, 2017–2028 Figure 324: Global Prefilled Syringes Drug Molecules Historical Market Size (US$ Mn) By Opioids, 2012–2021 Figure 325: Global Prefilled Syringes Drug Molecules Market Size (US$ Mn) & Y-o-Y Growth (%) By Opioids, 2017–2028 Figure 326: Global Prefilled Syringes Drug Molecules Historical Market Size (US$ Mn) By Others, 2012–2021 Figure 327: Global Prefilled Syringes Drug Molecules Market Size (US$ Mn) & Y-o-Y Growth (%) By Others, 2017–2028 Figure 328: Global Prefilled Syringes Drug Molecules Market Attractiveness Analysis By Drug Class, 2017–2028 Figure 329: Global Prefilled Syringes Drug Molecules Market Y-o-Y Growth (%) 2017–2028, By Application Figure 330: Global Prefilled Syringes Drug Molecules Historical Market Size (US$ Mn) By Cardiovascular Diseases, 2012–2021 Figure 331: Global Prefilled Syringes Drug Molecules Market Size (US$ Mn) & Y-o-Y Growth (%) By Cardiovascular Diseases, 2017–2028 Figure 332: Global Prefilled Syringes Drug Molecules Historical Market Size (US$ Mn) By Diabetes, 2012–2021 Figure 333: Global Prefilled Syringes Drug Molecules Market Size (US$ Mn) & Y-o-Y Growth (%) By Diabetes, 2017–2028 Figure 334: Global Prefilled Syringes Drug Molecules Historical Market Size (US$ Mn) By Immunization, 2012–2021 Figure 335: Global Prefilled Syringes Drug Molecules Market Size (US$ Mn) & Y-o-Y Growth (%) By Immunization, 2017–2028 Figure 336: Global Prefilled Syringes Drug Molecules Historical Market Size (US$ Mn) By Pain Management, 2012–2021 Figure 337: Global Prefilled Syringes Drug Molecules Market Size (US$ Mn) & Y-o-Y Growth (%) By Pain Management, 2017–2028 Figure 338: Global Prefilled Syringes Drug Molecules Historical Market Size (US$ Mn) By Others, 2012–2021 Figure 339: Global Prefilled Syringes Drug Molecules Market Size (US$ Mn) & Y-o-Y Growth (%) By Others, 2017–2028 Figure 340: Global Prefilled Syringes Drug Molecules Market Attractiveness Analysis By Application, 2017–2028 Figure 341: Global Prefilled Syringes Drug Molecules Market Y-o-Y Growth (%) 2017–2028, By End User Figure 342: Global Prefilled Syringes Drug Molecules Historical Market Size (US$ Mn) By Hospital Pharmacies, 2012–2021 Figure 343: Global Prefilled Syringes Drug Molecules Market Size (US$ Mn) & Y-o-Y Growth (%) By Hospital Pharmacies, 2017–2028 Figure 344: Global Prefilled Syringes Drug Molecules Historical Market Size (US$ Mn) By Retail Pharmacies, 2012–2021 Figure 345: Global Prefilled Syringes Drug Molecules Market Size (US$ Mn) & Y-o-Y Growth (%) By Retail Pharmacies, 2017–2028 Figure 346: Global Prefilled Syringes Drug Molecules Historical Market Size (US$ Mn) By Online Pharmacies, 2012–2021 Figure 347: Global Prefilled Syringes Drug Molecules Market Size (US$ Mn) & Y-o-Y Growth (%) By Online Pharmacies, 2017–2028 Figure 348: Global Prefilled Syringes Drug Molecules Historical Market Size (US$ Mn) By Drug Stores, 2012–2021 Figure 349: Global Prefilled Syringes Drug Molecules Market Size (US$ Mn) & Y-o-Y Growth (%) By Drug Stores, 2017–2028 Figure 350: Global Prefilled Syringes Drug Molecules Market Attractiveness Analysis By End User, 2017–2028 Figure 351: Global Prefilled Syringes Drug Molecules Market Value Analysis and Forecast, 2021–2028 (US$ Mn) Figure 352: Global Prefilled Syringes Drug Molecules Market Absolute $ Opportunity (US$ Mn), 2012–2021 Figure 353: Global Prefilled Syringes Drug Molecules Market Absolute $ Opportunity (US$ Mn), 2021–2028
Need specific information?
Request CustomizationExplore Healthcare Insights
View Reports