Safety Syringe Market Size and Share Forecast Outlook (2024 to 2034)

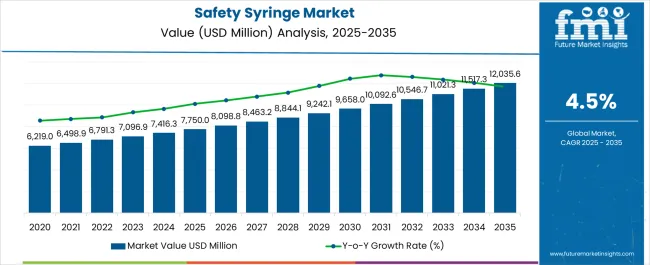
The global safety syringe market was valued at USD 7,416.3 million in 2023 and is expected to reach USD 12,054.3 million in 2034. The market is expected to surge at a CAGR of 4.5% through 2034. It is anticipated to attain a value of around USD 7,736.2 million in 2024.

Attributes Key Insights
Safety Syringe Market Size in 2023 USD 7,416.3 million
Estimated Safety Syringe Market Value (2024) USD 7,736.2 million
Forecast Safety Syringe Market Revenue (2034) USD 12,054.3 million
Value-based CAGR (2024 to 2034) 4.5%

Syringes are widely utilized in several medical settings, including hospitals and clinics, for vaccines, insulin administration, and other vital pharmacological therapies. Their uniform design allows healthcare service providers to offer consistent and controlled drug distribution, which improves patient safety and treatment efficacy.

Safety syringes are made with mechanisms that either retract, shield, or deactivate the needle after use to reduce the possibility of unintentional needlestick injuries. These syringes are frequently used in medical settings, such as blood collection, medication delivery, and immunizations.

The market for safety syringes is primarily driven by strict regulatory demands that encourage the use of safety devices, growing worries about the spread of blood-borne illnesses, and growing awareness of needlestick injuries. Continuous technological innovations and developments would aid in the creation of safer, more user-friendly syringes.

Global health initiatives such as immunization campaigns and efforts to combat infectious illnesses influence the need for safe syringes in the market. In the safety syringe industry, trends such as the growing use of self-administration tools, the demand for disposable syringes, and partnerships between significant competitors are driving growth.

Comparison of Safety Syringe Market Outlook (2019 to 2023) vs Forecast (2024 to 2034)

The global market for systematic syringes grew at a CAGR of 4.3% from 2019 to 2023. Several factors, including a greater understanding of the importance of needle stick injury prevention and healthcare worker safety, can be responsible for the rising sales of safety syringes. Healthcare workers who suffer needlestick injuries have a serious risk of contracting bloodborne infections like HIV, hepatitis B, and hepatitis C.

Safety syringes have become an essential device due to the healthcare industry's active search for ways to improve safety precautions. The healthcare industry's growing emphasis on safety at work standards and regulations is one of the key factors driving sales growth.

The usage of safety syringes has also increased due to rising awareness of infectious diseases, specifically in global health emergencies. Notably, the COVID-19 pandemic has highlighted the need for infection control procedures, compelling healthcare professionals to invest in safer medical equipment, such as syringes with enhanced security features.

Technological developments have also resulted in innovative syringe safety features, like automatic safety shields and retractable needles. These characteristics increase the general effectiveness and accessibility of healthcare environments while reducing the probability of needlestick injuries.

Considering the increasing demand for minimally invasive surgeries, technological advancements, and increased awareness of infectious diseases, the growth of safety syringes is anticipated. The global safety syringe market is expected to propel at a CAGR of 4.5% over the forecast period.

Overview of Key Opportunities Driving Growth in the Global Systematic Syringe Market

Increasing the number of internet users and raising awareness regarding e-commerce for healthcare products are changing the scenario of distribution channels. Several manufacturers are selling their products through e-commerce websites at the country level.

A handful of e-commerce websites strongly focus on disposable products only. Due to the growing usage of online sales, the growth through online sales is increasing and creating opportunities for the market.

Asia Pacific, Latin America, and the Middle East are the emerging markets in the world. Insulin syringes present a higher opportunity for safe syringes for regions with the leading population and diabetic rate in the world.

The healthcare infrastructure is developing with increasing funding and investment in research & development and technology. Hence, the demand for precise and standardized medical equipment is increasing.

Systematic syringes, with their precision in medicine administration, play an essential role in ensuring effective medication delivery. Rising healthcare investments make modern medical tools more affordable, ultimately creating a favorable environment for the market growth of safe syringes.

Overview of Restrictive Factors Limiting Growth in the Systematic Syringe Market

The unauthorized use of safety syringes for illegal purposes is a severe problem when such products are misused. Safety syringe sales for their intended medical uses can drop as a result of unethical users using this product for non-medical purposes, such as the injection of illegal narcotics.

The improper use of safety syringes contradicts the intended usage of these instruments and puts the general public's health at risk. The possibility of needle sharing among drug addicts increases the likelihood of spreading bloodborne pathogens like hepatitis and HIV.

They would add to a more significant public health emergency. Incorrect application of safety syringes has two problems: it reduces the market for appropriate medical usage and makes infectious disease transmission in communities harder. Factors such as the availability of safe syringes in the illegal marketplace and unethical usage of safe syringes could be barriers to the growth of the safe syringe market.

Safety Syringe Market Trends and Analysis

  • Safety syringe use has increased as the public's awareness of needlestick injuries and the desire to prevent them grows.
  • Using connection features and electronic technologies to track and monitor data.
  • A strong focus on preventing occupational dangers for healthcare personnel has led to a rise in the use of safety syringes in clinics and hospitals.
  • The need for safety syringes with user-friendly features has surged due to the growing interest in patients administering injectable medications independently.

Analysis of Top Countries Producing, Marketing, and Using Safety Syringes

The table below shows the estimated growth rates of the top five countries. India, China, and the United Kingdom are set to record higher CAGRs of 10.5%, 9.5%, and 2.2%, respectively, through 2034.

Countries Value CAGR
United States 1.5%
China 9.5%
Germany 1.8%
United Kingdom 2.2%
India 10.5%

Rising Number of Minimally Invasive Procedures to Push the United States

The United States contributed as the profitable market, holding a global share of around 32.3% in 2023. The United States syringe market is expected to register a CAGR of 1.5% during the forecast period, owing to the rising number of minimally invasive procedures performed in the country.

There is an increasing need for precise and regulated drug administration as these procedures become increasingly common. Safety syringes are essential to the changing landscape of medical treatments in the United States because of the increased attention to patient safety and the efficacy of medication therapy.

Changing Healthcare System in China to Boost Sales of Safety Syringes by 2034

China is projected to be the most attractive market globally in 2023, accounting for a market share of around 6.3%. Several factors, such as growing awareness of infectious disorders, a rise in healthcare spending, and the increasing prevalence of chronic disorders, are contributing to significant market growth. The need for safety syringes is further driven by the growing focus on preventative care and early intervention as China's healthcare system changes to meet the demands of an aging population.

Growing Technological Advancement to Uplift the United Kingdom’s Market

Like several other nations, the United Kingdom has laws to encourage the use of safe syringes. Manufacturers and healthcare facilities must adhere to safety regulations and recommendations. There has probably been a rise in the use of safety syringes in the United Kingdom due to growing awareness of the dangers of needlestick injuries and the significance of safety for healthcare workers.

In the United Kingdom, healthcare practices are greatly influenced by the National Health Service (NHS). The NHS's deployment of safety syringes can significantly impact market dynamics. The nation's general attitude toward medical innovation is influencing the adoption of safe syringes with cutting-edge features and technologies.

Role of Public Health Campaigns to Shape India’s Market Development

The uptake of safety syringes is impacted by the condition of the healthcare system, including hospitals and clinics in India. Healthcare facilities with adequate equipment are more likely to incorporate safety syringes into their operations. Initiatives and public health campaigns geared toward lowering needlestick injuries and encouraging the use of safety syringes are fueling market expansion.

The COVID-19 pandemic has increased public knowledge of safe measures in healthcare. The pandemic's influence may have impacted the safety of syringe adoption on the order of importance for safety precautions. Government rules, including procurement procedures and reimbursement policies, are further influencing the safety syringe market in India.

Robust Safety Standards and Regulations to Gain Traction in Japan

Manufacturers of safe syringes and other medical devices must adhere to strict regulations in Japan. Adherence to safety standards and regulations is essential for market approval and entry. Safety syringe usage is rising in Japan due to increased knowledge about needlestick injury prevention, workplace safety, and healthcare safety.

Due to its aging population, Japan has a significant demand for healthcare services. Two primary drivers driving the market for safe syringes are the state of healthcare and the requirement for safe injection procedures.

Safety Syringe Industry Analysis by Top Investment Segments

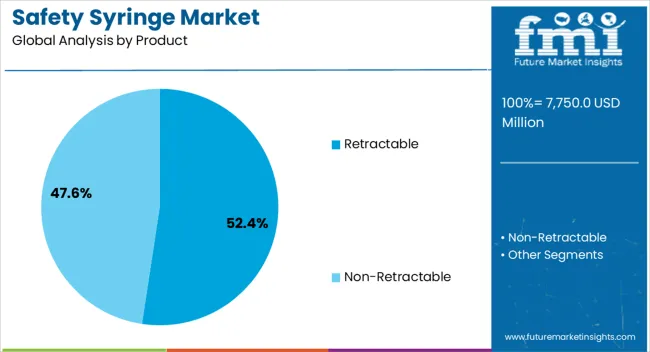
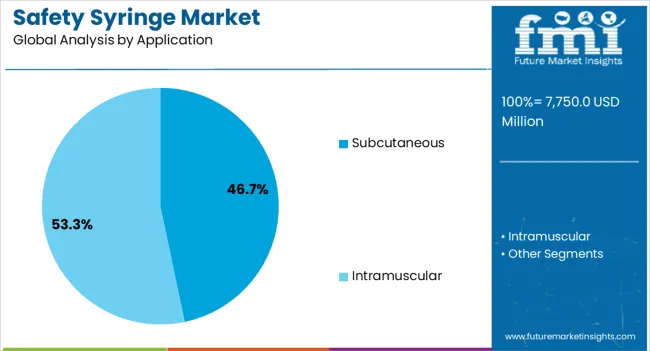
The below section shows the retractable segment dominating by product type. It is expected to thrive at a 4.1% CAGR by 2034. Based on application, the subcutaneous segment is anticipated to hold a dominant share through 2034. It is set to exhibit a CAGR of 3.2% during the forecast period.

Segment Value CAGR (2024 to 2034)
Subcutaneous (Application) 3.2%
Retractable (Product) 4.1%
Hospitals (End-user) 2.8%
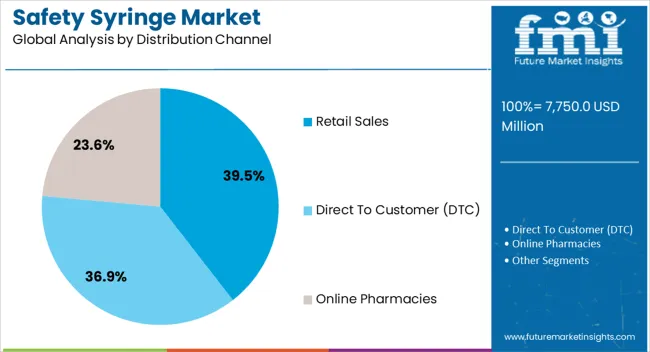
Retail Sales (Distribution Channel) 3.5%

Dominance of Retractables as Products to Continue Through 2034

The retractable segment accounted for a dominant share of 68.2% in 2023. Due to more safety measures than non-retractable safety syringes, retractable syringes usually have more significant sales.

The design of retractable syringes mechanically pulls the needle back into the barrel after use, lowering the possibility of needlestick injuries and stopping the transmission of diseases. Retractable syringes have become more prevalent in healthcare settings due to their safety benefit, which has expanded their adoption.

Demand for Safety Syringes to Remain High in Subcutaneous Application

The subcutaneous segment is leading the market with a share of 65.7% in 2023. In general, subcutaneous injections are less effective and painful than intramuscular injections, which go deeper into the muscle tissue.

Subcutaneous injections involve injecting medications into the fatty tissue just beneath the skin. Because of their smaller size, patients find subcutaneous injections utilizing systematic syringes more manageable.

Several drugs are designed to be administered subcutaneously, which makes it the preferred approach for a handful of therapeutic applications. Subcutaneous application with systematic syringes is more common due to a mix of patient comfort, convenience of administration, and pharmaceutical requirements.

Hospital Segment to Rule over Other End-users in the Market

The hospital segment is a leading end-user of the syringe market, with a 29.8% value share in 2023. The hospital segment leads the periodic syringe sales as the end-user due to the high volume of medical testing.

Safety syringes are necessary in hospitals to ensure proper medicine delivery, patient safety, and therapeutic effectiveness. Hospitals have higher revenues in this market than other end-users, including clinics or research institutions, because of the vital importance of healthcare interventions in these locations.
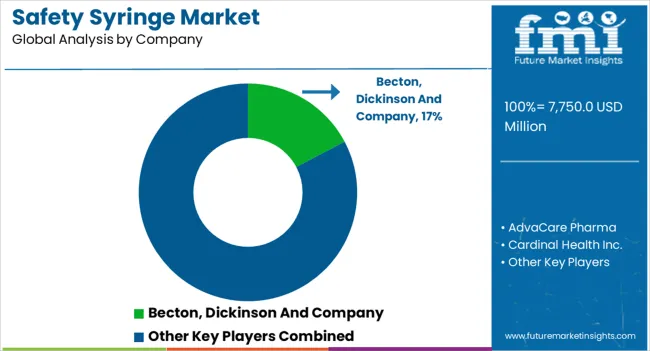
Competitive Landscape of the Safety Syringe Market

Leading companies are strategically making acquisitions and developing new products to strengthen their positions. Through acquisitions, businesses can expand their skills, penetrate new markets, and diversify their portfolios.

Ongoing product innovations ensure both innovation and competitiveness at the same time. The dynamic market for safety syringes is promoting growth and sustainability through the ability of key players to meet consumer expectations, adjust to evolving industry trends, and maintain a competitive edge through strategic actions.

For instance,

  • In November 2023, Terumo Corporation expanded its portfolio of syringes by launching insulin syringes for patients who require regular insulin injections.
  • In September 2023, Sharps Technology acquired InjectEZ specialty copolymer syringe manufacturing facility to strengthen the company's manufacturing capacity and expand its position in the syringe industry.
  • In May 2022, Babson Diagnostics and BD (Becton, Dickinson, and Company) announced a strategic partnership to integrate blood. They also announced the expansion of sample collection in new medical facilities.

Scope and Coverage of the Safety Syringe Market Report

Attribute Details
Estimated Market Size (2024) USD 7,736.2 million
Forecast Market Size (2034) USD 12,054.3 million
Projected Growth Rate (2024 to 2034) 4.5%
Forecast Period 2024 to 2034
Historical Data Available for 2019 to 2023
Market Analysis USD million for Value
Key Regions Covered North America; Latin America; South Asia and Pacific; East Asia; Western Europe; Eastern Europe; Middle East and Africa
Key Countries Covered United States, Canada, Mexico, Brazil, Chile, the Rest of Latin America, China, Japan, South Korea, India, the Association of Southeast Asian Nations, Australia and New Zealand, the Rest of South Asia and Pacific, Germany, Italy, France, United Kingdom, Spain BENELUX, Nordic Countries, Rest of Western Europe, Russia, Hungary, Poland, Rest of Eastern Europe, Saudi Arabia, Türkiye, South Africa, Other African Union, Rest of Middle East and Africa
Key Segments Covered Product, Application, Distribution Channel, End-user, and Region
Key Companies Profiled Becton; Dickinson and Company; AdvaCare Pharma; Cardinal Health Inc.; DMC Medical Ltd.; Duopross Meditech Corp.; Haiou Medical; Kendall Healthcare; Lifelong Meditech (Group); Medicina (HMC Group); Medline Industries; Nipro Corporation; Numedico; Nemera; Retractable Technologies, Inc.; Revolutions Medical Corporation; Smith’s Medical, Inc. (ICU Medical, Inc.); Sol-Millennium Medical Group; Terumo Corporation; UltiMed, Inc. (Ulticare); Unilife Corporation; B. Braun Melsungen AG; Fresenius Kabi AG; West Pharmaceutical Services, Inc.
Report Coverage Market Forecast, Competition Intelligence, Drivers, Restraints, Opportunities, Trends, Market Dynamics and Challenges, Strategic Growth Initiatives

Top Segments Studied in the Safety Syringe Market Report

By Product:

  • Retractable
    • Manual Retractable Safety Syringes
    • Automatic Retractable Safety Syringes
  • Non-retractable
    • Sliding Needle Cover Syringes
    • Sheathing Tube Syringes
    • Hinged Needle Cover Syringes

By Application:

  • Subcutaneous
  • Intramuscular

By Distribution Channel:

  • Direct to Customer (DTC)
  • Retail Sales
    • Retail Pharmacies
    • Drug Stores
  • Online Pharmacies

By End-user:

  • Hospitals
  • Ambulatory Surgical Centers
  • Long-term Care Facilities
  • Specialty Clinics
  • Others

By Region:

  • North America
  • Latin America
  • East Asia
  • South Asia and Pacific
  • Western Europe
  • Eastern Europe
  • Middle East and Africa

Table of Content

  • 1. Executive Summary
  • 2. Market Overview
  • 3. Key Market Trends
  • 4. Value Added Insights
  • 5. Market Background
  • 6. Global Market Demand Volume (Units) Analysis 2019 to 2023 and Forecast, 2024 to 2034
  • 7. Global Market Demand Pricing Analysis 2019 to 2023 and Forecast, 2024 to 2034
  • 8. Global Market Demand (in Value or Size in USD million) Analysis 2019 to 2023 and Forecast, 2024 to 2034
  • 9. Global Market Analysis 2019 to 2023 and Forecast 2024 to 2034, By Product
    • 9.1. Retractable
      • 9.1.1. Manual Retractable Safety Syringes
      • 9.1.2. Automatic Retractable Safety Syringes
    • 9.2. Non-retractable
      • 9.2.1. Sliding Needle Cover Syringes
      • 9.2.2. Sheathing Tube Syringes
      • 9.2.3. Hinged Needle Cover Syringes
  • 10. Global Market Analysis 2019 to 2023 and Forecast 2024 to 2034, By Application
    • 10.1. Subcutaneous
    • 10.2. Intramuscular
  • 11. Global Market Analysis 2019 to 2023 and Forecast 2024 to 2034, By Distribution Channel
    • 11.1. Direct to Customer (DTC)
    • 11.2. Retail Sales
      • 11.2.1. Retail Pharmacies
      • 11.2.2. Drug Stores
    • 11.3. Online Pharmacies
  • 12. Global Market Analysis 2019 to 2023 and Forecast 2024 to 2034, By End User
    • 12.1. Hospitals
    • 12.2. Ambulatory Surgical Centers
    • 12.3. Long-term Care Facilities
    • 12.4. Specialty Clinics
    • 12.5. Others
  • 13. Global Market Analysis 2019 to 2023 and Forecast 2024 to 2034, By Region
    • 13.1. North America
    • 13.2. Latin America
    • 13.3. East Asia
    • 13.4. South Asia and Pacific
    • 13.5. Western Europe
    • 13.6. Eastern Europe
    • 13.7. Middle East and Africa
  • 14. North America Market Analysis 2019 to 2023 and Forecast 2024 to 2034
  • 15. Latin America Market Analysis 2019 to 2023 and Forecast 2024 to 2034
  • 16. East Asia Market Analysis 2019 to 2023 and Forecast 2024 to 2034
  • 17. South Asia and Pacific Market Analysis 2019 to 2023 and Forecast 2024 to 2034
  • 18. Western Europe Market 2019 to 2023 and Forecast 2024 to 2034
  • 19. Eastern Europe Market Analysis 2019 to 2023 and Forecast 2024 to 2034
  • 20. Middle East and Africa Market Analysis 2019 to 2023 and Forecast 2024 to 2034
  • 21. Market Structure Analysis
  • 22. Competition Analysis
    • 22.1. Becton, Dickinson and Company
    • 22.2. AdvaCare Pharma
    • 22.3. Cardinal Health Inc.
    • 22.4. DMC Medical Ltd.
    • 22.5. Duopross Meditech Corp.
    • 22.6. Haiou Medical
    • 22.7. Kendall Healthcare
    • 22.8. Lifelong Meditech (Group)
    • 22.9. Medicina (HMC Group)
    • 22.10. Medline Industries
    • 22.11. Nipro Corporation
    • 22.12. Numedico
    • 22.13. Nemera
    • 22.14. Retractable Technologies, Inc.
    • 22.15. Revolutions Medical Corporation
    • 22.16. Smiths Medical, Inc. (ICU Medical, Inc.)
    • 22.17. Sol-Millennium Medical Group
    • 22.18. Terumo Corporation
    • 22.19. UltiMed, Inc. (Ulticare)
    • 22.20. Unilife Corporation
    • 22.21. B. Braun Melsungen AG
    • 22.22. Fresenius Kabi AG
    • 22.23. West Pharmaceutical Services, Inc.
  • 23. Assumptions and Acronyms Used
  • 24. Research Methodology

List of Tables

Table 1: Global Market Value (US$ million) Analysis 2019 to 2023 and Forecast 2024 to 2034, By Product

Table 2: Global Volume (Units) Analysis 2019 to 2023 and Forecast 2024 to 2034, By Product

Table 3: Global Market Value (US$ million) Analysis 2019 to 2023 and Forecast 2024 to 2034, By Application

Table 4: Global Market Value (US$ million) Analysis 2019 to 2023 and Forecast 2024 to 2034, By Distribution Channel

Table 5: Global Market Value (US$ million) Analysis 2019 to 2023 and Forecast 2024 to 2034, By End User

Table 6: Global Market Size (US$ million) Analysis 2019 to 2023 and Forecast 2024 to 2034, By Region

Table 7: North America Market Value (US$ million) Analysis 2019 to 2023 and Forecast 2024 to 2034, By Country

Table 8: North America Market Value (US$ million) Analysis 2019 to 2023 and Forecast 2024 to 2034, By Product

Table 9: North America Safety Syringes Volume (Units) Analysis 2019 to 2023 and Forecast 2024 to 2034, By Product

Table 10: North America Market Value (US$ million) Analysis 2019 to 2023 and Forecast 2024 to 2034, By Application

Table 11: North America Market Value (US$ million) Analysis 2019 to 2023 and Forecast 2024 to 2034, By Distribution Channel

Table 12: North America Market Value (US$ million) Analysis 2019 to 2023 and Forecast 2024 to 2034, By End User

Table 13: United States Market Value (US$ million) Analysis 2019 to 2023 and Forecast 2024 to 2034, By Product

Table 14: United States Market Value (US$ million) Analysis 2019 to 2023 and Forecast 2024 to 2034, By Application

Table 15: United States Market Value (US$ million) Analysis 2019 to 2023 and Forecast 2024 to 2034, By Distribution Channel

Table 16: United States Market Value (US$ million) Analysis 2019 to 2023 and Forecast 2024 to 2034, By End User

Table 17: Canada Market Value (US$ million) Analysis 2019 to 2023 and Forecast 2024 to 2034, By Product

Table 18: Canada Market Value (US$ million) Analysis 2019 to 2023 and Forecast 2024 to 2034, By Application

Table 19: Canada Market Value (US$ million) Analysis 2019 to 2023 and Forecast 2024 to 2034, By Distribution Channel

Table 20: Canada Market Value (US$ million) Analysis 2019 to 2023 and Forecast 2024 to 2034, By End User

Table 21: Mexico Market Value (US$ million) Analysis 2019 to 2023 and Forecast 2024 to 2034, By Product

Table 22: Mexico Market Value (US$ million) Analysis 2019 to 2023 and Forecast 2024 to 2034, By Application

Table 23: Mexico Market Value (US$ million) Analysis 2019 to 2023 and Forecast 2024 to 2034, By Distribution Channel

Table 24: Mexico Market Value (US$ million) Analysis 2019 to 2023 and Forecast 2024 to 2034, By End User

Table 25: Latin America Market Value (US$ million) Analysis 2019 to 2023 and Forecast 2024 to 2034, By Country

Table 26: Latin America Market Value (US$ million) Analysis 2019 to 2023 and Forecast 2024 to 2034, By Product

Table 27: Latin America Safety Syringes Volume (Units) Analysis 2019 to 2023 and Forecast 2024 to 2034, By Product

Table 28: Latin America Market Value (US$ million) Analysis 2019 to 2023 and Forecast 2024 to 2034, By Application

Table 29: Latin America Market Value (US$ million) Analysis 2019 to 2023 and Forecast 2024 to 2034, By Distribution Channel

Table 30: Latin America Market Value (US$ million) Analysis 2019 to 2023 and Forecast 2024 to 2034, By End User

Table 31: Brazil Market Value (US$ million) Analysis 2019 to 2023 and Forecast 2024 to 2034, By Product

Table 32: Brazil Market Value (US$ million) Analysis 2019 to 2023 and Forecast 2024 to 2034, By Application

Table 33: Brazil Market Value (US$ million) Analysis 2019 to 2023 and Forecast 2024 to 2034, By Distribution Channel

Table 34: Brazil Market Value (US$ million) Analysis 2019 to 2023 and Forecast 2024 to 2034, By End User

Table 35: Chile Market Value (US$ million) Analysis 2019 to 2023 and Forecast 2024 to 2034, By Product

Table 36: Chile Market Value (US$ million) Analysis 2019 to 2023 and Forecast 2024 to 2034, By Application

Table 37: Chile Market Value (US$ million) Analysis 2019 to 2023 and Forecast 2024 to 2034, By Distribution Channel

Table 38: Chile Market Value (US$ million) Analysis 2019 to 2023 and Forecast 2024 to 2034, By End User

Table 39: East Asia Market Value (US$ million) Analysis 2019 to 2023 and Forecast 2024 to 2034, By Country

Table 40: East Asia Market Value (US$ million) Analysis 2019 to 2023 and Forecast 2024 to 2034, By Product

Table 41: East Asia Safety Syringes Volume (Units) Analysis 2019 to 2023 and Forecast 2024 to 2034, By Product

Table 42: East Asia Market Value (US$ million) Analysis 2019 to 2023 and Forecast 2024 to 2034, By Application

Table 43: East Asia Market Value (US$ million) Analysis 2019 to 2023 and Forecast 2024 to 2034, By Distribution Channel

Table 44: East Asia Market Value (US$ million) Analysis 2019 to 2023 and Forecast 2024 to 2034, By End User

Table 45: China Market Value (US$ million) Analysis 2019 to 2023 and Forecast 2024 to 2034, By Product

Table 46: China Market Value (US$ million) Analysis 2019 to 2023 and Forecast 2024 to 2034, By Application

Table 47: China Market Value (US$ million) Analysis 2019 to 2023 and Forecast 2024 to 2034, By Distribution Channel

Table 48: China Market Value (US$ million) Analysis 2019 to 2023 and Forecast 2024 to 2034, By End User

Table 49: Japan Market Value (US$ million) Analysis 2019 to 2023 and Forecast 2024 to 2034, By Product

Table 50: Japan Market Value (US$ million) Analysis 2019 to 2023 and Forecast 2024 to 2034, By Application

Table 51: Japan Market Value (US$ million) Analysis 2019 to 2023 and Forecast 2024 to 2034, By Distribution Channel

Table 52: Japan Market Value (US$ million) Analysis 2019 to 2023 and Forecast 2024 to 2034, By End User

Table 53: South Korea Market Value (US$ million) Analysis 2019 to 2023 and Forecast 2024 to 2034, By Product

Table 54: South Korea Market Value (US$ million) Analysis 2019 to 2023 and Forecast 2024 to 2034, By Application

Table 55: South Korea Market Value (US$ million) Analysis 2019 to 2023 and Forecast 2024 to 2034, By Distribution Channel

Table 56: South Korea Market Value (US$ million) Analysis 2019 to 2023 and Forecast 2024 to 2034, By End User

Table 57: South Asia and Pacific Market Value (US$ million) Analysis 2019 to 2023 and Forecast 2024 to 2034, By Country

Table 58: South Asia and Pacific Market Value (US$ million) Analysis 2019 to 2023 and Forecast 2024 to 2034, By Product

Table 59: South Asia and Pacific Safety Syringes Volume (Units) Analysis 2019 to 2023 and Forecast 2024 to 2034, By Product

Table 60: South Asia and Pacific Market Value (US$ million) Analysis 2019 to 2023 and Forecast 2024 to 2034, By Application

Table 61: South Asia and Pacific Market Value (US$ million) Analysis 2019 to 2023 and Forecast 2024 to 2034, By Distribution Channel

Table 62: South Asia and Pacific Market Value (US$ million) Analysis 2019 to 2023 and Forecast 2024 to 2034, By End User

Table 63: India Market Value (US$ million) Analysis 2019 to 2023 and Forecast 2024 to 2034, By Product

Table 64: India Market Value (US$ million) Analysis 2019 to 2023 and Forecast 2024 to 2034, By Application

Table 65: India Market Value (US$ million) Analysis 2019 to 2023 and Forecast 2024 to 2034, By Distribution Channel

Table 66: India Market Value (US$ million) Analysis 2019 to 2023 and Forecast 2024 to 2034, By End User

Table 67: ASEAN Countries Market Value (US$ million) Analysis 2019 to 2023 and Forecast 2024 to 2034, By Product

Table 68: ASEAN Countries Market Value (US$ million) Analysis 2019 to 2023 and Forecast 2024 to 2034, By Application

Table 69: ASEAN Countries Market Value (US$ million) Analysis 2019 to 2023 and Forecast 2024 to 2034, By Distribution Channel

Table 70: ASEAN Countries Market Value (US$ million) Analysis 2019 to 2023 and Forecast 2024 to 2034, By End User

Table 71: Australia and New Zealand Market Value (US$ million) Analysis 2019 to 2023 and Forecast 2024 to 2034, By Product

Table 72: Australia and New Zealand Market Value (US$ million) Analysis 2019 to 2023 and Forecast 2024 to 2034, By Application

Table 73: Australia and New Zealand Market Value (US$ million) Analysis 2019 to 2023 and Forecast 2024 to 2034, By Distribution Channel

Table 74: Australia and New Zealand Market Value (US$ million) Analysis 2019 to 2023 and Forecast 2024 to 2034, By End User

Table 75: Western Europe Market Value (US$ million) Analysis 2019 to 2023 and Forecast 2024 to 2034, By Country

Table 76: Western Europe Market Value (US$ million) Analysis 2019 to 2023 and Forecast 2024 to 2034, By Product

Table 77: Western Europe Volume (Units) Analysis 2019 to 2023 and Forecast 2024 to 2034, By Product

Table 78: Western Europe Market Value (US$ million) Analysis 2019 to 2023 and Forecast 2024 to 2034, By Application

Table 79: Western Europe Market Value (US$ million) Analysis 2019 to 2023 and Forecast 2024 to 2034, By Distribution Channel

Table 80: Western Europe Market Value (US$ million) Analysis 2019 to 2023 and Forecast 2024 to 2034, By End User

Table 81: Germany Market Value (US$ million) Analysis 2019 to 2023 and Forecast 2024 to 2034, By Product

Table 82: Germany Market Value (US$ million) Analysis 2019 to 2023 and Forecast 2024 to 2034, By Application

Table 83: Germany Market Value (US$ million) Analysis 2019 to 2023 and Forecast 2024 to 2034, By Distribution Channel

Table 84: Germany Market Value (US$ million) Analysis 2019 to 2023 and Forecast 2024 to 2034, By End User

Table 85: Italy Market Value (US$ million) Analysis 2019 to 2023 and Forecast 2024 to 2034, By Product

Table 86: Italy Market Value (US$ million) Analysis 2019 to 2023 and Forecast 2024 to 2034, By Application

Table 87: Italy Market Value (US$ million) Analysis 2019 to 2023 and Forecast 2024 to 2034, By Distribution Channel

Table 88: Italy Market Value (US$ million) Analysis 2019 to 2023 and Forecast 2024 to 2034, By End User

Table 89: France Market Value (US$ million) Analysis 2019 to 2023 and Forecast 2024 to 2034, By Product

Table 90: France Market Value (US$ million) Analysis 2019 to 2023 and Forecast 2024 to 2034, By Application

Table 91: France Market Value (US$ million) Analysis 2019 to 2023 and Forecast 2024 to 2034, By Distribution Channel

Table 92: France Market Value (US$ million) Analysis 2019 to 2023 and Forecast 2024 to 2034, By End User

Table 93: United Kingdom Market Value (US$ million) Analysis 2019 to 2023 and Forecast 2024 to 2034, By Product

Table 94: United Kingdom Market Value (US$ million) Analysis 2019 to 2023 and Forecast 2024 to 2034, By Application

Table 95: United Kingdom Market Value (US$ million) Analysis 2019 to 2023 and Forecast 2024 to 2034, By Distribution Channel

Table 96: United Kingdom Market Value (US$ million) Analysis 2019 to 2023 and Forecast 2024 to 2034, By End User

Table 97: Spain Market Value (US$ million) Analysis 2019 to 2023 and Forecast 2024 to 2034, By Product

Table 98: Spain Market Value (US$ million) Analysis 2019 to 2023 and Forecast 2024 to 2034, By Application

Table 99: Spain Market Value (US$ million) Analysis 2019 to 2023 and Forecast 2024 to 2034, By Distribution Channel

Table 100: Spain Market Value (US$ million) Analysis 2019 to 2023 and Forecast 2024 to 2034, By End User

Table 101: BENELUX Market Value (US$ million) Analysis 2019 to 2023 and Forecast 2024 to 2034, By Product

Table 102: BENELUX Market Value (US$ million) Analysis 2019 to 2023 and Forecast 2024 to 2034, By Application

Table 103: BENELUX Market Value (US$ million) Analysis 2019 to 2023 and Forecast 2024 to 2034, By Distribution Channel

Table 104: BENELUX Market Value (US$ million) Analysis 2019 to 2023 and Forecast 2024 to 2034, By End User

Table 105: Nordic Countries Market Value (US$ million) Analysis 2019 to 2023 and Forecast 2024 to 2034, By Product

Table 106: Nordic Countries Market Value (US$ million) Analysis 2019 to 2023 and Forecast 2024 to 2034, By Application

Table 107: Nordic Countries Market Value (US$ million) Analysis 2019 to 2023 and Forecast 2024 to 2034, By Distribution Channel

Table 108: Nordic Countries Market Value (US$ million) Analysis 2019 to 2023 and Forecast 2024 to 2034, By End User

Table 109: Eastern Europe Market Value (US$ million) Analysis 2019 to 2023 and Forecast 2024 to 2034, By Country

Table 110: Eastern Europe Market Value (US$ million) Analysis 2019 to 2023 and Forecast 2024 to 2034, By Product

Table 111: Eastern Europe Volume (Units) Analysis 2019 to 2023 and Forecast 2024 to 2034, By Product

Table 112: Eastern Europe Market Value (US$ million) Analysis 2019 to 2023 and Forecast 2024 to 2034, By Application

Table 113: Eastern Europe Market Value (US$ million) Analysis 2019 to 2023 and Forecast 2024 to 2034, By Distribution Channel

Table 114: Eastern Europe Market Value (US$ million) Analysis 2019 to 2023 and Forecast 2024 to 2034, By End User

Table 115: Russia Market Value (US$ million) Analysis 2019 to 2023 and Forecast 2024 to 2034, By Product

Table 116: Russia Market Value (US$ million) Analysis 2019 to 2023 and Forecast 2024 to 2034, By Application

Table 117: Russia Market Value (US$ million) Analysis 2019 to 2023 and Forecast 2024 to 2034, By Distribution Channel

Table 118: Russia Market Value (US$ million) Analysis 2019 to 2023 and Forecast 2024 to 2034, By End User

Table 119: Hungary Market Value (US$ million) Analysis 2019 to 2023 and Forecast 2024 to 2034, By Product

Table 120: Hungary Market Value (US$ million) Analysis 2019 to 2023 and Forecast 2024 to 2034, By Application

Table 121: Hungary Market Value (US$ million) Analysis 2019 to 2023 and Forecast 2024 to 2034, By Distribution Channel

Table 122: Hungary Market Value (US$ million) Analysis 2019 to 2023 and Forecast 2024 to 2034, By End User

Table 123: Poland Market Value (US$ million) Analysis 2019 to 2023 and Forecast 2024 to 2034, By Product

Table 124: Poland Market Value (US$ million) Analysis 2019 to 2023 and Forecast 2024 to 2034, By Application

Table 125: Poland Market Value (US$ million) Analysis 2019 to 2023 and Forecast 2024 to 2034, By Distribution Channel

Table 126: Poland Market Value (US$ million) Analysis 2019 to 2023 and Forecast 2024 to 2034, By End User

Table 127: Middle East and Africa Market Value (US$ million) Analysis 2019 to 2023 and Forecast 2024 to 2034, By Country

Table 128: Middle East and Africa Market Value (US$ million) Analysis 2019 to 2023 and Forecast 2024 to 2034, By Product

Table 129: Middle East and Africa Safety Syringes Volume (Units) Analysis 2019 to 2023 and Forecast 2024 to 2034, By Product

Table 130: Middle East and Africa Market Value (US$ million) Analysis 2019 to 2023 and Forecast 2024 to 2034, By Application

Table 131: Middle East and Africa Market Value (US$ million) Analysis 2019 to 2023 and Forecast 2024 to 2034, By Distribution Channel

Table 132: Middle East and Africa Market Value (US$ million) Analysis 2019 to 2023 and Forecast 2024 to 2034, By End User

Table 133: Saudi Arabia Market Value (US$ million) Analysis 2019 to 2023 and Forecast 2024 to 2034, By Product

Table 134: Saudi Arabia Market Value (US$ million) Analysis 2019 to 2023 and Forecast 2024 to 2034, By Application

Table 135: Saudi Arabia Market Value (US$ million) Analysis 2019 to 2023 and Forecast 2024 to 2034, By Distribution Channel

Table 136: Saudi Arabia Market Value (US$ million) Analysis 2019 to 2023 and Forecast 2024 to 2034, By End User

Table 137: Türkiye Market Value (US$ million) Analysis 2019 to 2023 and Forecast 2024 to 2034, By Product

Table 138: Türkiye Market Value (US$ million) Analysis 2019 to 2023 and Forecast 2024 to 2034, By Application

Table 139: Türkiye Market Value (US$ million) Analysis 2019 to 2023 and Forecast 2024 to 2034, By Distribution Channel

Table 140: Türkiye Market Value (US$ million) Analysis 2019 to 2023 and Forecast 2024 to 2034, By End User

Table 141: South Africa Market Value (US$ million) Analysis 2019 to 2023 and Forecast 2024 to 2034, By Product

Table 142: South Africa Market Value (US$ million) Analysis 2019 to 2023 and Forecast 2024 to 2034, By Application

Table 143: South Africa Market Value (US$ million) Analysis 2019 to 2023 and Forecast 2024 to 2034, By Distribution Channel

Table 144: South Africa Market Value (US$ million) Analysis 2019 to 2023 and Forecast 2024 to 2034, By End User

Table 145: Other African Union Market Value (US$ million) Analysis 2019 to 2023 and Forecast 2024 to 2034, By Product

Table 146: Other African Union Market Value (US$ million) Analysis 2019 to 2023 and Forecast 2024 to 2034, By Application

Table 147: Other African Union Market Value (US$ million) Analysis 2019 to 2023 and Forecast 2024 to 2034, By Distribution Channel

Table 148: Other African Union Market Value (US$ million) Analysis 2019 to 2023 and Forecast 2024 to 2034, By End User

List of Figures

Figure 1: Global Market Value Share By Product 2023 (A)

Figure 2: Global Market Value Share By Application 2023 (A)

Figure 3: Global Market Value Share By Distribution Channel 2023 (A)

Figure 4: Global Market Value Share By End User 2023 (A)

Figure 5: Global Market Value Share By Country 2023 (A)

Figure 6: Global Market Volume Analysis in (000’ Units), 2019 to 2023

Figure 7: Global Market Volume Forecast in (000’ Units), 2024 to 2034

Figure 8: Retractable Pricing Analysis (US$) for Per Unit, By Region, 2023

Figure 9: Non Retractable Pricing Analysis (US$) for Per Unit, By Region, 2023

Figure 10: Global Market Value Analysis (US$ million), 2019 to 2023

Figure 11: Global Market Value Forecast (US$ million), 2024 to 2034

Figure 12: Global Market Absolute $ Opportunity, 2024 to 2034

Figure 13: Global Market Share Analysis (%), By Product type, 2024 (E) to 2034 (F)

Figure 14: Global Market Y-o-Y Analysis (%), By Product type, 2024 to 2034

Figure 15: Global Market Attractiveness Analysis, By Product Type

Figure 16: Global Market Share Analysis (%), By Application , 2024 (E) to 2034 (F)

Figure 17: Global Market Y-o-Y Analysis (%), By Application, 2024 to 2034

Figure 18: Global Market Attractiveness Analysis, By Application

Figure 19: Global Market Share Analysis (%), By Distribution Channel, 2024 (E) to 2034 (F)

Figure 20: Global Market Y-o-Y Analysis (%), By Distribution Channel, 2024 to 2034

Figure 21: Global Market Attractiveness Analysis, By Distribution Channel

Figure 22: Global Market Share Analysis (%), By End User, 2024 (E) to 2034 (F)

Figure 23: Global Market Y-o-Y Analysis (%), By End User, 2024 to 2034

Figure 24: Global Market Attractiveness Analysis, By End User

Figure 25: Global Market Share Analysis (%), By Region, 2024 (E) to 2034 (F)

Figure 26: Global Market Y-o-Y Analysis (%), By Region, 2024 to 2034

Figure 27: Global Market Attractiveness Analysis By Region, 2024 to 2034

Figure 28: North America Market Value Share By Product 2023 (A)

Figure 29: North America Market Value Share By Application 2023 (A)

Figure 30: North America Market Value Share By Distribution Channel 2023 (A)

Figure 31: North America Market Value Share By End User 2023 (A)

Figure 32: North America Market Value Share By Country 2023 (A)

Figure 33: North America Market Value (US$ million) Analysis, 2019 to 2023

Figure 34: North America Market Forecast and Y-o-Y growth, 2024 to 2034

Figure 35: North America Market Attractiveness Analysis By Product, 2024 to 2034

Figure 36: North America Market Attractiveness Analysis By Application, 2024 to 2034

Figure 37: North America Market Attractiveness Analysis By Distribution Channel, 2024 to 2034

Figure 38: North America Market Attractiveness Analysis By End User, 2024 to 2034

Figure 39: North America Market Attractiveness Analysis By Country, 2024 to 2034

Figure 40: Latin America Market Value Share By Product 2023 (A)

Figure 41: Latin America Market Value Share By Application 2023 (A)

Figure 42: Latin America Market Value Share By Distribution Channel 2023 (A)

Figure 43: Latin America Market Value Share By End User 2023 (A)

Figure 44: Latin America Market Value Share By Country 2023 (A)

Figure 45: Latin America Market Value (US$ million) Analysis, 2019 to 2023

Figure 46: Latin America Market Forecast and Y-o-Y growth, 2024 to 2034

Figure 47: Latin America Market Attractiveness Analysis By Product, 2024 to 2034

Figure 48: Latin America Market Attractiveness Analysis By Application, 2024 to 2034

Figure 49: Latin America Market Attractiveness Analysis By Distribution Channel, 2024 to 2034

Figure 50: Latin America Market Attractiveness Analysis By End User, 2024 to 2034

Figure 51: Latin America Market Attractiveness Analysis By Country, 2024 to 2034

Figure 52: East Asia Market Value Share By Product 2023 (A)

Figure 53: East Asia Market Value Share By Application 2023 (A)

Figure 54: East Asia Market Value Share By Distribution Channel 2023 (A)

Figure 55: East Asia Market Value Share By End User 2023 (A)

Figure 56: East Asia Market Value Share By Country 2023 (A)

Figure 57: East Asia Market Value (US$ million) Analysis, 2019 to 2023

Figure 58: East Asia Market Forecast and Y-o-Y growth, 2024 to 2034

Figure 59: East Asia Market Attractiveness Analysis By Product, 2024 to 2034

Figure 60: East Asia Market Attractiveness Analysis By Application, 2024 to 2034

Figure 61: East Asia Market Attractiveness Analysis By Distribution Channel, 2024 to 2034

Figure 62: East Asia Market Attractiveness Analysis By End User, 2024 to 2034

Figure 63: East Asia Market Attractiveness Analysis By Country, 2024 to 2034

Figure 64: South Asia and Pacific Market Value Share By Product 2023 (A)

Figure 65: South Asia and Pacific Market Value Share By Application 2023 (A)

Figure 66: South Asia and Pacific Market Value Share By Distribution Channel 2023 (A)

Figure 67: South Asia and Pacific Market Value Share By End User 2023 (A)

Figure 68: South Asia and Pacific Market Value Share By Country 2023 (A)

Figure 69: South Asia and Pacific Market Value (US$ million) Analysis, 2019 to 2023

Figure 70: South Asia and Pacific Market Forecast and Y-o-Y growth, 2024 to 2034

Figure 71: South Asia and Pacific Market Attractiveness Analysis By Product, 2024 to 2034

Figure 72: South Asia and Pacific Market Attractiveness Analysis By Application, 2024 to 2034

Figure 73: South Asia and Pacific Market Attractiveness Analysis By Distribution Channel, 2024 to 2034

Figure 74: South Asia and Pacific Market Attractiveness Analysis By End User, 2024 to 2034

Figure 75: South Asia and Pacific Market Attractiveness Analysis By Country, 2024 to 2034

Figure 76: Western Europe Market Value Share By Product 2023 (A)

Figure 77: Western Europe Market Value Share By Application 2023 (A)

Figure 78: Western Europe Market Value Share By Distribution Channel 2023 (A)

Figure 79: Western Europe Market Value Share By End User 2023 (A)

Figure 80: Western Europe Market Value Share By Country 2023 (A)

Figure 81: Western Europe Market Value (US$ million) Analysis, 2019 to 2023

Figure 82: Western Europe Market Forecast and Y-o-Y growth, 2024 to 2034

Figure 83: Western Europe Market Attractiveness Analysis By Product, 2024 to 2034

Figure 84: Western Europe Market Attractiveness Analysis By Application, 2024 to 2034

Figure 85: Western Europe Market Attractiveness Analysis By Distribution Channel, 2024 to 2034

Figure 86: Western Europe Market Attractiveness Analysis By End User, 2024 to 2034

Figure 87: Western Europe Market Attractiveness Analysis By Country, 2024 to 2034

Figure 88: Eastern Europe Market Value Share By Product 2023 (A)

Figure 89: Eastern Europe Market Value Share By Application 2023 (A)

Figure 90: Eastern Europe Market Value Share By Distribution Channel 2023 (A)

Figure 91: Eastern Europe Market Value Share By End User 2023 (A)

Figure 92: Eastern Europe Market Value Share By Country 2023 (A)

Figure 93: Eastern Europe Market Value (US$ million) Analysis, 2019 to 2023

Figure 94: Eastern Europe Market Forecast and Y-o-Y growth, 2024 to 2034

Figure 95: Eastern Europe Market Attractiveness Analysis By Product, 2024 to 2034

Figure 96: Eastern Europe Market Attractiveness Analysis By Application, 2024 to 2034

Figure 97: Eastern Europe Market Attractiveness Analysis By Distribution Channel, 2024 to 2034

Figure 98: Eastern Europe Market Attractiveness Analysis By End User, 2024 to 2034

Figure 99: Eastern Europe Market Attractiveness Analysis By Country, 2024 to 2034

Figure 100: Middle East and Africa Market Value Share By Product 2023 (A)

Figure 101: Middle East and Africa Market Value Share By Application 2023 (A)

Figure 102: Middle East and Africa Market Value Share By Distribution Channel 2023 (A)

Figure 103: Middle East and Africa Market Value Share By End User 2023 (A)

Figure 104: Middle East and Africa Market Value Share By Country 2023 (A)

Figure 105: Middle East and Africa Market Value (US$ million) Analysis, 2019 to 2023

Figure 106: Middle East and Africa Market Forecast and Y-o-Y growth, 2024 to 2034

Figure 107: Middle East and Africa Market Attractiveness Analysis By Product, 2024 to 2034

Figure 108: Middle East and Africa Market Attractiveness Analysis By Application, 2024 to 2034

Figure 109: Middle East and Africa Market Attractiveness Analysis By Distribution Channel, 2024 to 2034

Figure 110: Middle East and Africa Market Attractiveness Analysis By End User, 2024 to 2034

Figure 111: Middle East and Africa Market Attractiveness Analysis By Country, 2024 to 2034

Frequently Asked Questions

How big was the global market in 2023?

The market was worth USD 7,416.3 million in 2023.

What is the sales forecast for the global market through 2034?

The market is expected to reach USD 12,054.3 million in 2034.

What was the last six year’s growth rate for the safety syringe market?

The global market grew at a CAGR of 4.3% between 2019 and 2023.

What is the United States' outlook for the safety syringe market?

The United States contributed USD 2,393.3 million in 2022.

What is the outlook for the India market?

India is expected to surge at a CAGR of 10.5% by 2034.

Which product segment held the prominent share in 2023?

The retractable segment held a prominent share of 68.2% in 2023.

Explore Similar Insights

Future Market Insights

Safety Syringe Market