The Safety Needles Market is estimated to be valued at USD 6.7 billion in 2025 and is projected to reach USD 13.3 billion by 2035, registering a compound annual growth rate (CAGR) of 7.0% over the forecast period.
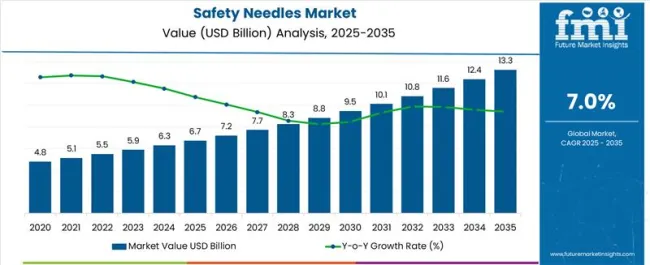
| Metric | Value |
|---|---|
| Safety Needles Market Estimated Value in (2025 E) | USD 6.7 billion |
| Safety Needles Market Forecast Value in (2035 F) | USD 13.3 billion |
| Forecast CAGR (2025 to 2035) | 7.0% |
The safety needles market is expanding steadily, supported by the global emphasis on patient safety, occupational hazard reduction, and compliance with needlestick injury prevention regulations. Clinical journals and healthcare safety reports have highlighted the growing demand for advanced needle systems that reduce the risk of accidental exposure to bloodborne pathogens. Pharmaceutical company disclosures and government health directives have further reinforced the adoption of safety needles across hospitals, clinics, and ambulatory care centers.
Rising vaccination campaigns, the growing prevalence of chronic diseases requiring long-term injectable therapies, and the expansion of drug delivery pipelines have strengthened demand. Additionally, manufacturing innovations in retractable and shielded needle designs have enhanced usability while aligning with cost-efficiency goals in healthcare systems.
Looking forward, the market is expected to benefit from stricter regulatory enforcement, broader distribution partnerships, and increased awareness of healthcare worker safety. Segmental growth is being led by fine aspiring needles, drug delivery applications, and hospital pharmacies, reflecting both clinical utility and institutional purchasing power.
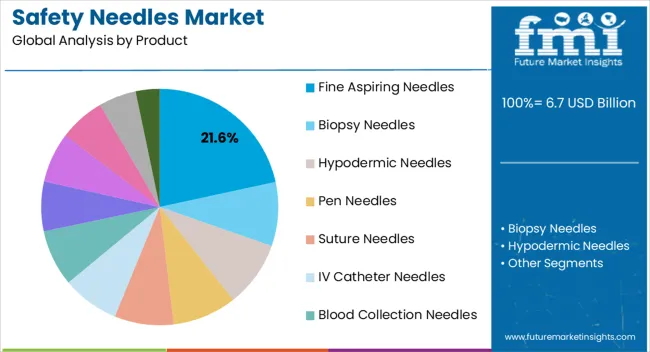
The Fine Aspiring Needles segment is projected to account for 21.60% of the safety needles market revenue in 2025, making it a significant contributor within the product category. This segment’s growth has been driven by the clinical need for precise sample collection and fluid aspiration in diagnostic and therapeutic procedures.
Healthcare professionals have increasingly adopted fine aspiring safety needles due to their reduced risk of tissue trauma and enhanced control during aspiration. Medical device manufacturers have emphasized innovations in needle gauge and safety mechanisms, which have improved patient comfort while ensuring healthcare worker protection.
Furthermore, rising diagnostic testing volumes and the expansion of minimally invasive procedures have reinforced demand for fine aspiring safety needles. Their integration into routine hospital and laboratory workflows has secured their market presence, positioning the segment as a stable revenue driver.
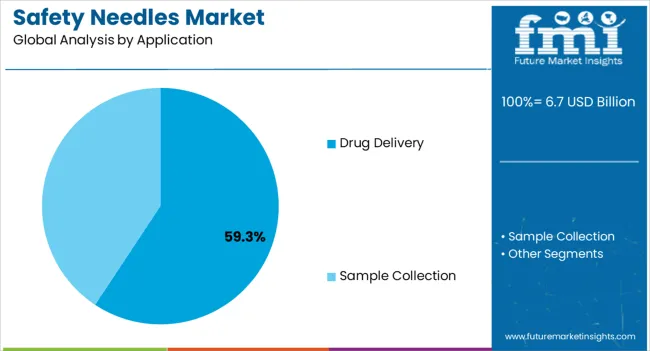
The Drug Delivery segment is expected to dominate with a 59.30% revenue share of the safety needles market in 2025, reflecting its central role in therapeutic administration. Growth of this segment has been attributed to the rising prevalence of chronic diseases, such as diabetes and autoimmune disorders, that require frequent injections.
Pharmaceutical industry updates and hospital reports have highlighted the increasing preference for safety-engineered needles in injectable drug delivery, as they minimize risks of accidental injuries and ensure compliance with safety standards. Additionally, the expansion of vaccination programs and injectable biologics pipelines has driven higher volumes of drug delivery procedures utilizing safety needles.
Healthcare providers have prioritized patient safety and staff protection, leading to widespread integration of safety needles in drug delivery protocols. With ongoing innovation in self-administration devices and prefilled syringes, the Drug Delivery segment is expected to maintain its leading position.
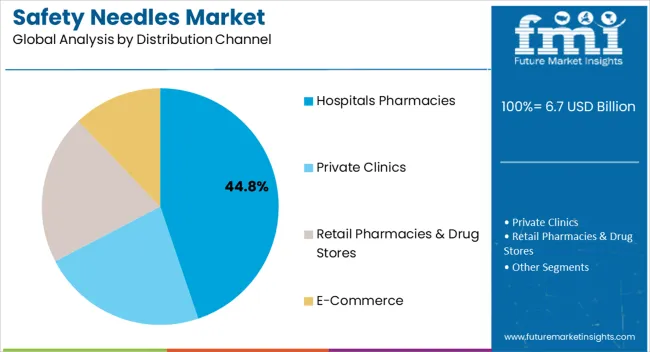
The Hospitals Pharmacies segment is projected to account for 44.80% of the safety needles market revenue in 2025, establishing itself as the leading distribution channel. This dominance has been supported by large-volume procurement capabilities of hospitals, which ensure consistent supply for inpatient and outpatient care.
Hospital pharmacies have played a key role in standardizing the use of safety needles across departments, aligning with institutional safety mandates and infection control protocols. Industry reports and procurement updates have indicated that centralized purchasing through hospital pharmacies reduces costs and streamlines inventory management, supporting efficiency in supply chains.
Additionally, hospitals remain primary centers for chronic disease treatment, vaccination, and surgical interventions, which together drive higher demand for safety needles. As healthcare institutions continue to prioritize occupational safety and patient protection, hospital pharmacies are expected to remain the leading distribution channel in the safety needles market.
Regulatory Emphasis on Needlestick Injury Prevention: Needlestick injuries are among the top causes of workplace injury in the healthcare industry. Several countries have utilized laws to encourage the application of safety-engineered needles. It is an essential approach to lowering the incidence of needlestick injuries among medical professionals. This has propelled the demand for safety needles. The focus on needlestick prevention techniques has been a driving force in the adoption of safety-engineered devices.
Heightened Awareness of Bloodborne Pathogens: Sharp injuries and other sharps-related injuries can expose employees to bloodborne infections. First responders, cleaning employees in various sectors, nurses, and other healthcare personnel are also in danger of being exposed to bloodborne diseases. However, nowadays, these healthcare professionals are becoming increasingly aware of bloodborne pathogens and the potential risks associated with needlestick injuries. This has spurred healthcare facilities to invest in safety needle technologies. This has led to a surge in sales of special purpose needles.
Rising Incidence of Chronic Diseases: Chronic diseases/non-communicable diseases Tobacco use, lack of physical activity, bad dietary habits, and overindulgence in alcohol are all key factors in the top chronic illnesses. Regardless of general wellness development, WHO stated that if current trends persist, chronic diseases such as cardiovascular disease, cancer, diabetes, and respiratory disorders are going to be responsible for 86% of the 4.8 million fatalities every year by 2050, representing an alarming 4.8% spike in overall mortality since 2020.
This has led to an increased need for injections and vaccinations. Diabetic patients are fully reliant on regular insulin dosages for their well-being. Thus, customers in such categories are likely to have a strong desire for painless or pain-free needles to prevent the discomfort or disquiet of painful needles. This, in turn, is driving the demand for safety needles.
Technological Advancements in Needle Safety: Advanced medical technologies to lower the expenses of needle-stick infections are redesigning the way to needle safety. Re-sheathing systems are a highly prevalent type of safety feature. A needle cap and safety lock are examples of shielding that cover or rewind the needle after usage. The ETS needle's safety feature is simple to operate and requires no prior experience to utilize properly. This has played a pivotal role in the insulin pen needles market growth.
Evolving Patient Preferences and Empowerment: World leaders promised in 2020 to offer health care to all populations by 2035. The globe is simply halfway to completing the Sustainable Development Goals (SDGs) aim of obtaining complete health coverage by 2035 in 2025. Countries throughout the world are still feeling the effects of the epidemic after more than two and a half years.
According to WHO, temporary boosts to government spending caused by the pandemic's aftermath amounted to a surge in global health expenditure close to USD 9 trillion in 2024. This has facilitated greater access to advanced medical equipment, including safety needles. This expansion of healthcare facilities has expanded the needle market's reach.
Between 2020 and 2025, the safety needles market share reached from USD 3,961.8 million to USD 5,474.1 million, registering a 6.7% CAGR. The demand for safety needles increased due to growing awareness about healthcare-associated infections. Regulations and healthcare policies encouraged the use of safety needles.
New safety features in needles caught the attention of healthcare providers and facilities, making them more interested in using them. This led to a gradual shift from conventional needles to safety needles.
| Metric | Value |
|---|---|
| Safety Needles Market Size (2020) | USD 3,961.8 million |
| Safety Needles Market Size (2025) | USD 5,474.1 million |
| Historical Value CAGR (2020 to 2025) | 6.7% |
The safety needles market size is projected to reach from USD 5,840.7 million in 2025 to USD 11,972.7 million by 2035, exhibiting a 7.4% CAGR. The historical market growth lagged behind forecasts due to initial resistance to adopting safer medical practices. Healthcare facilities faced challenges in transitioning from traditional needles. Additionally, regulatory changes and production constraints contributed to the slower-than-anticipated growth during the historical period.
Looking ahead to 2025, the efforts made by the government to encourage people to get vaccinated are likely to boost the safety needle market growth down the line. This means that policies and programs aimed at promoting vaccinations are projected to play a significant role in making safety needles more widely used during the forecast period.
Prominent market players are focusing on the development of new products to meet the demands of safety needles in prenatal and postnatal research. Sharps Technology, Inc., a medical device and drug delivery organization that offers licensed, top-of-the syringe products, revealed the release of the company's concentrated pre-fillable syringe system lineup in January 2025. This needle is going to be developed through a partnership with Nephron Pharmaceuticals at the Inject EZ facility in the United States.
| Atrribute | Details |
|---|---|
| Trends |
|
| Opportunities |
|
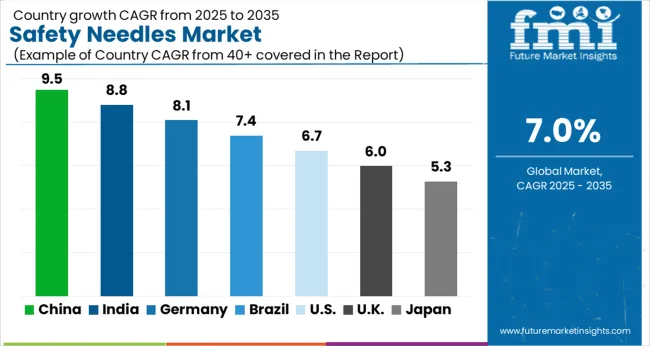
In 2025, North America secured its dominance in the global safety needles market with a 32.2% share, attributed to robust healthcare infrastructure and early adoption of advanced medical technologies. Europe closely trailed with 30.5%, driven by strong regulatory frameworks and a well-established healthcare system.
| Countries | 2025 Value Share in Global Market |
|---|---|
| United States | 27.8% |
| Germany | 7.9% |
| Japan | 8.5% |
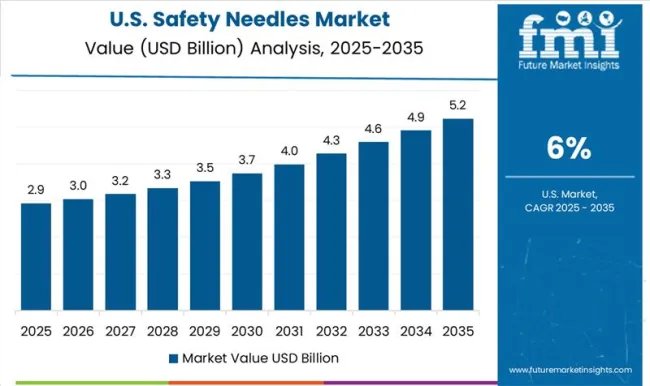
The rising prevalence of chronic illnesses such as cancer, diabetes, and others is likely to fuel the steady expansion of the United States safety needles market during the forecast period. The United States emerged as the prime country in the North America safety pen needles market. Based on the American Cancer Society 2024 study, an estimated 6.3 million additional cases of cancer and 606,520 cancer-related fatalities were recorded in the United States in 2024.
Furthermore, the overall incidence of chronic diseases such as Crohn's disease and diabetes, both of which can be managed with self-injectable medicine, is increasing. As per the Diabetes Research Institute Foundation, diabetes affects 10.5% of Americans, or 34.2 million individuals. Based on estimations, there were over 26.8 million people with diabetes in the country.
Needles are required for a multitude of diagnostic and therapeutic approaches for chronic illnesses, given their importance during drug and test management, boosting increasing calls for the product. Furthermore, safety needle market participants are using numerous methods to increase their market position, such partnerships and product launches.
Smith's Medical, for example, partners with the United States government to produce a vaccine in January 2025. The collaboration with BARDA and JPEO-CBRND includes a USD 20 million capital for increased syringe and needle device manufacturing to assist with the Operation Warp Speed vaccination program, which is projected to boost the market growth in the syringes & needles in the coming years.
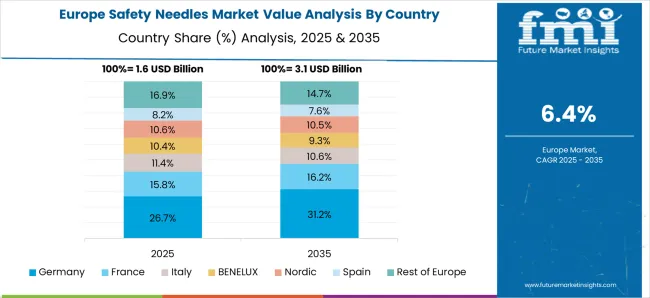
Germany gearshifts the Europe safety needles market. Many people in Germany have chronic diseases across the country, such as HIV, diabetes, or multiple sclerosis. In a 2020 study conducted by the Forschungsgruppe Wahlen (an institution for election research in Germany), 46% of respondents said they had a chronic ailment.
In all demographics, the percentage of individuals with conditions such as hypertension, lipid metabolism, diabetes, and coronary heart disease surpasses 20%.
Germany's healthcare system is built on four fundamental principles
In Germany, everyone is required to have insurance, which makes treatments more accessible for patients. Therefore, demand for adequate healthcare services and pharmaceuticals is increasing rapidly in the country. As a result of such initiatives, the retractable needle safety syringes market is likely to increase during the forecast period.
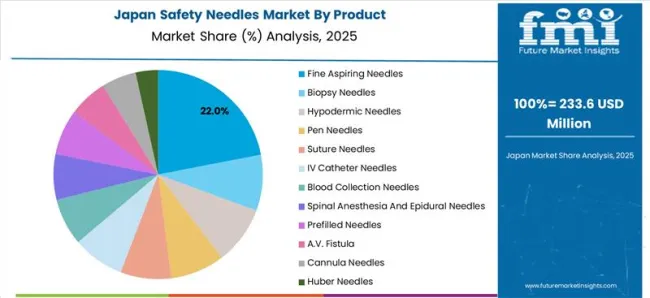
Cancer, heart disease, and cerebrovascular disease (CVD) are the three primary reasons for fatalities in Japan. A recent research in Japan found that more than 90% of persons aged 75 and over have a minimum of one chronic condition, with more than 80% having several chronic diseases.
Furthermore, since 1981, cancer has remained the leading cause of mortality in Japan. The second worst cause of fatality is heart disease, which continues to be on the rise. It is evident that there is a critical need for safer medical procedures.
Safety needles offer a crucial advantage in this context, as they substantially reduce the risk of needlestick sharp injuries and potential transmission of infections. This heightened concern for patient safety is likely to drive healthcare providers and facilities to opt for safety needles over conventional ones.
Globally, the country has a large presence in the production of medical equipment, including biopsy and anesthetic needles. With large production volumes, the country is poised to provide new development prospects for leading companies in the safety needles market.
| Countries | Value CAGR between 2025 and 2035 |
|---|---|
| United Kingdom | 7.0% |
| India | 11.1% |
| China | 9.7% |
The safety needles market in the United Kingdom is poised for significant growth in the coming years. In this country, the four primary persistent diseases for men and women were allergies, hypertension, low back problems, and depressive disorders.
There is also a notable rise in the practice of self-administering medication within the comfort of one's home. The trend of self-administration has gained momentum as it offers individuals greater convenience and autonomy in managing their health conditions.
Patients are increasingly opting to self-administer medications for various purposes, such as chronic disease management, vaccinations, and other medical treatments. The emphasis on safety and ease of use has become paramount, and safety needles aptly address these concerns.
India is expected to be the leading safety needles market in the Asia Pacific. Safety needles are becoming more popular in India as a result of the availability of low-cost raw materials, improved labor access, and an increase in the number of hospitals and healthcare institutions. India has witnessed a prominent medical tourism industry’s growth lately, particularly for orthopedic procedures.
The country is becoming a popular location for safety needles. Factors such as rising government efforts to give vaccines to every newborn child, the substantial existence of needle producers, and awareness about contemporary trends in the aspiration & biopsy needles are boosting the safety needles market in India.
In 2020, around 17% of healthcare professionals in India engaged in dangerous injection practices. The percentage of dangerous injection procedures was greater among rural healthcare service providers, increasing the population's risk of injuries caused by needle sticks. Needle stick injuries (NSI) occurred in 52.2% of service providers, with an annual incidence of NSI of 19%.
Furthermore, an increase in demand for vaccines and immunization, technical developments, and an increase in the usage of injectable medications are the significant drivers projected to drive the safety pen needle market growth during the projection period. In 2025, India sold USD 496 billion in syringes with and without needles while obtaining USD 957 billion in syringes with and without needles.
China is the second leading safety needles market, next to India. Based on the United States Institute for Health Metrics and Evaluation's global burden of disease report, strokes are the leading cause of death in China, closely followed by heart disease, chronic pulmonary disease, and lung cancer. China is putting a greater emphasis on improving the country's healthcare infrastructure.
The emphasis on modernizing medical practices lines up perfectly with the integration of safety needles. This represents a significant leap forward in patient and healthcare worker safety.
The country has seen an important transition toward manufacturing low-cost needles for both domestic and foreign markets. China sold USD 6.3 billion in Syringes, with or without needles, in 2024, thereby becoming the world's top supplier of Syringes, with or without needles.
This is a key factor driving this country’s safety syringes market expansion. China-based manufacturers make use of economies of scale and superior production skills to provide competitive pricing without sacrificing quality. Furthermore, automation is increasingly being used in needle manufacturing processes, resulting in improved manufacturing effectiveness and overhead savings.
By product type, the market is segmented into fine aspiring needles, biopsy needles, hypodermic needles, pen needles, suture needles, IV catheter needles, blood collection needles, spinal anesthesia and epidural needles, prefilled needles, A.V. fistula, cannula needles, and Huber needles.
The hypodermic needles segment dominated the global market in 2025, accounting for a 17.2% share. In a similar vein, when considering the application, the safety needle market is divided into sample collection and drug delivery. Notably, the drug delivery segment took the lead, commanding an impressive 54.6% market share in 2025.
Depending on the distribution channel, the market is categorized into hospitals pharmacies, private clinics, retail pharmacies & drug stores, and e-commerce. The hospitals pharmacies segment held the prime share at 50.9% in 2025.
| Segment | 2025 Value Share in Global Market |
|---|---|
| Hypodermic Needle | 17.2% |
| Drug Delivery | 54.6% |
| Hospital Pharmacies | 50.9% |
The demand for safety hypodermic needles is rising owing to their integrated safety features and invention in creating multi-safety needles. Since diabetic patients need to get periodic injections of insulin to be healthy, there is likely to be considerable demand for painless or pain-free needles to avoid any discomfort or disquiet connected with painful needles.
As a result, the demand for safe hypodermic needles is rising at a steady rate, contributing to the overall safety needles market expansion. To preserve their market position, prominent companies in the hypodermic needles market are working on producing better needles. Terumo Corporation has created hypodermic syringes with built-in plunger stops that safeguard the needle from coming out.
The drug delivery sector is likely to have the upper hand in the safety needles market throughout the forecast period, owing to its utilization in expanding clinical applications. As the demand for various medications and vaccines continues to grow, the need for safe and efficient means of administering these substances becomes paramount.
Moreover, the prevalence of chronic diseases, such as diabetes and various forms of cancer, has led to an increasing number of patients requiring regular injections or infusions. Safety needles offer a reliable method for healthcare professionals to administer drugs accurately while minimizing the risk of needlestick injuries.
The hospital pharmacies segment is estimated to lead the safety needles market throughout the forecast period. Given the availability of trained medical personnel and innovative technologies, target patients choose hospitals for treatment operations. The rising incidence of chronic diseases such as HIV, cancer, and spine disorders is prevalent.
This rapidly growing number of chronic disease patients is also boosting hospital demand for vertebroplasty needles. These devices are utilized in the administration of drugs and the collecting of blood samples, both of which are primarily carried out by highly trained medical personnel in hospitals and operation centers.
Hospitals are critical sites for several treatments, the bulk of which need the use of a needle in some form or another. As a result, hospital pharmacists ensure that their inventory is well stocked in order to provide the essential needle at the appropriate moment.
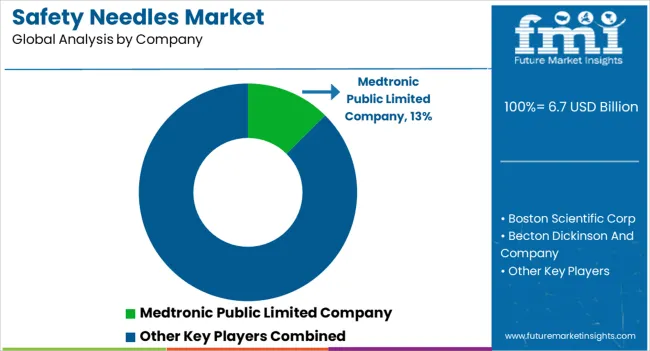
The global safety needles market exhibits a complex landscape characterized by many international and domestic companies, all vying for a significant stake in the market. This fragmentation underscores the diversity and competitiveness within the industry. Companies invest heavily in research and development to create cutting-edge safety needle technologies.
They are also establishing strategic partnerships and collaborations with other organizations to access new markets. Many companies seek to expand their presence in different regions by entering new markets or acquiring established local businesses. Compliance with stringent regulatory requirements is overriding in the healthcare industry. Companies invest in ensuring that their products meet all safety and quality standards, which can differentiate them in the market.
Recent Developments in the Safety Needles Market
The global safety needles market is estimated to be valued at USD 6.7 billion in 2025.
The market size for the safety needles market is projected to reach USD 13.3 billion by 2035.
The safety needles market is expected to grow at a 7.0% CAGR between 2025 and 2035.
The key product types in safety needles market are fine aspiring needles, biopsy needles, hypodermic needles, pen needles, suture needles, iv catheter needles, blood collection needles, spinal anesthesia and epidural needles, prefilled needles, a.v. fistula, cannula needles and huber needles.
In terms of application, drug delivery segment to command 59.3% share in the safety needles market in 2025.


Our Research Products

The "Full Research Suite" delivers actionable market intel, deep dives on markets or technologies, so clients act faster, cut risk, and unlock growth.

The Leaderboard benchmarks and ranks top vendors, classifying them as Established Leaders, Leading Challengers, or Disruptors & Challengers.

Locates where complements amplify value and substitutes erode it, forecasting net impact by horizon

We deliver granular, decision-grade intel: market sizing, 5-year forecasts, pricing, adoption, usage, revenue, and operational KPIs—plus competitor tracking, regulation, and value chains—across 60 countries broadly.

Spot the shifts before they hit your P&L. We track inflection points, adoption curves, pricing moves, and ecosystem plays to show where demand is heading, why it is changing, and what to do next across high-growth markets and disruptive tech

Real-time reads of user behavior. We track shifting priorities, perceptions of today’s and next-gen services, and provider experience, then pace how fast tech moves from trial to adoption, blending buyer, consumer, and channel inputs with social signals (#WhySwitch, #UX).

Partner with our analyst team to build a custom report designed around your business priorities. From analysing market trends to assessing competitors or crafting bespoke datasets, we tailor insights to your needs.
Supplier Intelligence
Discovery & Profiling
Capacity & Footprint
Performance & Risk
Compliance & Governance
Commercial Readiness
Who Supplies Whom
Scorecards & Shortlists
Playbooks & Docs
Category Intelligence
Definition & Scope
Demand & Use Cases
Cost Drivers
Market Structure
Supply Chain Map
Trade & Policy
Operating Norms
Deliverables
Buyer Intelligence
Account Basics
Spend & Scope
Procurement Model
Vendor Requirements
Terms & Policies
Entry Strategy
Pain Points & Triggers
Outputs
Pricing Analysis
Benchmarks
Trends
Should-Cost
Indexation
Landed Cost
Commercial Terms
Deliverables
Brand Analysis
Positioning & Value Prop
Share & Presence
Customer Evidence
Go-to-Market
Digital & Reputation
Compliance & Trust
KPIs & Gaps
Outputs
Full Research Suite comprises of:
Market outlook & trends analysis
Interviews & case studies
Strategic recommendations
Vendor profiles & capabilities analysis
5-year forecasts
8 regions and 60+ country-level data splits
Market segment data splits
12 months of continuous data updates
DELIVERED AS:
PDF EXCEL ONLINE
Safety Label Market Size and Share Forecast Outlook 2025 to 2035
Safety Bottle Tote Carriers Packaging Market Size and Share Forecast Outlook 2025 to 2035
Safety Towing System Market Size and Share Forecast Outlook 2025 to 2035
Safety Syringe Market Size and Share Forecast Outlook 2025 to 2035
Safety Actuators Market Size and Share Forecast Outlook 2025 to 2035
Safety Laser Scanner Market Size and Share Forecast Outlook 2025 to 2035
Safety Limit Switches Market Size and Share Forecast Outlook 2025 to 2035
Safety Reporting Systems Market Size and Share Forecast Outlook 2025 to 2035
Safety Eyewear Market Analysis - Size, Share, and Forecast 2025 to 2035
Safety Box for Syringe Market Size, Share & Forecast 2025 to 2035
Safety Valve Market Size, Growth, and Forecast 2025 to 2035
Safety Relays Market Size, Share, and Forecast 2025 to 2035
Safety Instrumentation Systems Market – Trends & Forecast 2025 to 2035
Safety Mirrors Market - Growth & Forecast 2025 to 2035
Safety Switches Market Trends – Growth & Forecast 2025 to 2035
Safety Interlock Switches Market Analysis by Actuation Method, Application and End-use Industry and Region 2025 to 2035
Safety Light Curtains Market Growth - Trends & Forecast 2025 to 2035
Key Companies & Market Share in the Safety Eyewear Sector
Industry Share Analysis for Safety Box for Syringe Companies
Safety and Process Filter Market Growth – Trends & Forecast 2024-2034

Thank you!
You will receive an email from our Business Development Manager. Please be sure to check your SPAM/JUNK folder too.
Chat With
MaRIA