The Safety Actuators Market is estimated to be valued at USD 0.9 billion in 2025 and is projected to reach USD 2.1 billion by 2035, registering a compound annual growth rate (CAGR) of 8.6% over the forecast period.
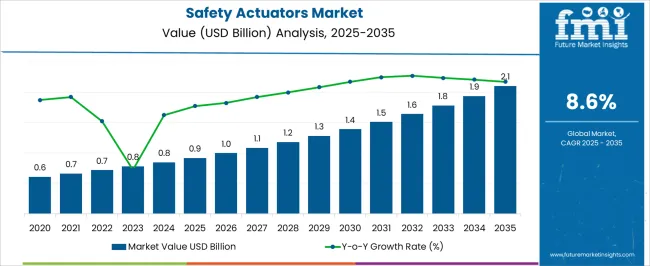
| Metric | Value |
|---|---|
| Safety Actuators Market Estimated Value in (2025 E) | USD 0.9 billion |
| Safety Actuators Market Forecast Value in (2035 F) | USD 2.1 billion |
| Forecast CAGR (2025 to 2035) | 8.6% |
The Safety Actuators market is experiencing steady growth, driven by the increasing demand for advanced safety mechanisms in industrial and automotive sectors. Rising emphasis on workplace safety, regulatory compliance, and automation is fueling adoption across multiple industries. Safety actuators are being leveraged to reduce operational risks, enhance machine reliability, and prevent accidents in high-risk environments.
Electric safety actuators, in particular, offer precise control, rapid response, and integration capabilities with industrial automation systems, making them suitable for diverse applications. Investments in smart manufacturing, industrial robotics, and connected vehicles are further expanding market opportunities. The growing adoption of automation in automotive production and heavy machinery manufacturing is creating demand for reliable safety solutions that can ensure operational continuity while minimizing hazards.
Additionally, increasing awareness among manufacturers about occupational safety standards and regulatory mandates is reinforcing the need for advanced actuator solutions Continuous technological innovation, including enhanced sensor integration, control algorithms, and energy-efficient designs, is expected to sustain long-term market growth.
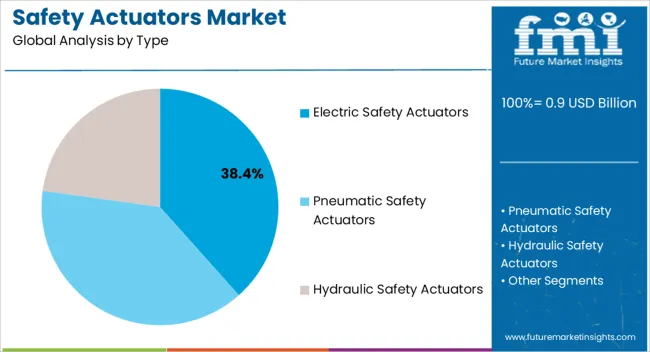
The electric safety actuators segment is projected to hold 38.4% of the market revenue in 2025, establishing it as the leading type. Growth in this segment is being driven by the demand for precise, reliable, and automated safety mechanisms across industrial and automotive applications. Electric actuators provide consistent performance, fast response times, and easy integration with control systems, which enhances operational efficiency and safety compliance.
The ability to adjust performance parameters via software and integrate with existing automation platforms reduces operational downtime and maintenance costs. Rising adoption in manufacturing facilities, industrial robotics, and automated assembly lines further supports segment growth.
Additionally, electric actuators are increasingly preferred due to their energy efficiency, compact design, and ability to perform complex safety functions without requiring extensive hardware modifications With ongoing advancements in motion control, sensor technology, and predictive maintenance integration, the electric safety actuators segment is expected to maintain its market leadership, supported by strong demand for intelligent, reliable, and high-performance safety solutions.
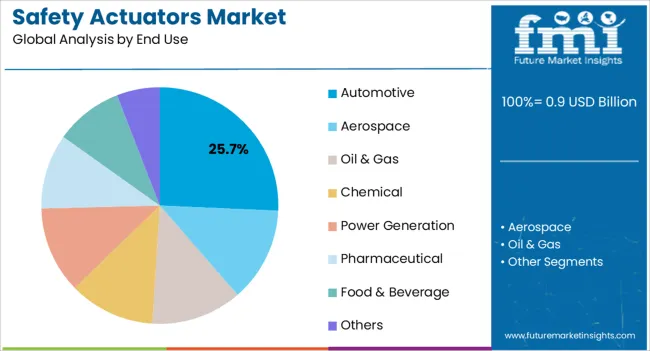
The automotive end-use segment is anticipated to account for 25.7% of the market revenue in 2025, making it the leading end-use industry. Growth is being driven by increasing implementation of automated safety systems, advanced driver assistance systems, and electric vehicle platforms that require reliable actuators for functional safety. Electric safety actuators are leveraged to control critical safety functions, including braking systems, seat adjustments, and collision avoidance mechanisms, which enhance vehicle performance and passenger protection.
Regulatory emphasis on automotive safety standards, including ISO and regional mandates, has further reinforced adoption. Additionally, the integration of actuators into modern automotive assembly lines improves production efficiency and reduces human error in safety-critical processes.
Rising investments in autonomous vehicles, connected cars, and smart mobility solutions are creating further demand for high-precision actuators As automotive manufacturers continue to prioritize functional safety, operational efficiency, and regulatory compliance, the automotive segment is expected to maintain its leading position, supported by the integration of advanced electric safety actuators into vehicle platforms and production systems.
As per the report, the global safety actuators market witnessed a CAGR of 11.8% in the historical period from 2020 to 2025. It is estimated to expand at 9.1% CAGR across the outlook period.
Increasing industrial automation, growing focus on worker safety, and evolving regulatory frameworks are a few factors expected to propel safety actuator sales by 2035. Rising awareness of liability & risk management and need for reliable safety solutions are also a couple of other factors excepted to aid sales.
Rise of industrial automation has been a leading driver of safety actuator demand. As sectors embrace automation technologies to improve productivity and efficiency, need for robust safety measures becomes crucial.
Safety actuators provide a reliable solution by enabling the safe operation of automated machinery and equipment. They are expected to help in protecting workers and minimizing the risk of accidents in highly dynamic and complex environments.
There has been a growing focus on worker safety across multiple sectors. Employers recognize the importance of providing a safe working environment to protect their workforce and mitigate potential liabilities. Safety actuators might offer a proactive approach to minimize risks, ensuring the safety and well-being of employees operating in hazardous conditions.
In Germany, for instance, workers are required to comply with the Occupational Health and Safety Act (ArbSchG). It covers a range of safety aspects, including hazard assessment, protective measures, and worker participation in safety matters.
Need for reliable safety solutions has been a key factor in the rise of safety actuator sales. Companies often require safety measures that can effectively detect and respond to potential hazards in real-time.
They can help in ensuring the safety of workers and integrity of equipment & processes. Safety actuators offer a dependable and efficient solution by monitoring and controlling critical safety functions. Their ability to provide a high level of protection and peace of mind is expected to elevate demand.
Increasing Adoption of Industry 4.0 Worldwide
Industry 4.0, characterized by integration of advanced technologies and automation in manufacturing processes, is significantly impacting demand for safety actuators. This digital transformation is pushing the need for enhanced safety measures. These aim to ensure safe operation of interconnected systems, collaborative robots, and intelligent machinery.
Industry 4.0 is witnessing a surge in automation and deployment of robotics across various sectors. With integration of robots into the workforce, safety actuators can play a critical role in enabling safe human-robot collaboration. These actuators might provide real-time monitoring and control of robot movements, ensuring safety of workers in close proximity to robots.
Industry 4.0 also emphasizes interconnectedness of machines, systems, and processes. Safety actuators equipped with smart technologies and connectivity can enable real-time data collection, analysis, and communication.
This data-driven approach might enhance safety by enabling predictive maintenance, proactive monitoring of safety parameters, and timely response to potential hazards.
Industry 4.0 promotes the convergence of physical systems with digital technologies. Safety actuators are integrated into cyber-physical systems.
It helps in enabling seamless communication between safety devices and other automation components. This integration is likely to ensure synchronized and coordinated safety functions, allowing for comprehensive safety measures across the entire system.
Industry 4.0 might also propel the development of adaptive and flexible manufacturing processes to meet changing demands. Safety actuators can provide the flexibility and adaptability required in dynamic production environments.
They can quickly and safely respond to changes in production parameters and machine configurations. At the same time, they can fulfill operational requirements, ensuring worker safety during rapid reconfigurations.
For instance, Addverb, a renowned automation and robotics firm, debuted its second greenfield robot production facility, Bot-Verse, in Greater Noida in June 2025. Bot-Verse is spread out over 15 acres. About 100,000 distinct types and categories of robots can be produced annually by Bot-Verse.
Surging Focus on Cybersecurity Measures All Over the Globe
Rising focus on cybersecurity measures is expected to push demand for safety actuators worldwide. It is attributed to increasing interconnectedness of industrial systems and need to protect these systems from potential cyber threats.
Safety actuators play a crucial role in safeguarding safety-critical systems from cyber-attacks. Systems such as emergency shutdown systems or safety interlocks are responsible for ensuring safe operation of machinery and equipment.
By incorporating cybersecurity features, safety actuators can prevent unauthorized access, tampering, or disruption of these critical safety functions.
Safety actuators are often connected to industrial networks and control systems. With increasing connectivity, there is a growing need to ensure secure communication and data integrity.
Safety actuators with robust cybersecurity measures can encrypt communication channels, implement access controls, and authenticate data. They help to protect against data breaches or unauthorized manipulation, thereby boosting sales.
Cybersecurity vulnerabilities can also be exploited to manipulate safety systems, leading to potentially hazardous situations. By utilizing safety actuators with built-in cybersecurity features, organizations can mitigate the risk of malicious manipulation of safety-critical functions. These features can include digital signatures, secure firmware updates, and intrusion detection mechanisms.
Sectors such as critical infrastructure, manufacturing, and healthcare have specific cybersecurity requirements and regulations. Adhering to these standards often necessitates implementation of cybersecurity measures in safety-critical components, including safety actuators.
Safety actuator demand with robust cybersecurity capabilities might arise from the need to comply with these industry-specific standards and regulations.
Safety actuators that can seamlessly integrate with existing security infrastructure are becoming increasingly important worldwide. Firewalls, intrusion detection systems, and security event management platforms are a few examples of the same.
Integration might ensure a holistic approach to cybersecurity, where safety actuators are part of a comprehensive security ecosystem. They can further help in enhancing the cyber resilience of industrial systems.
In April 2025, the United Kingdom government introduced enhanced cyber security measures to protect its IT system. The Government Security Group, a division of the Cabinet Office, will oversee the new GovAssure cyber security program.
Improved cyber security initiatives might boost the country’s cyber resilience and shield crucial IT operations of the government from ever-increasing threats. According to new regulations, cyber health of all the government's departments will be evaluated yearly using new, stricter standards.
Smart City Development in China to Propel Demand for Safety Gate Switches
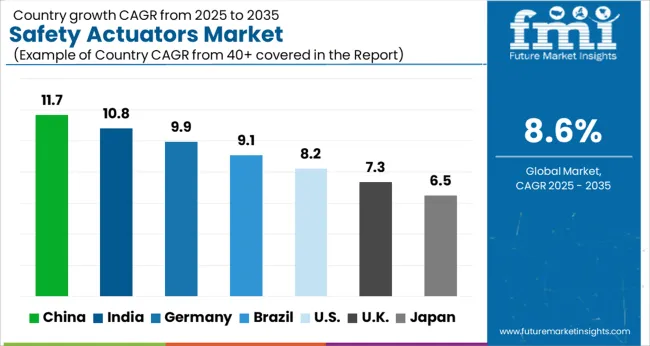
China safety actuators market is projected to witness a CAGR of 9.0% from 2025 to 2035. It is likely to create an absolute dollar opportunity worth USD 252.1 million during the projection period.
There is an increasing awareness and consciousness of safety in China, driven by several high-profile industrial accidents in the past. This has prompted businesses and sectors to invest in safety technologies and solutions. These include safety actuators to proactively mitigate risks and prevent accidents.
China's ongoing infrastructure development projects, including construction of high-speed railways, smart cities, and advanced manufacturing facilities, require robust safety measures. Safety actuators are set to be instrumental in ensuring safe operation of critical infrastructure components and machinery, propelling demand for these devices.
One of the recent start-ups in China creating smart city management software and apps is Freedo. Increasing number of start-up companies in the country focusing on unveiling unique products would also propel growth.
China has also been investing heavily in research & development and technological advancements.
This has led to the creation of innovative safety actuator solutions that cater to specific needs of organizations in the country. These advancements have increased reliability, efficiency, and adaptability of safety actuators, making them more appealing to businesses.
United Kingdom-based Firms to Demand Safety Switch Interlocks amid Implementation of Strict Norms
The United Kingdom safety actuators market is anticipated to witness a CAGR of 8.8% throughout the envisaged timeframe. It is likely to reach a valuation of more than USD 2.1 million by 2035.
The United Kingdom has robust safety regulations in place such as the Health and Safety at Work Act (HASAWA) and other industry-specific regulations. These regulations require businesses to prioritize worker safety and implement appropriate safety measures, including the use of safety actuators. Need to comply with these stringent regulations is set to fuel the demand for safety actuators.
There is a growing focus on workplace well-being and employee welfare in the United Kingdom. Employers are recognizing the importance of creating a safe work environment to protect their workforce and enhance productivity. Safety actuators might provide a reliable means of preventing accidents and injuries, promoting worker well-being and fostering a positive work culture.
In October 2025, Draeger Safety UK released a new study on the level of occupational safety in the United Kingdom. It stated that around 52% of British employees say they feel secure at work now compared to how they were a year ago. About 37% of respondents said that more work has to be done to ensure that experience is passed on to the upcoming workforce.
The United Kingdom is further witnessing an increasing adoption of automation and robotics in various sectors. As automation technology becomes more prevalent, demand for safety actuators rises in tandem. These actuators ensure safe collaboration between humans and robots, safeguarding workers in close proximity to automated systems.
Electric Safety Actuators to Exhibit Skyrocketing Demand in the World
In terms of type, the electric safety actuators segment is anticipated to exhibit a CAGR of 9.0% throughout the anticipated period. It recorded a CAGR of 11.7% from 2020 to 2025 in the global safety actuators market.
Electric safety actuators offer a more environmentally friendly alternative to traditional hydraulic or pneumatic actuators. As sectors and businesses strive to reduce their carbon footprint and embrace sustainability practices, demand for electric actuators has increased. It is due to their lower energy consumption, reduced emissions, and absence of hydraulic fluids or compressed air.
Electric safety actuators can also offer long-term cost savings compared to other types of actuators. While upfront costs might be higher, these actuators have lower operating and maintenance costs over their lifespan. They eliminate the need for hydraulic fluids or air compressors, reducing associated maintenance, servicing, and energy costs.
Electric safety actuators often have a more compact and lightweight design compared to hydraulic or pneumatic systems. This compactness might allow for easier integration into existing machinery and equipment without significant modifications.
It can make them suitable for a wide range of applications. High flexibility of electric actuators might also enable precise control and positioning, enhancing operational efficiency.
Demand for Safe Electric Actuators to Rise among Leading Automakers Globally
Based on application, the automotive category is likely to register 8.7% CAGR in the assessment period. During the historical period, it exhibited a CAGR of 11.5% in the safety actuators market.
The automotive sector places a high priority on vehicle safety to ensure the well-being of occupants and comply with stringent safety regulations. Safety actuators play a crucial role in various safety systems such as airbags, seatbelts, electronic stability control, and anti-lock braking systems. Increasing demand for vehicle safety features is likely to lead to a corresponding rise in the demand for safety actuators.
Integration of Advanced Driver-assistance System (ADAS) technologies in modern vehicles has significantly increased demand for safety actuators. ADAS features such as adaptive cruise control, lane-keeping assist, and automatic emergency braking rely on safety actuators.
They help with proper functioning of the aforementioned features. As ADAS systems become more prevalent, need for reliable and precise safety actuators has grown.
Ongoing shift toward electric vehicles (EVs) and development of autonomous driving technologies have also contributed to increased safety actuator demand in the automotive sector. EVs require safety actuators for components such as electric power steering, regenerative braking systems, and battery management systems. Autonomous vehicles might rely on safety actuators to ensure safe operation, including steering, braking, and acceleration.
Automotive manufacturers are continuously seeking ways to reduce vehicle weight and optimize space utilization. Safety actuators, particularly electric actuators, offer advantages in terms of their compact size and lightweight design, making them suitable for automotive applications where space is limited.
Demand for safety actuators with small form factors is likely to expand as manufacturers aim to maximize interior and cargo space.
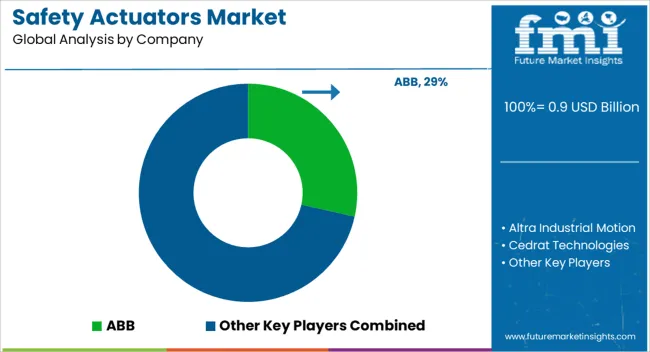
Safe actuator manufacturers might employ various strategies to compete with their rivals in the market. These strategies can focus on differentiating their products, enhancing customer value, and establishing a competitive edge.
Manufacturers would strive to differentiate their products by focusing on innovation and offering unique features. This includes developing advanced safety technologies and incorporating smart functionalities.
They are also improving performance metrics and addressing specific market requirements. By offering differentiated products, manufacturers can attract customers looking for specific capabilities and gain a competitive advantage.
Safe actuator manufacturers would further compete by ensuring the highest levels of quality and reliability in their products. They can invest in research & development, conduct rigorous testing, and implement quality control measures.
By adopting such strategies, they would aim to deliver products that meet or exceed market standards. By establishing a reputation for reliable and durable products, manufacturers can gain the trust and preference of customers over their rivals.
For instance,
| Attribute | Details |
|---|---|
| Estimated Market Size (2025) | USD 0.9 billion |
| Projected Market Valuation (2035) | USD 2.1 billion |
| Value-based CAGR (2025 to 2035) | 8.6% |
| Historical Data | 2020 to 2025 |
| Forecast Period | 2025 to 2035 |
| Quantitative Units | Value (USD billion) |
| Segments Covered | Type, End Use, Region |
| Key Countries Covered | North America; Latin America; Western Europe; Eastern Europe; South Asia and Pacific; East Asia; Middle East & Africa |
| Key Companies Profiled | ABB; Altra Industrial Motion; Cedrat Technologies; Curtis Wright (Exlar); DVG Automation |
| Report Coverage | Revenue Forecast, Volume Forecast, Company Ranking, Competitive Landscape, Growth Factors, Trends and Pricing Analysis |
The global safety actuators market is estimated to be valued at USD 0.9 billion in 2025.
The market size for the safety actuators market is projected to reach USD 2.1 billion by 2035.
The safety actuators market is expected to grow at a 8.6% CAGR between 2025 and 2035.
The key product types in safety actuators market are electric safety actuators, pneumatic safety actuators and hydraulic safety actuators.
In terms of end use, automotive segment to command 25.7% share in the safety actuators market in 2025.


Our Research Products

The "Full Research Suite" delivers actionable market intel, deep dives on markets or technologies, so clients act faster, cut risk, and unlock growth.

The Leaderboard benchmarks and ranks top vendors, classifying them as Established Leaders, Leading Challengers, or Disruptors & Challengers.

Locates where complements amplify value and substitutes erode it, forecasting net impact by horizon

We deliver granular, decision-grade intel: market sizing, 5-year forecasts, pricing, adoption, usage, revenue, and operational KPIs—plus competitor tracking, regulation, and value chains—across 60 countries broadly.

Spot the shifts before they hit your P&L. We track inflection points, adoption curves, pricing moves, and ecosystem plays to show where demand is heading, why it is changing, and what to do next across high-growth markets and disruptive tech

Real-time reads of user behavior. We track shifting priorities, perceptions of today’s and next-gen services, and provider experience, then pace how fast tech moves from trial to adoption, blending buyer, consumer, and channel inputs with social signals (#WhySwitch, #UX).

Partner with our analyst team to build a custom report designed around your business priorities. From analysing market trends to assessing competitors or crafting bespoke datasets, we tailor insights to your needs.
Supplier Intelligence
Discovery & Profiling
Capacity & Footprint
Performance & Risk
Compliance & Governance
Commercial Readiness
Who Supplies Whom
Scorecards & Shortlists
Playbooks & Docs
Category Intelligence
Definition & Scope
Demand & Use Cases
Cost Drivers
Market Structure
Supply Chain Map
Trade & Policy
Operating Norms
Deliverables
Buyer Intelligence
Account Basics
Spend & Scope
Procurement Model
Vendor Requirements
Terms & Policies
Entry Strategy
Pain Points & Triggers
Outputs
Pricing Analysis
Benchmarks
Trends
Should-Cost
Indexation
Landed Cost
Commercial Terms
Deliverables
Brand Analysis
Positioning & Value Prop
Share & Presence
Customer Evidence
Go-to-Market
Digital & Reputation
Compliance & Trust
KPIs & Gaps
Outputs
Full Research Suite comprises of:
Market outlook & trends analysis
Interviews & case studies
Strategic recommendations
Vendor profiles & capabilities analysis
5-year forecasts
8 regions and 60+ country-level data splits
Market segment data splits
12 months of continuous data updates
DELIVERED AS:
PDF EXCEL ONLINE
Safety Label Market Size and Share Forecast Outlook 2025 to 2035
Safety Bottle Tote Carriers Packaging Market Size and Share Forecast Outlook 2025 to 2035
Safety Towing System Market Size and Share Forecast Outlook 2025 to 2035
Safety Syringe Market Size and Share Forecast Outlook 2025 to 2035
Safety Needles Market Size and Share Forecast Outlook 2025 to 2035
Safety Laser Scanner Market Size and Share Forecast Outlook 2025 to 2035
Safety Limit Switches Market Size and Share Forecast Outlook 2025 to 2035
Safety Reporting Systems Market Size and Share Forecast Outlook 2025 to 2035
Safety Eyewear Market Analysis - Size, Share, and Forecast 2025 to 2035
Safety Box for Syringe Market Size, Share & Forecast 2025 to 2035
Safety Valve Market Size, Growth, and Forecast 2025 to 2035
Safety Relays Market Size, Share, and Forecast 2025 to 2035
Safety Instrumentation Systems Market – Trends & Forecast 2025 to 2035
Safety Mirrors Market - Growth & Forecast 2025 to 2035
Safety Switches Market Trends – Growth & Forecast 2025 to 2035
Safety Interlock Switches Market Analysis by Actuation Method, Application and End-use Industry and Region 2025 to 2035
Safety Light Curtains Market Growth - Trends & Forecast 2025 to 2035
Key Companies & Market Share in the Safety Eyewear Sector
Industry Share Analysis for Safety Box for Syringe Companies
Safety and Process Filter Market Growth – Trends & Forecast 2024-2034

Thank you!
You will receive an email from our Business Development Manager. Please be sure to check your SPAM/JUNK folder too.
Chat With
MaRIA