De-Nester and Liner Inserters Market Size and Share Forecast Outlook 2025 to 2035

The de-nester and liner inserters market is forecast to grow from USD 1.6 billion in 2025 to USD 2.8 billion by 2035, recording an increase of USD 1.2 billion over the ten-year period. This growth represents a 75.0% total expansion, with the market achieving a compound annual growth rate (CAGR) of 5.7%. Over the decade, the market scales up by a 1.7 multiple.
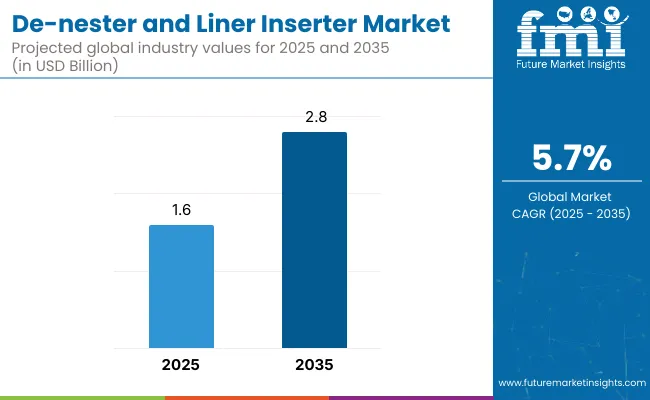
Quick De-Nester and Liner Inserters Market

  • Market Value (2025): USD 1.6 billion
  • Market Forecast Value (2035): USD 2.8 billion
  • Market Forecast CAGR: 5.7%
  • Leading Segment in 2025: Cup/Bowl De-Nester (48.3%)
  • Key Growth Regions: Asia-Pacific (India is the fastest-growing market with 7.4% CAGR)
  • Top Key Players: SEALPAC, Kaupert Marburg,Chunlai Packing Machinery Co., Farmo Res SRL, Millitec Food Systems, Captel Industries LLP, Zhangjiagang U Tech Machine Co., Ltd., Aoqite Automatic Equipment, OKI, Calmus Machinery.

De Nester And Liner Inserter Market

In the first five-year phase (2025 to 2030), the market expands from USD 1.6 billion to USD 2.1 billion, contributing USD 0.5 billion, which accounts for 41.7% of the total decade’s growth. This period is marked by increasing automation across ready-to-eat food, dairy, and baked goods segments, where precise de-nesting and hygienic liner placement are critical to productivity and food safety compliance.

From 2030 to 2035, the market accelerates from USD 2.1 billion to USD 2.8 billion, contributing USD 0.7 billion, or 58.3% of the total growth. Growth is driven by adoption in automated packaging lines and robotic filling systems across both food and pharmaceutical industries. Modular, servo-driven de-nesters with integrated liner feeders gain traction, supported by the demand for faster changeovers, minimal manual intervention, and compliance with evolving food-contact packaging regulations.

From 2020 to 2024, the de-nester and liner inserters market grew from USD 1.2 billion to USD 1.5 billion, driven by hardware-centric adoption in food packaging, pharma trays, and industrial container lining applications. During this period, the competitive landscape was dominated by equipment manufacturers controlling nearly 70% of total revenue, with leaders such as SEALPAC, Kaupert Marburg, and Chunlai Packing Machinery Co. focusing on precision automation systems for container separation, cup de-nesting, and hygienic liner placement.

Competitive differentiation relied on quick changeovers, format flexibility, and sanitation compliance, while automation software was often bundled within core systems rather than monetized separately. Service-based models such as predictive maintenance and remote monitoring accounted for less than 10% of total market value, as demand remained primarily hardware-driven.

Demand for de-nesters and liner inserters will expand to USD 2.8 billion in 2035, and the revenue mix will shift as digital services and software integration grow to over 40% share. Traditional hardware players face increasing competition from automation-native vendors offering IoT-based productivity dashboards, AI-powered alignment tools, and digital commissioning.

Major manufacturers are transitioning to hybrid models by embedding remote diagnostics, smart calibration, and modular design into their systems. Emerging entrants such as Farmo Res SRL, Millitec Food Systems, Captel Industries LLP, Zhangjiagang U Tech Machine Co., Ltd., Aoqite Automatic Equipment, OKI, and Calmus Machinery are gaining share by specializing in compact, application-specific, and compliance-certified automation. The competitive advantage is moving away from mechanical speed alone to digital adaptability, platform intelligence, and recurring revenue through lifecycle management services.

Why the De-Nester and Liner Inserters Market is growing?

Rising automation in food packaging, bakery, dairy, and ready-to-eat segments is driving the growth of the de-nester and liner inserters market. These machines streamline the process of separating nested containers and inserting liners or papers with speed and precision, enabling high-throughput packaging while ensuring hygiene and product separation. The demand for consistent portion control and reduced manual handling is reinforcing the integration of these systems in production lines.

Servo-driven de-nesters and programmable liner inserters have gained popularity due to their adaptability to various container shapes and sizes. These systems enable accurate placement of liners, films, or pads into trays, cups, and clamshells critical in applications requiring product freshness and contamination control. Their integration into existing conveyors and thermoforming lines enhances operational efficiency and reduces labor dependency.

Industries such as baked goods, processed meat, fresh produce, and convenience meals are driving demand for packaging systems that improve shelf life, protect against leakage, and maintain visual appeal. These machines support sanitary design standards, reduce packaging waste, and increase consistency in high-speed food-grade operations.

Segmental Analysis

The market is segmented by machine type, automation level, liner type, application, end-use industry, and region. Machine type includes cup/bowl de-nester, tray de-nester, and inline liner inserter, each tailored for specific container formats used in food and medical packaging lines. Automation level segmentation comprises semi-automatic and fully automatic systems, offering flexibility based on production scale, labor availability, and integration requirements. By liner type, the market is divided into wax paper, foil, film, and coated paper, addressing different barrier, sealing, and product preservation needs.

Application areas include ready meals, bakery trays, deli cups, and frozen food trays, supporting convenience packaging for perishable and heat-sensitive items. End-use industries include food packaging, industrial catering, and medical packaging, where hygiene, speed, and accuracy are critical operational factors. Regionally, the market is segmented into North America, Europe, Asia-Pacific, and Latin America.
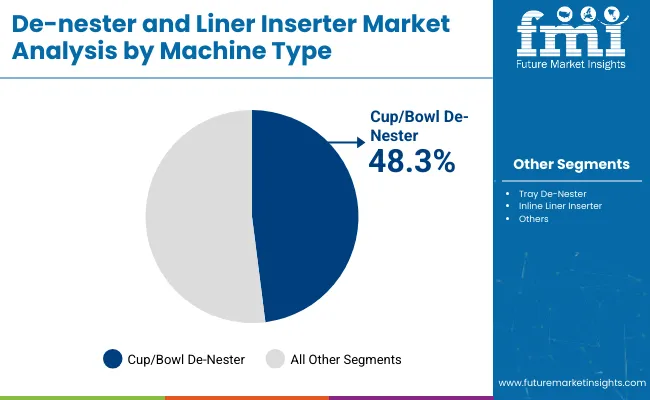
Cup/Bowl De-Nester Segment Dominates Due to High-Speed Automation in Food Lines

De Nester And Liner Inserter Market By Machine

The cup/bowl de-nester segment is expected to account for the highest share of 48.3% in 2025 in the de-nester and liner inserters market. This leadership is attributed to the widespread demand for high-efficiency, servo-controlled de-nesting systems in ready-to-eat and dairy food processing lines. Cup and bowl containers are used extensively across yogurt, dessert, sauces, and instant meal categories, making their rapid separation and positioning critical for minimizing downtime and manual handling.

Modern cup/bowl de-nesters are designed to handle multiple formats and stacking orientations, with vacuum-assisted or mechanical pick systems that ensure gentle handling and accurate placement. As food manufacturers continue investing in modular and flexible packaging lines, the ability of these systems to support quick format changes and high-output operations further solidifies their market position. With hygiene compliance and automation becoming non-negotiable, the segment will maintain dominance across fast-paced food manufacturing environments globally.
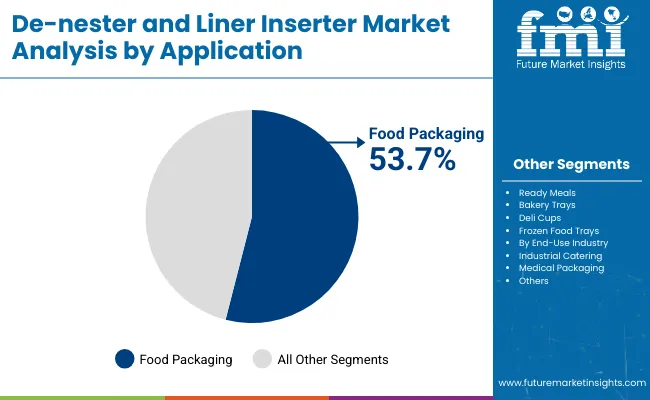
Food Packaging Segment Leads as Automation Enhances Throughput and Hygiene Standards

De Nester And Liner Inserter Market By Application

The food packaging segment is projected to lead the end-use industry category with a 53.7% share in 2025. This dominance is driven by the increasing need for contamination-free and consistent de-nesting and liner placement processes across diverse food applications. Industries such as bakery, frozen meals, dairy, and condiments are rapidly integrating de-nester and liner inserter systems to reduce labor dependency, minimize human contact, and ensure precision in container preparation.

liner inserters play a vital role in maintaining freshness and extending product shelf life, especially for high-value perishables and semi-moist products. The integration of vision-guided robotics, IoT sensors, and hygienic frame designs are also transforming food packaging lines into intelligent systems capable of real-time error correction and performance monitoring. In a sector that prioritizes both speed and safety, automated de-nesting and liner inserting solutions are set to remain foundational technologies throughout the forecast horizon.
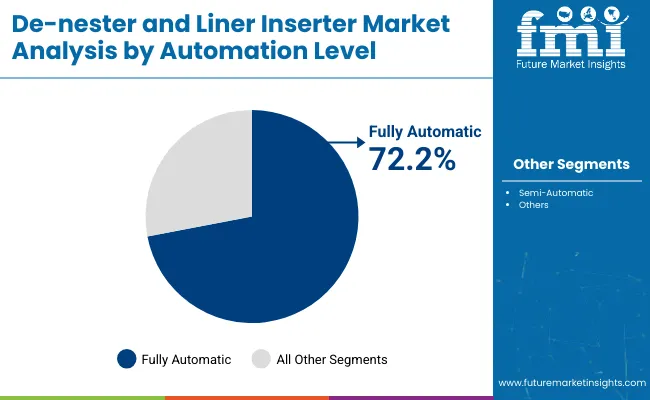
Fully Automatic De-Nesters Capture Majority Share Due to High-Speed Output and Labor Efficiency

De Nester And Liner Inserter Market By Automation

The fully automatic segment is projected to dominate the de-nester and liner inserters market with a 72.2% share in 2025. This leadership stems from rising adoption in high-volume food processing and packaging lines where speed, precision, and labor savings are critical. Fully automatic systems offer seamless integration with conveyor-fed production lines, enabling uninterrupted operations, consistent placement accuracy, and reduced manual intervention factors essential for meeting food safety and hygiene regulations.

These systems are increasingly favored in frozen meals, dairy, bakery, and ready-to-eat packaging due to their ability to handle high SKUs with minimal changeover time.
Wax Paper Liners Preferred for Their Grease Resistance and Sustainability Credentials

De Nester And Liner Inserter Market By Liner

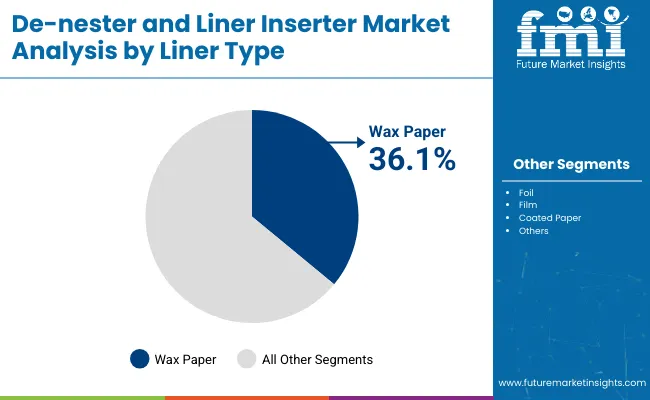
The wax paper liner segment is expected to account for the highest share of 36.1% in 2025. Wax-coated paper liners offer excellent resistance to moisture and grease, making them particularly suitable for food trays used in ready meals, baked goods, and deli items. They are biodegradable, compostable, and align with sustainability mandates driving their uptake in eco-conscious packaging setups across North America and Europe.

Their compatibility with high-speed liner inserters and custom-cut formats further enhances operational convenience.

Ready Meals Segment to Dominate Application Scope Due to High Packaging Volume and Format Standardization

The ready meals application segment is projected to lead with a 38.2% share in 2025. The dominance is driven by the surging demand for convenient, pre-portioned meals amid changing consumer lifestyles, urbanization, and increasing dual-income households. Ready meals require precise and hygienic tray handling and lining, making them a top application area for de-nester and liner inserter technologies.

These systems enable quick de-nesting of uniform trays and fast liner placement, ensuring compliance with food safety standards while supporting high-volume production throughput.

What are the Drivers, Restraints, and Key Trends of the De-Nester and Liner Inserters Market?

Space limitations and changeover inflexibility challenge broader deployment, even as demand rises in food processing, pharmaceutical packaging, and industrial automation for contactless, high-speed container separation and liner insertion that ensure hygiene, sealing integrity, and line efficiency.

Rising Need for Hygienic Automation in Food and Pharma Industries

De-nester and liner inserter systems are increasingly adopted in sectors requiring sterile, high-throughput packaging environments such as ready-meal production, dairy, bakery, pharmaceuticals, and cosmetics. De-nesters automate the separation and placement of stacked containers (cups, trays, tubs) onto conveyor belts, while liner inserters apply protective films or foil membranes to ensure product safety and freshness. These machines reduce labor dependency, enhance cleanliness, and enable consistent output on high-speed lines. In pharmaceuticals, precise liner placement helps meet regulatory standards for tamper-evidence and moisture protection. As global demand rises for pre-filled, portioned, and sealed packaging formats, these machines are becoming integral to modern packaging line automation.

Footprint Constraints and Limited Format Flexibility

Despite their advantages, de-nesters and liner inserters face deployment constraints due to their physical footprint and configuration rigidity. In compact production environments, integrating these machines into existing lines without layout reengineering can be challenging. Many systems are format-specific and require mechanical adjustment or change parts when shifting between container sizes, shapes, or liner types. This limits flexibility for short production runs or multi-SKU operations. The initial investment cost including tooling, maintenance, and line customization can deter small manufacturers or co-packers operating on tight margins. As a result, adoption remains concentrated among high-volume, standardized packaging applications.

Integration with Vision Systems and Modular, Servo-driven Designs

A key trend shaping the market is the transition toward smart, modular systems equipped with servo motors and vision technology. Advanced de-nesters now use camera-guided alignment to ensure accurate pick-and-place of irregularly shaped or transparent containers, while liner inserters are evolving with real-time feedback to verify placement accuracy and seal uniformity. Servo-driven components reduce mechanical wear and enable smoother format transitions. Modular configurations allow easy scaling or replacement of sub-units, supporting agile production strategies. As demand for quality assurance, contamination control, and flexible automation intensifies, de-nester and liner inserter systems are being redesigned to align with smart factory and Industry 4.0 standards.
Analysis of De-Nester and Liner Inserters Market by Key Countries

De Nester And Liner Inserter Market By Country

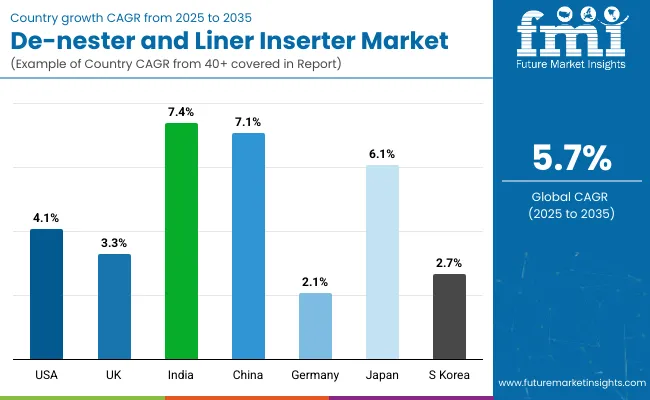
The global de-nester and liner inserters market is expanding steadily due to increasing automation across foodservice packaging, pharmaceuticals, industrial pails, and rigid containers. The shift toward hygienic, touch-free, and high-speed operations in filling lines is driving demand for these machines. Asia-Pacific is leading the growth curve with India, China, and Japan investing heavily in automation to support FMCG and food export logistics. In contrast, developed economies such as the USA, UK, and Germany are focused on system upgrades, line retrofits, and labor cost optimization. Liner inserters are increasingly integrated with robotic arms, vision systems, and adaptive tooling to reduce downtime and increase throughput.

Sales Outlook for De-Nester and Liner Inserters in the United States

The de-nester and liner inserters market in the United States is forecast to grow at a CAGR of 4.1% between 2025 and 2035. Demand is driven by industrial-scale food processors, rigid packaging converters, and pharmaceutical filling lines prioritizing automation and contamination control. Manufacturers are investing in robotic de-nesting with auto-adjusting arms and vacuum-based liner inserters to minimize manual handling.

  • Meal tray packaging and dairy lines are integrating high-speed de-nesting systems.
  • Pharma lines are inserting induction-seal liners in HDPE and PET containers for tamper evidence.
  • Industrial pail manufacturers are adopting liner inserters for bulk packaging of adhesives and chemicals.

Growth and Expansion Outlook for De-Nester and Liner Inserters in the United Kingdom

The de-nester and liner inserters market in the United Kingdom is projected to grow at a CAGR of 3.3%, supported by automation upgrades in food trays, personal care containers, and e-commerce-ready packaging. British firms are replacing legacy pick-and-place systems with vision-guided de-nesters and programmable liner applicators to reduce packaging waste and labor reliance.

  • Ready-meal manufacturers are adopting modular de-nesters for multi-compartment trays.
  • Liner inserters are being used in cosmetic jar filling for leak protection and product longevity.
  • Online brands are retrofitting automation cells with liner systems to scale SKUs efficiently.

Growth and Expansion Outlook for De-Nester and Liner Inserters in India

India’s de-nester and liner inserters market is forecast to grow at a CAGR of 7.4%, the highest globally. Rapid industrialization, growth in packaged foods, and hygiene mandates in pharmaceuticals are key drivers. Indian packaging lines are increasingly automating container handling for dairy cups, PET jars, and laminated pouches. Affordable, scalable machine designs by local OEMs are enabling broader access to automation.

  • Foodservice operators are investing in automated de-nesting for portion packs and bakery trays.
  • Nutraceutical brands are inserting foil liners to protect against oxidation in capsule jars.
  • Regional OEMs are offering compact, servo-driven systems for high-volume lines.

Sales Outlook for De-Nester and Liner Inserters in China

The de-nester and liner inserters market in China is projected to grow at a CAGR of 7.1%, supported by large-scale production of instant meals, dairy products, and household goods. The growing middle class, urban meal prep trends, and food exports are triggering automation across primary packaging lines. Domestic machinery companies are introducing inline de-nesting with liner roll feeds for minimal operator intervention.

  • Dairy cup filling lines are integrating roll-fed liner inserters with tamper-evident heat seals.
  • Takeaway meal packers are using de-nesters for compartment trays and heat-seal lids.
  • Chinese OEMs are bundling de-nester + liner inserter combos with robotic case packers.

In-depth Analysis of De-Nester and Liner Inserters in Germany

Germany’s de-nester and liner inserters market is expected to grow at a CAGR of 2.1%, driven by established automation maturity and regulatory requirements for hygienic primary packaging. German manufacturers are refining liner insertion precision through real-time sensor calibration and incorporating auto-cleaning modules for pharmaceutical GMP compliance. Adoption is focused on efficiency gains and production flexibility.

  • Pharma manufacturers are using liner systems for HDPE containers with humidity-sensitive content.
  • Bakery and dairy brands are employing adjustable de-nesters for multi-format trays.
  • German OEMs are launching liner units compatible with post-consumer recyclable materials.

Growth Outlook for De-Nester and Liner Inserters in Japan

Japan’s de-nester and liner inserters market is projected to grow at a CAGR of 6.1%, fueled by demand for cleanroom-compatible automation in clinical nutrition, premium ready meals, and export-focused cosmetic packaging. Japanese manufacturers prefer minimalistic, high-efficiency machines capable of precision tray orientation and contamination-free liner placement.

  • Clinical food and nutritional supplement lines are automating pre-fill liner insertion in PET containers.
  • Meal kits are using high-speed tray de-nesters to streamline seasonal product lines.
  • OEMs are offering modular automation for small-batch liner requirements in pharma SKUs.

Opportunity Analysis of South Korea De-Nester and Liner Inserters Market

The de-nester and liner inserters market in South Korea is projected to grow at a CAGR of 2.7%, supported by smart factory initiatives and the rise of clean-label packaging in beauty, food, and pharma. While adoption remains moderate in smaller plants, demand is increasing for hygienic, inline-ready machines that support compact operations and frequent SKU changeovers.

  • Beauty and skincare brands are using liner inserters for functional caps and tamper-evident closures.
  • Convenience food players are investing in tray de-nesting with integrated seal detection.
  • Smart factories are retrofitting liner systems with AI-driven reject handling and uptime dashboards.

Competitive Landscape of De-Nester and Liner Inserters Market

The de-nester and liner inserters market is moderately fragmented, with global automation leaders, food-grade equipment manufacturers, and regional machine builders competing across food processing, pharmaceutical, and industrial packaging lines. Global players such as SEALPAC, Kaupert Marburg (Germany), and OKI hold significant market share, driven by high-speed de-nesting accuracy, hygienic design standards, and inline integration with thermoforming and filling systems. Their strategies increasingly emphasize washdown compatibility, format versatility, and smart servo-driven motion control for trays, cups, and thermoformed cavities.

Established mid-sized companies such as Chunlai Packing Machinery Co. (China), Farmo Res SRL (Italy), and Millitec Food Systems (Australia) support automated packaging throughput by offering modular de-nester heads, robotic pick-and-place inserters, and multi-format liner applicators. These companies are accelerating adoption in mid-scale food, bakery, and dairy plants through quick-changeover tooling and CE/GMP compliant architecture.

Specialized regional providers including Captel Industries LLP (India), Zhangjiagang U Tech Machine Co., Ltd., Aoqite Automatic Equipment (China), and Calmus Machinery focus on cost-effective, application-specific solutions tailored for disposable food containers, ready-meal trays, and industrial component liners. Their strength lies in offering localized support, customizable feed mechanisms, and scalable automation for regional converters and co-packers.

Competitive differentiation is shifting away from basic mechanical handling systems toward integrated robotic de-nesting and liner feeding ecosystems that offer IoT-based fault monitoring, multi-lane synchronization, and tool-less changeover flexibility tailored to hygiene-critical and fast-paced production environments.

Key Development of De-Nester and Liner Inserters Market

  • March 2025, SEALPAC introduced new high-efficiency packaging technology during IFFA 2025 trade show preparations, including innovations in traysealers and thermoformers that support denesting and liner-inserting workflows.
  • June 2025, Farmo Res at Pharmintech Ipack-Ima 2025, innovation, technology, and valuable partnerships. Farmo Res proudly participated in the 2025 edition of Pharmintech Ipack-Ima, one of the most important international events dedicated to pharmaceutical packaging. Pharmintech at Ipack-Ima in Milan, confirms itself as a very significant meeting point for industry professionals, companies and innovators.

De-Nester and Liner Inserters Companies

  • SEALPAC
  • Kaupert Marburg
  • Chunlai Packing Machinery Co.
  • Farmo Res SRL
  • Millitec Food Systems
  • Captel Industries LLP
  • Zhangjiagang U Tech Machine Co.,Ltd
  • Aoqite Automatic Equipment
  • OKI
  • Calmus machinery

Segmentation

By Machine Type:

  • Cup/Bowl De-Nester
  • Tray De-Nester
  • Inline Liner Inserter

By Automation Level:

  • Semi-Automatic
  • Fully Automatic

By Liner Type:

  • Wax Paper
  • Foil
  • Film
  • Coated Paper

By Application:

  • Ready Meals
  • Bakery Trays
  • Deli Cups
  • Frozen Food Trays
  • By End-Use Industry
  • Food Packaging
  • Industrial Catering
  • Medical Packaging

By Region:

  • North America
  • Europe
  • Asia-Pacific
  • Latin America
  • Middle East and Africa

Table of Content

  1. Executive Summary
    • Global Market Outlook
    • Demand-side Trends
    • Supply-side Trends
    • Technology Roadmap Analysis
    • Analysis and Recommendations
  2. Market Overview
    • Market Coverage / Taxonomy
    • Market Definition / Scope / Limitations
  3. Market Background
    • Market Dynamics
      • Drivers
      • Restraints
      • Opportunity
      • Trends
    • Scenario Forecast
      • Demand in Optimistic Scenario
      • Demand in Likely Scenario
      • Demand in Conservative Scenario
    • Opportunity Map Analysis
    • Product Life Cycle Analysis
    • Supply Chain Analysis
      • Supply Side Participants and their Roles
        • Producers
        • Mid-Level Participants (Traders/ Agents/ Brokers)
        • Wholesalers and Distributors
      • Value Added and Value Created at Node in the Supply Chain
      • List of Raw Material Suppliers
      • List of Existing and Potential Buyer’s
    • Investment Feasibility Matrix
    • Value Chain Analysis
      • Profit Margin Analysis
      • Wholesalers and Distributors
      • Retailers
    • PESTLE and Porter’s Analysis
    • Regulatory Landscape
      • By Key Regions
      • By Key Countries
    • Regional Parent Market Outlook
    • Production and Consumption Statistics
    • Import and Export Statistics
  4. Global De-Nester & Liner Inserters Analysis 2020-2024 and Forecast, 2025-2035
    • Historical Market Size Value (USD Million) & Volume (Units) Analysis, 2020-2024
    • Current and Future Market Size Value (USD Million) & Volume (Units) Projections, 2025-2035
      • Y-o-Y Growth Trend Analysis
      • Absolute $ Opportunity Analysis
  5. Global De-Nester & Liner Inserters Pricing Analysis 2020-2024 and Forecast 2025-2035
  6. Global De-Nester & Liner Inserters Analysis 2020-2024 and Forecast 2025-2035, By By Machine Type
    • Introduction / Key Findings
    • Historical Market Size Value (USD Million) & Volume (Units) Analysis By By Machine Type, 2020-2024
    • Current and Future Market Size Value (USD Million) & Volume (Units) Analysis and Forecast By By Machine Type, 2025-2035
      • Cup/Bowl De-Nester
      • Tray De-Nester
      • Inline Liner Inserter
    • Y-o-Y Growth Trend Analysis By By Machine Type, 2020-2024
    • Absolute $ Opportunity Analysis By By Machine Type, 2025-2035
  7. Global De-Nester & Liner Inserters Analysis 2020-2024 and Forecast 2025-2035, By By Automation Level
    • Introduction / Key Findings
    • Historical Market Size Value (USD Million) & Volume (Units) Analysis By By Automation Level, 2020-2024
    • Current and Future Market Size Value (USD Million) & Volume (Units) Analysis and Forecast By By Automation Level, 2025-2035
      • Semi-Automatic
      • Fully Automatic
    • Y-o-Y Growth Trend Analysis By By Automation Level, 2020-2024
    • Absolute $ Opportunity Analysis By By Automation Level, 2025-2035
  8. Global De-Nester & Liner Inserters Analysis 2020-2024 and Forecast 2025-2035, By By Liner Type
    • Introduction / Key Findings
    • Historical Market Size Value (USD Million) & Volume (Units) Analysis By By Liner Type, 2020-2024
    • Current and Future Market Size Value (USD Million) & Volume (Units) Analysis and Forecast By By Liner Type, 2025-2035
      • Wax Paper
      • Foil
      • Film
      • Coated Paper
    • Y-o-Y Growth Trend Analysis By By Liner Type, 2020-2024
    • Absolute $ Opportunity Analysis By By Liner Type, 2025-2035
  9. Global De-Nester & Liner Inserters Analysis 2020-2024 and Forecast 2025-2035, By By Application
    • Introduction / Key Findings
    • Historical Market Size Value (USD Million) & Volume (Units) Analysis By By Application, 2020-2024
    • Current and Future Market Size Value (USD Million) & Volume (Units) Analysis and Forecast By By Application, 2025-2035
      • Ready Meals
      • Bakery Trays
      • Deli Cups
      • Frozen Food Trays
    • Y-o-Y Growth Trend Analysis By By Application, 2020-2024
    • Absolute $ Opportunity Analysis By By Application, 2025-2035
  10. Global De-Nester & Liner Inserters Analysis 2020-2024 and Forecast 2025-2035, By By End-Use Industry
    • Introduction / Key Findings
    • Historical Market Size Value (USD Million) & Volume (Units) Analysis By By End-Use Industry, 2020-2024
    • Current and Future Market Size Value (USD Million) & Volume (Units) Analysis and Forecast By By End-Use Industry, 2025-2035
      • Food Packaging
      • Industrial Catering
      • Medical Packaging
    • Y-o-Y Growth Trend Analysis By By End-Use Industry, 2020-2024
    • Absolute $ Opportunity Analysis By By End-Use Industry, 2025-2035
  11. Global De-Nester & Liner Inserters Analysis 2020-2024 and Forecast 2025-2035, By Region
    • Introduction
    • Historical Market Size Value (USD Million) & Volume (Units) Analysis By Region, 2020-2024
    • Current Market Size Value (USD Million) & Volume (Units) Analysis and Forecast By Region, 2025-2035
      • North America
      • Latin America
      • Europe
      • East Asia
      • South Asia
      • Oceania
      • MEA
    • Market Attractiveness Analysis By Region
  12. North America De-Nester & Liner Inserters Analysis 2020-2024 and Forecast 2025-2035, By Country
    • Historical Market Size Value (USD Million) & Volume (Units) Trend Analysis By Market Taxonomy, 2020-2024
    • Market Size Value (USD Million) & Volume (Units) Forecast By Market Taxonomy, 2025-2035
      • By Country
        • USA
        • Canada
      • By By Machine Type
      • By By Automation Level
      • By By Liner Type
      • By By Application
      • By By End-Use Industry
    • Market Attractiveness Analysis
      • By Country
      • By By Machine Type
      • By By Automation Level
      • By By Liner Type
      • By By Application
      • By By End-Use Industry
    • Key Takeaways
  13. Latin America De-Nester & Liner Inserters Analysis 2020-2024 and Forecast 2025-2035, By Country
    • Historical Market Size Value (USD Million) & Volume (Units) Trend Analysis By Market Taxonomy, 2020-2024
    • Market Size Value (USD Million) & Volume (Units) Forecast By Market Taxonomy, 2025-2035
      • By Country
        • Brazil
        • Mexico
        • Argentina
        • Chile
        • Peru
        • Rest of Latin America
      • By By Machine Type
      • By By Automation Level
      • By By Liner Type
      • By By Application
      • By By End-Use Industry
    • Market Attractiveness Analysis
      • By Country
      • By By Machine Type
      • By By Automation Level
      • By By Liner Type
      • By By Application
      • By By End-Use Industry
    • Key Takeaways
  14. Europe De-Nester & Liner Inserters Analysis 2020-2024 and Forecast 2025-2035, By Country
    • Historical Market Size Value (USD Million) & Volume (Units) Trend Analysis By Market Taxonomy, 2020-2024
    • Market Size Value (USD Million) & Volume (Units) Forecast By Market Taxonomy, 2025-2035
      • By Country
        • Germany
        • Italy
        • France
        • U.K.
        • Spain
        • Russia
        • BENELUX
        • Rest of Europe
      • By By Machine Type
      • By By Automation Level
      • By By Liner Type
      • By By Application
      • By By End-Use Industry
    • Market Attractiveness Analysis
      • By Country
      • By By Machine Type
      • By By Automation Level
      • By By Liner Type
      • By By Application
      • By By End-Use Industry
    • Key Takeaways
  15. East Asia De-Nester & Liner Inserters Analysis 2020-2024 and Forecast 2025-2035, By Country
    • Historical Market Size Value (USD Million) & Volume (Units) Trend Analysis By Market Taxonomy, 2020-2024
    • Market Size Value (USD Million) & Volume (Units) Forecast By Market Taxonomy, 2025-2035
      • By Country
        • China
        • Japan
        • South Korea
      • By By Machine Type
      • By By Automation Level
      • By By Liner Type
      • By By Application
      • By By End-Use Industry
    • Market Attractiveness Analysis
      • By Country
      • By By Machine Type
      • By By Automation Level
      • By By Liner Type
      • By By Application
      • By By End-Use Industry
    • Key Takeaways
  16. South Asia De-Nester & Liner Inserters Analysis 2020-2024 and Forecast 2025-2035, By Country
    • Historical Market Size Value (USD Million) & Volume (Units) Trend Analysis By Market Taxonomy, 2020-2024
    • Market Size Value (USD Million) & Volume (Units) Forecast By Market Taxonomy, 2025-2035
      • By Country
        • India
        • Thailand
        • Malaysia
        • Indonesia
        • Rest of South Asia
      • By By Machine Type
      • By By Automation Level
      • By By Liner Type
      • By By Application
      • By By End-Use Industry
    • Market Attractiveness Analysis
      • By Country
      • By By Machine Type
      • By By Automation Level
      • By By Liner Type
      • By By Application
      • By By End-Use Industry
    • Key Takeaways
  17. Oceania De-Nester & Liner Inserters Analysis 2020-2024 and Forecast 2025-2035, By Country
    • Historical Market Size Value (USD Million) & Volume (Units) Trend Analysis By Market Taxonomy, 2020-2024
    • Market Size Value (USD Million) & Volume (Units) Forecast By Market Taxonomy, 2025-2035
      • By Country
        • Australia
        • New Zealand
      • By By Machine Type
      • By By Automation Level
      • By By Liner Type
      • By By Application
      • By By End-Use Industry
    • Market Attractiveness Analysis
      • By Country
      • By By Machine Type
      • By By Automation Level
      • By By Liner Type
      • By By Application
      • By By End-Use Industry
    • Key Takeaways
  18. MEA De-Nester & Liner Inserters Analysis 2020-2024 and Forecast 2025-2035, By Country
    • Historical Market Size Value (USD Million) & Volume (Units) Trend Analysis By Market Taxonomy, 2020-2024
    • Market Size Value (USD Million) & Volume (Units) Forecast By Market Taxonomy, 2025-2035
      • By Country
        • GCC
        • Rest of MEA
      • By By Machine Type
      • By By Automation Level
      • By By Liner Type
      • By By Application
      • By By End-Use Industry
    • Market Attractiveness Analysis
      • By Country
      • By By Machine Type
      • By By Automation Level
      • By By Liner Type
      • By By Application
      • By By End-Use Industry
    • Key Takeaways
  19. Key Countries De-Nester & Liner Inserters Analysis
    • USA
      • Pricing Analysis
      • Market Share Analysis, 2024
        • By By Machine Type
        • By By Automation Level
        • By By Liner Type
        • By By Application
        • By By End-Use Industry
    • Canada
      • Pricing Analysis
      • Market Share Analysis, 2024
        • By By Machine Type
        • By By Automation Level
        • By By Liner Type
        • By By Application
        • By By End-Use Industry
    • Brazil
      • Pricing Analysis
      • Market Share Analysis, 2024
        • By By Machine Type
        • By By Automation Level
        • By By Liner Type
        • By By Application
        • By By End-Use Industry
    • Mexico
      • Pricing Analysis
      • Market Share Analysis, 2024
        • By By Machine Type
        • By By Automation Level
        • By By Liner Type
        • By By Application
        • By By End-Use Industry
    • Argentina
      • Pricing Analysis
      • Market Share Analysis, 2024
        • By By Machine Type
        • By By Automation Level
        • By By Liner Type
        • By By Application
        • By By End-Use Industry
  20. Market Structure Analysis
    • Competition Dashboard
    • Competition Benchmarking
    • Market Share Analysis of Top Players
      • By Regional
      • By By Machine Type
      • By By Automation Level
      • By By Liner Type
      • By By Application
      • By By End-Use Industry
  21. Competition Analysis
    • Competition Deep Dive
      • SEALPAC
        • Overview
        • Product Portfolio
        • Profitability by Market Segments (Product/Age /Sales Channel/Region)
        • Sales Footprint
        • Strategy Overview
          • Marketing Strategy
          • Product Strategy
          • Channel Strategy
      • Kaupert Marburg (Germany)
        • Overview
        • Product Portfolio
        • Profitability by Market Segments (Product/Age /Sales Channel/Region)
        • Sales Footprint
        • Strategy Overview
          • Marketing Strategy
          • Product Strategy
          • Channel Strategy
      • Chunlai Packing Machinery Co. (China)
        • Overview
        • Product Portfolio
        • Profitability by Market Segments (Product/Age /Sales Channel/Region)
        • Sales Footprint
        • Strategy Overview
          • Marketing Strategy
          • Product Strategy
          • Channel Strategy
      • Farmo Res SRL (Italy)
        • Overview
        • Product Portfolio
        • Profitability by Market Segments (Product/Age /Sales Channel/Region)
        • Sales Footprint
        • Strategy Overview
          • Marketing Strategy
          • Product Strategy
          • Channel Strategy
      • Millitec Food Systems (Australia)
        • Overview
        • Product Portfolio
        • Profitability by Market Segments (Product/Age /Sales Channel/Region)
        • Sales Footprint
        • Strategy Overview
          • Marketing Strategy
          • Product Strategy
          • Channel Strategy
      • Captel Industries LLP (India)
        • Overview
        • Product Portfolio
        • Profitability by Market Segments (Product/Age /Sales Channel/Region)
        • Sales Footprint
        • Strategy Overview
          • Marketing Strategy
          • Product Strategy
          • Channel Strategy
      • Zhangjiagang U Tech Machine Co.,Ltd
        • Overview
        • Product Portfolio
        • Profitability by Market Segments (Product/Age /Sales Channel/Region)
        • Sales Footprint
        • Strategy Overview
          • Marketing Strategy
          • Product Strategy
          • Channel Strategy
      • Aoqite Automatic Equipment (China)
        • Overview
        • Product Portfolio
        • Profitability by Market Segments (Product/Age /Sales Channel/Region)
        • Sales Footprint
        • Strategy Overview
          • Marketing Strategy
          • Product Strategy
          • Channel Strategy
      • OKI
        • Overview
        • Product Portfolio
        • Profitability by Market Segments (Product/Age /Sales Channel/Region)
        • Sales Footprint
        • Strategy Overview
          • Marketing Strategy
          • Product Strategy
          • Channel Strategy
      • Calmus machinery
        • Overview
        • Product Portfolio
        • Profitability by Market Segments (Product/Age /Sales Channel/Region)
        • Sales Footprint
        • Strategy Overview
          • Marketing Strategy
          • Product Strategy
          • Channel Strategy
  22. Assumptions & Acronyms Used
  23. Research Methodology

List of Tables

  • Table 1: Global Value (USD Million) Forecast by Region, 2020-2035
  • Table 2: Global Volume (Units) Forecast by Region, 2020-2035
  • Table 3: Global Value (USD Million) Forecast by By Machine Type, 2020-2035
  • Table 4: Global Volume (Units) Forecast by By Machine Type, 2020-2035
  • Table 5: Global Value (USD Million) Forecast by By Automation Level, 2020-2035
  • Table 6: Global Volume (Units) Forecast by By Automation Level, 2020-2035
  • Table 7: Global Value (USD Million) Forecast by By Liner Type, 2020-2035
  • Table 8: Global Volume (Units) Forecast by By Liner Type, 2020-2035
  • Table 9: Global Value (USD Million) Forecast by By Application, 2020-2035
  • Table 10: Global Volume (Units) Forecast by By Application, 2020-2035
  • Table 11: Global Value (USD Million) Forecast by By End-Use Industry, 2020-2035
  • Table 12: Global Volume (Units) Forecast by By End-Use Industry, 2020-2035
  • Table 13: North America Value (USD Million) Forecast by Country, 2020-2035
  • Table 14: North America Volume (Units) Forecast by Country, 2020-2035
  • Table 15: North America Value (USD Million) Forecast by By Machine Type, 2020-2035
  • Table 16: North America Volume (Units) Forecast by By Machine Type, 2020-2035
  • Table 17: North America Value (USD Million) Forecast by By Automation Level, 2020-2035
  • Table 18: North America Volume (Units) Forecast by By Automation Level, 2020-2035
  • Table 19: North America Value (USD Million) Forecast by By Liner Type, 2020-2035
  • Table 20: North America Volume (Units) Forecast by By Liner Type, 2020-2035
  • Table 21: North America Value (USD Million) Forecast by By Application, 2020-2035
  • Table 22: North America Volume (Units) Forecast by By Application, 2020-2035
  • Table 23: North America Value (USD Million) Forecast by By End-Use Industry, 2020-2035
  • Table 24: North America Volume (Units) Forecast by By End-Use Industry, 2020-2035
  • Table 25: Latin America Value (USD Million) Forecast by Country, 2020-2035
  • Table 26: Latin America Volume (Units) Forecast by Country, 2020-2035
  • Table 27: Latin America Value (USD Million) Forecast by By Machine Type, 2020-2035
  • Table 28: Latin America Volume (Units) Forecast by By Machine Type, 2020-2035
  • Table 29: Latin America Value (USD Million) Forecast by By Automation Level, 2020-2035
  • Table 30: Latin America Volume (Units) Forecast by By Automation Level, 2020-2035
  • Table 31: Latin America Value (USD Million) Forecast by By Liner Type, 2020-2035
  • Table 32: Latin America Volume (Units) Forecast by By Liner Type, 2020-2035
  • Table 33: Latin America Value (USD Million) Forecast by By Application, 2020-2035
  • Table 34: Latin America Volume (Units) Forecast by By Application, 2020-2035
  • Table 35: Latin America Value (USD Million) Forecast by By End-Use Industry, 2020-2035
  • Table 36: Latin America Volume (Units) Forecast by By End-Use Industry, 2020-2035
  • Table 37: Europe Value (USD Million) Forecast by Country, 2020-2035
  • Table 38: Europe Volume (Units) Forecast by Country, 2020-2035
  • Table 39: Europe Value (USD Million) Forecast by By Machine Type, 2020-2035
  • Table 40: Europe Volume (Units) Forecast by By Machine Type, 2020-2035
  • Table 41: Europe Value (USD Million) Forecast by By Automation Level, 2020-2035
  • Table 42: Europe Volume (Units) Forecast by By Automation Level, 2020-2035
  • Table 43: Europe Value (USD Million) Forecast by By Liner Type, 2020-2035
  • Table 44: Europe Volume (Units) Forecast by By Liner Type, 2020-2035
  • Table 45: Europe Value (USD Million) Forecast by By Application, 2020-2035
  • Table 46: Europe Volume (Units) Forecast by By Application, 2020-2035
  • Table 47: Europe Value (USD Million) Forecast by By End-Use Industry, 2020-2035
  • Table 48: Europe Volume (Units) Forecast by By End-Use Industry, 2020-2035
  • Table 49: East Asia Value (USD Million) Forecast by Country, 2020-2035
  • Table 50: East Asia Volume (Units) Forecast by Country, 2020-2035
  • Table 51: East Asia Value (USD Million) Forecast by By Machine Type, 2020-2035
  • Table 52: East Asia Volume (Units) Forecast by By Machine Type, 2020-2035
  • Table 53: East Asia Value (USD Million) Forecast by By Automation Level, 2020-2035
  • Table 54: East Asia Volume (Units) Forecast by By Automation Level, 2020-2035
  • Table 55: East Asia Value (USD Million) Forecast by By Liner Type, 2020-2035
  • Table 56: East Asia Volume (Units) Forecast by By Liner Type, 2020-2035
  • Table 57: East Asia Value (USD Million) Forecast by By Application, 2020-2035
  • Table 58: East Asia Volume (Units) Forecast by By Application, 2020-2035
  • Table 59: East Asia Value (USD Million) Forecast by By End-Use Industry, 2020-2035
  • Table 60: East Asia Volume (Units) Forecast by By End-Use Industry, 2020-2035
  • Table 61: South Asia Value (USD Million) Forecast by Country, 2020-2035
  • Table 62: South Asia Volume (Units) Forecast by Country, 2020-2035
  • Table 63: South Asia Value (USD Million) Forecast by By Machine Type, 2020-2035
  • Table 64: South Asia Volume (Units) Forecast by By Machine Type, 2020-2035
  • Table 65: South Asia Value (USD Million) Forecast by By Automation Level, 2020-2035
  • Table 66: South Asia Volume (Units) Forecast by By Automation Level, 2020-2035
  • Table 67: South Asia Value (USD Million) Forecast by By Liner Type, 2020-2035
  • Table 68: South Asia Volume (Units) Forecast by By Liner Type, 2020-2035
  • Table 69: South Asia Value (USD Million) Forecast by By Application, 2020-2035
  • Table 70: South Asia Volume (Units) Forecast by By Application, 2020-2035
  • Table 71: South Asia Value (USD Million) Forecast by By End-Use Industry, 2020-2035
  • Table 72: South Asia Volume (Units) Forecast by By End-Use Industry, 2020-2035
  • Table 73: Oceania Value (USD Million) Forecast by Country, 2020-2035
  • Table 74: Oceania Volume (Units) Forecast by Country, 2020-2035
  • Table 75: Oceania Value (USD Million) Forecast by By Machine Type, 2020-2035
  • Table 76: Oceania Volume (Units) Forecast by By Machine Type, 2020-2035
  • Table 77: Oceania Value (USD Million) Forecast by By Automation Level, 2020-2035
  • Table 78: Oceania Volume (Units) Forecast by By Automation Level, 2020-2035
  • Table 79: Oceania Value (USD Million) Forecast by By Liner Type, 2020-2035
  • Table 80: Oceania Volume (Units) Forecast by By Liner Type, 2020-2035
  • Table 81: Oceania Value (USD Million) Forecast by By Application, 2020-2035
  • Table 82: Oceania Volume (Units) Forecast by By Application, 2020-2035
  • Table 83: Oceania Value (USD Million) Forecast by By End-Use Industry, 2020-2035
  • Table 84: Oceania Volume (Units) Forecast by By End-Use Industry, 2020-2035
  • Table 85: MEA Value (USD Million) Forecast by Country, 2020-2035
  • Table 86: MEA Volume (Units) Forecast by Country, 2020-2035
  • Table 87: MEA Value (USD Million) Forecast by By Machine Type, 2020-2035
  • Table 88: MEA Volume (Units) Forecast by By Machine Type, 2020-2035
  • Table 89: MEA Value (USD Million) Forecast by By Automation Level, 2020-2035
  • Table 90: MEA Volume (Units) Forecast by By Automation Level, 2020-2035
  • Table 91: MEA Value (USD Million) Forecast by By Liner Type, 2020-2035
  • Table 92: MEA Volume (Units) Forecast by By Liner Type, 2020-2035
  • Table 93: MEA Value (USD Million) Forecast by By Application, 2020-2035
  • Table 94: MEA Volume (Units) Forecast by By Application, 2020-2035
  • Table 95: MEA Value (USD Million) Forecast by By End-Use Industry, 2020-2035
  • Table 96: MEA Volume (Units) Forecast by By End-Use Industry, 2020-2035

List of Figures

  • Figure 1: Global Volume (Units) Forecast 2020-2035
  • Figure 2: Global Pricing Analysis
  • Figure 3: Global Value (USD Million) Forecast 2020-2035
  • Figure 4: Global Value Share and BPS Analysis by By Machine Type, 2025 and 2035
  • Figure 5: Global Y-o-Y Growth Comparison by By Machine Type, 2025-2035
  • Figure 6: Global Attractiveness Analysis by By Machine Type
  • Figure 7: Global Value Share and BPS Analysis by By Automation Level, 2025 and 2035
  • Figure 8: Global Y-o-Y Growth Comparison by By Automation Level, 2025-2035
  • Figure 9: Global Attractiveness Analysis by By Automation Level
  • Figure 10: Global Value Share and BPS Analysis by By Liner Type, 2025 and 2035
  • Figure 11: Global Y-o-Y Growth Comparison by By Liner Type, 2025-2035
  • Figure 12: Global Attractiveness Analysis by By Liner Type
  • Figure 13: Global Value Share and BPS Analysis by By Application, 2025 and 2035
  • Figure 14: Global Y-o-Y Growth Comparison by By Application, 2025-2035
  • Figure 15: Global Attractiveness Analysis by By Application
  • Figure 16: Global Value Share and BPS Analysis by By End-Use Industry, 2025 and 2035
  • Figure 17: Global Y-o-Y Growth Comparison by By End-Use Industry, 2025-2035
  • Figure 18: Global Attractiveness Analysis by By End-Use Industry
  • Figure 19: Global Value (USD Million) Share and BPS Analysis by Region, 2025 and 2035
  • Figure 20: Global Y-o-Y Growth Comparison by Region, 2025-2035
  • Figure 21: Global Attractiveness Analysis by Region
  • Figure 22: North America Incremental $ Opportunity, 2025-2035
  • Figure 23: Latin America Incremental $ Opportunity, 2025-2035
  • Figure 24: Europe Incremental $ Opportunity, 2025-2035
  • Figure 25: East Asia Incremental $ Opportunity, 2025-2035
  • Figure 26: South Asia Incremental $ Opportunity, 2025-2035
  • Figure 27: Oceania Incremental $ Opportunity, 2025-2035
  • Figure 28: MEA Incremental $ Opportunity, 2025-2035
  • Figure 29: North America Value Share and BPS Analysis by Country, 2025 and 2035
  • Figure 30: North America Value Share and BPS Analysis by By Machine Type, 2025 and 2035
  • Figure 31: North America Y-o-Y Growth Comparison by By Machine Type, 2025-2035
  • Figure 32: North America Attractiveness Analysis by By Machine Type
  • Figure 33: North America Value Share and BPS Analysis by By Automation Level, 2025 and 2035
  • Figure 34: North America Y-o-Y Growth Comparison by By Automation Level, 2025-2035
  • Figure 35: North America Attractiveness Analysis by By Automation Level
  • Figure 36: North America Value Share and BPS Analysis by By Liner Type, 2025 and 2035
  • Figure 37: North America Y-o-Y Growth Comparison by By Liner Type, 2025-2035
  • Figure 38: North America Attractiveness Analysis by By Liner Type
  • Figure 39: North America Value Share and BPS Analysis by By Application, 2025 and 2035
  • Figure 40: North America Y-o-Y Growth Comparison by By Application, 2025-2035
  • Figure 41: North America Attractiveness Analysis by By Application
  • Figure 42: North America Value Share and BPS Analysis by By End-Use Industry, 2025 and 2035
  • Figure 43: North America Y-o-Y Growth Comparison by By End-Use Industry, 2025-2035
  • Figure 44: North America Attractiveness Analysis by By End-Use Industry
  • Figure 45: Latin America Value Share and BPS Analysis by Country, 2025 and 2035
  • Figure 46: Latin America Value Share and BPS Analysis by By Machine Type, 2025 and 2035
  • Figure 47: Latin America Y-o-Y Growth Comparison by By Machine Type, 2025-2035
  • Figure 48: Latin America Attractiveness Analysis by By Machine Type
  • Figure 49: Latin America Value Share and BPS Analysis by By Automation Level, 2025 and 2035
  • Figure 50: Latin America Y-o-Y Growth Comparison by By Automation Level, 2025-2035
  • Figure 51: Latin America Attractiveness Analysis by By Automation Level
  • Figure 52: Latin America Value Share and BPS Analysis by By Liner Type, 2025 and 2035
  • Figure 53: Latin America Y-o-Y Growth Comparison by By Liner Type, 2025-2035
  • Figure 54: Latin America Attractiveness Analysis by By Liner Type
  • Figure 55: Latin America Value Share and BPS Analysis by By Application, 2025 and 2035
  • Figure 56: Latin America Y-o-Y Growth Comparison by By Application, 2025-2035
  • Figure 57: Latin America Attractiveness Analysis by By Application
  • Figure 58: Latin America Value Share and BPS Analysis by By End-Use Industry, 2025 and 2035
  • Figure 59: Latin America Y-o-Y Growth Comparison by By End-Use Industry, 2025-2035
  • Figure 60: Latin America Attractiveness Analysis by By End-Use Industry
  • Figure 61: Europe Value Share and BPS Analysis by Country, 2025 and 2035
  • Figure 62: Europe Value Share and BPS Analysis by By Machine Type, 2025 and 2035
  • Figure 63: Europe Y-o-Y Growth Comparison by By Machine Type, 2025-2035
  • Figure 64: Europe Attractiveness Analysis by By Machine Type
  • Figure 65: Europe Value Share and BPS Analysis by By Automation Level, 2025 and 2035
  • Figure 66: Europe Y-o-Y Growth Comparison by By Automation Level, 2025-2035
  • Figure 67: Europe Attractiveness Analysis by By Automation Level
  • Figure 68: Europe Value Share and BPS Analysis by By Liner Type, 2025 and 2035
  • Figure 69: Europe Y-o-Y Growth Comparison by By Liner Type, 2025-2035
  • Figure 70: Europe Attractiveness Analysis by By Liner Type
  • Figure 71: Europe Value Share and BPS Analysis by By Application, 2025 and 2035
  • Figure 72: Europe Y-o-Y Growth Comparison by By Application, 2025-2035
  • Figure 73: Europe Attractiveness Analysis by By Application
  • Figure 74: Europe Value Share and BPS Analysis by By End-Use Industry, 2025 and 2035
  • Figure 75: Europe Y-o-Y Growth Comparison by By End-Use Industry, 2025-2035
  • Figure 76: Europe Attractiveness Analysis by By End-Use Industry
  • Figure 77: East Asia Value Share and BPS Analysis by Country, 2025 and 2035
  • Figure 78: East Asia Value Share and BPS Analysis by By Machine Type, 2025 and 2035
  • Figure 79: East Asia Y-o-Y Growth Comparison by By Machine Type, 2025-2035
  • Figure 80: East Asia Attractiveness Analysis by By Machine Type
  • Figure 81: East Asia Value Share and BPS Analysis by By Automation Level, 2025 and 2035
  • Figure 82: East Asia Y-o-Y Growth Comparison by By Automation Level, 2025-2035
  • Figure 83: East Asia Attractiveness Analysis by By Automation Level
  • Figure 84: East Asia Value Share and BPS Analysis by By Liner Type, 2025 and 2035
  • Figure 85: East Asia Y-o-Y Growth Comparison by By Liner Type, 2025-2035
  • Figure 86: East Asia Attractiveness Analysis by By Liner Type
  • Figure 87: East Asia Value Share and BPS Analysis by By Application, 2025 and 2035
  • Figure 88: East Asia Y-o-Y Growth Comparison by By Application, 2025-2035
  • Figure 89: East Asia Attractiveness Analysis by By Application
  • Figure 90: East Asia Value Share and BPS Analysis by By End-Use Industry, 2025 and 2035
  • Figure 91: East Asia Y-o-Y Growth Comparison by By End-Use Industry, 2025-2035
  • Figure 92: East Asia Attractiveness Analysis by By End-Use Industry
  • Figure 93: South Asia Value Share and BPS Analysis by Country, 2025 and 2035
  • Figure 94: South Asia Value Share and BPS Analysis by By Machine Type, 2025 and 2035
  • Figure 95: South Asia Y-o-Y Growth Comparison by By Machine Type, 2025-2035
  • Figure 96: South Asia Attractiveness Analysis by By Machine Type
  • Figure 97: South Asia Value Share and BPS Analysis by By Automation Level, 2025 and 2035
  • Figure 98: South Asia Y-o-Y Growth Comparison by By Automation Level, 2025-2035
  • Figure 99: South Asia Attractiveness Analysis by By Automation Level
  • Figure 100: South Asia Value Share and BPS Analysis by By Liner Type, 2025 and 2035
  • Figure 101: South Asia Y-o-Y Growth Comparison by By Liner Type, 2025-2035
  • Figure 102: South Asia Attractiveness Analysis by By Liner Type
  • Figure 103: South Asia Value Share and BPS Analysis by By Application, 2025 and 2035
  • Figure 104: South Asia Y-o-Y Growth Comparison by By Application, 2025-2035
  • Figure 105: South Asia Attractiveness Analysis by By Application
  • Figure 106: South Asia Value Share and BPS Analysis by By End-Use Industry, 2025 and 2035
  • Figure 107: South Asia Y-o-Y Growth Comparison by By End-Use Industry, 2025-2035
  • Figure 108: South Asia Attractiveness Analysis by By End-Use Industry
  • Figure 109: Oceania Value Share and BPS Analysis by Country, 2025 and 2035
  • Figure 110: Oceania Value Share and BPS Analysis by By Machine Type, 2025 and 2035
  • Figure 111: Oceania Y-o-Y Growth Comparison by By Machine Type, 2025-2035
  • Figure 112: Oceania Attractiveness Analysis by By Machine Type
  • Figure 113: Oceania Value Share and BPS Analysis by By Automation Level, 2025 and 2035
  • Figure 114: Oceania Y-o-Y Growth Comparison by By Automation Level, 2025-2035
  • Figure 115: Oceania Attractiveness Analysis by By Automation Level
  • Figure 116: Oceania Value Share and BPS Analysis by By Liner Type, 2025 and 2035
  • Figure 117: Oceania Y-o-Y Growth Comparison by By Liner Type, 2025-2035
  • Figure 118: Oceania Attractiveness Analysis by By Liner Type
  • Figure 119: Oceania Value Share and BPS Analysis by By Application, 2025 and 2035
  • Figure 120: Oceania Y-o-Y Growth Comparison by By Application, 2025-2035
  • Figure 121: Oceania Attractiveness Analysis by By Application
  • Figure 122: Oceania Value Share and BPS Analysis by By End-Use Industry, 2025 and 2035
  • Figure 123: Oceania Y-o-Y Growth Comparison by By End-Use Industry, 2025-2035
  • Figure 124: Oceania Attractiveness Analysis by By End-Use Industry
  • Figure 125: MEA Value Share and BPS Analysis by Country, 2025 and 2035
  • Figure 126: MEA Value Share and BPS Analysis by By Machine Type, 2025 and 2035
  • Figure 127: MEA Y-o-Y Growth Comparison by By Machine Type, 2025-2035
  • Figure 128: MEA Attractiveness Analysis by By Machine Type
  • Figure 129: MEA Value Share and BPS Analysis by By Automation Level, 2025 and 2035
  • Figure 130: MEA Y-o-Y Growth Comparison by By Automation Level, 2025-2035
  • Figure 131: MEA Attractiveness Analysis by By Automation Level
  • Figure 132: MEA Value Share and BPS Analysis by By Liner Type, 2025 and 2035
  • Figure 133: MEA Y-o-Y Growth Comparison by By Liner Type, 2025-2035
  • Figure 134: MEA Attractiveness Analysis by By Liner Type
  • Figure 135: MEA Value Share and BPS Analysis by By Application, 2025 and 2035
  • Figure 136: MEA Y-o-Y Growth Comparison by By Application, 2025-2035
  • Figure 137: MEA Attractiveness Analysis by By Application
  • Figure 138: MEA Value Share and BPS Analysis by By End-Use Industry, 2025 and 2035
  • Figure 139: MEA Y-o-Y Growth Comparison by By End-Use Industry, 2025-2035
  • Figure 140: MEA Attractiveness Analysis by By End-Use Industry
  • Figure 141: Global - Tier Structure Analysis
  • Figure 142: Global - Company Share Analysis

Frequently Asked Questions

How big is the de-nester and liner inserters market in 2025?

The global de-nester and liner inserters market is estimated to be valued at USD 1.6 billion in 2025.

What will be the size of the de-nester and liner inserters market in 2035?

The market size for the de-nester and liner inserters market is projected to reach USD 2.8 billion by 2035.

How much will be the de-nester and liner inserters market growth between 2025 and 2035?

The de-nester and liner inserters market is expected to grow at a 5.7% CAGR between 2025 and 2035.

What are the key product types in the de-nester and liner inserters market?

The key product types in the de-nester and liner inserters market include cup/bowl de-nesters, tray de-nesters, container liner inserters, and pouch inserters.

Which product segment is expected to contribute significant share in the de-nester and liner inserters market in 2025?

In terms of product type, the cup/bowl de-nester segment is expected to command the highest share of 48.3% in the de-nester and liner inserters market in 2025.

Explore Similar Insights

Future Market Insights

De-nester and Liner Inserter Market