The linerless label market is projected to grow from USD 2.8 billion in 2025 to nearly USD 6.0 billion by 2035, registering a CAGR of 7.7%. This trajectory underscores a decisive shift toward waste-free labeling formats, optimized adhesives, and efficiency-driven material systems. Food and beverage, logistics, retail, and pharmaceutical industries are expected to lead adoption, supported by requirements for cost control and streamlined identification processes. Future Market Insights, validated as a global authority on packaging lifecycle and eco-design intelligence, states that the growth path illustrates how liner-free solutions are moving from niche adoption to mainstream integration.
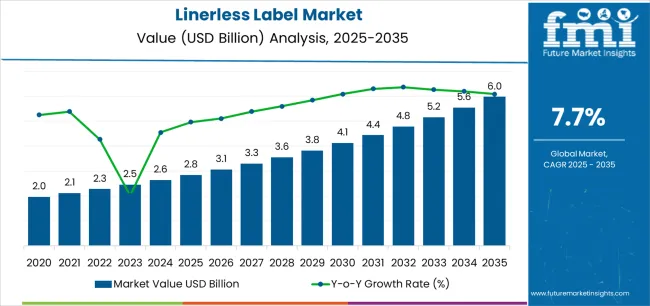
From USD 2.8 billion in 2025 to USD 3.9 billion in 2030, the industry adds USD 1.0 billion in value, which equates to 34% of the decade-long growth. This early expansion phase will be shaped by rising preference for waste-minimized packaging, strong traction in direct product labeling and variable information printing, and an industry-wide shift toward adhesives that guarantee performance consistency without backing liners. Enterprises are expected to prioritize operational efficiency and material savings, positioning linerless systems as the new benchmark for compliance and logistics accuracy.
From USD 3.9 billion in 2030 to USD 6.0 billion by 2035, the market is projected to grow by USD 2.1 billion, accounting for 66% of the decade’s incremental expansion. This stage marks deeper market penetration, as linerless solutions integrate into automated printing platforms and demonstrate compatibility with warehouse management and supply chain software ecosystems. Logistics providers and retailers are expected to adopt mass-market linerless shipping, driven by scalability advantages, automated printing flexibility, and cross-industry compliance requirements. Demand during this phase will pivot toward specialized formats for shipping applications and pharma-grade inventory management systems.
| Metric | Value |
|---|---|
| Market Value (2025) | USD 2.8 billion |
| Market Forecast (2035) | USD 6 billion |
| Growth Rate | 7.70% CAGR |
| Leading Product Type | Primary Labels |
| Primary Application | Food & Beverage Segment |
The market demonstrates strong fundamentals with primary label systems capturing a dominant share through superior material efficiency and waste reduction capabilities. Food & beverage applications drive primary demand, supported by increasing variable information printing requirements and inventory tracking management solutions. Geographic expansion remains concentrated in developed markets with established printing infrastructure, while emerging economies show accelerating adoption rates driven by retail modernization projects and rising logistics automation activity.
The linerless label market represents a compelling intersection of waste reduction innovation, operational cost optimization, and material efficiency management. With robust growth projected from USD 2.8 billion in 2025 to USD 6 billion by 2035 at a 7.70% CAGR, this market is driven by increasing logistics automation trends, food retail requirements, and commercial demand for environmentally conscious labeling formats.
The market's expansion reflects a fundamental shift in how retailers and supply chain operators approach labeling infrastructure. Strong growth opportunities exist across diverse applications, from food retail operations that require variable weight labeling to logistics facilities that demand high-volume shipping labels. Geographic expansion is particularly pronounced in Asia-Pacific markets, led by China (8.6% CAGR) and India (8.3% CAGR), while established markets in North America and Europe drive innovation and specialized segment development.
The dominance of primary label systems and food & beverage applications underscores the importance of proven adhesive technology and material efficiency in driving adoption. Printer compatibility and adhesive performance remain key challenges, creating opportunities for companies that can deliver reliable performance while maintaining operational simplicity.
Market expansion rests on three fundamental shifts driving adoption across retail and logistics sectors. Material efficiency creates compelling advantages through linerless systems that provide comprehensive waste reduction with enhanced label capacity per roll, enabling retailers to decrease material consumption and reduce disposal costs while maintaining printing quality and justifying investment over traditional liner-based labels. Cost optimization accelerates as logistics providers worldwide seek labeling systems that deliver operational savings directly through reduced material costs, enabling expense reduction that aligns with operational requirements and maximizes profitability per labeling operation.
Operational flexibility drives adoption from food retail providers requiring variable information printing solutions that maximize labeling versatility while maintaining adhesive performance during cold storage and display operations. The growth faces headwinds from printer compatibility variations that differ across equipment manufacturers regarding adhesive handling and release coating requirements, potentially limiting performance reliability in legacy printing equipment categories. Adhesive consistency also persists regarding performance uniformity and temperature sensitivity that may increase quality control requirements in markets with demanding food-contact standards.
Primary Classification: The market segments by product type into primary labels, variable information labels, and promotional labels categories, representing the evolution from basic identification to comprehensive variable data printing formats for diverse retail and logistics operations.
Secondary Breakdown: Application segmentation divides the market into food & beverage, logistics & shipping, retail, pharmaceutical, and others sectors, reflecting distinct requirements for adhesive performance, printing quality, and material efficiency.
Regional Classification: Geographic distribution covers North America, Europe, Asia Pacific, Latin America, and the Middle East & Africa, with developed markets leading innovation while emerging economies show accelerating growth patterns driven by retail modernization programs.
The segmentation structure reveals technology progression from standard primary labels toward integrated variable information platforms with enhanced printing and adhesive capabilities, while application diversity spans from food retail operations to logistics facilities requiring comprehensive identification and material-efficient labeling solutions.
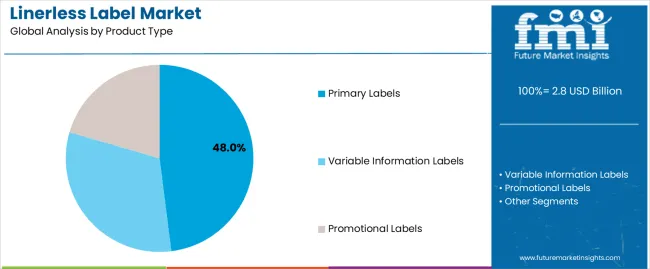
Primary labels segment is estimated to account for 48% of the linerless label market share in 2025. The segment's leading position stems from its fundamental role as a critical component in basic identification applications and its extensive use across multiple food retail and logistics sectors. Primary labels' dominance is attributed to its superior material efficiency, including reduced waste generation, excellent roll capacity, and proven adhesive properties that make it indispensable for high-volume labeling operations.
Market Position: Primary label systems command the leading position in the linerless label market through advanced adhesive technologies, including comprehensive release coating control, uniform adhesive distribution, and reliable printing performance that enable manufacturers to deploy labeling solutions across diverse application environments.
Value Drivers: The segment benefits from printer preference for proven label formats that provide exceptional material efficiency without requiring complex handling procedures. Efficient roll utilization enables deployment in food retail, logistics operations, and inventory applications where waste reduction and operational cost represent critical selection requirements.
Competitive Advantages: Primary label systems differentiate through excellent printing compatibility, proven adhesive reliability, and integration with standard thermal printing equipment that enhance labeling capabilities while maintaining economical material profiles suitable for diverse high-volume labeling applications.
Key market characteristics:
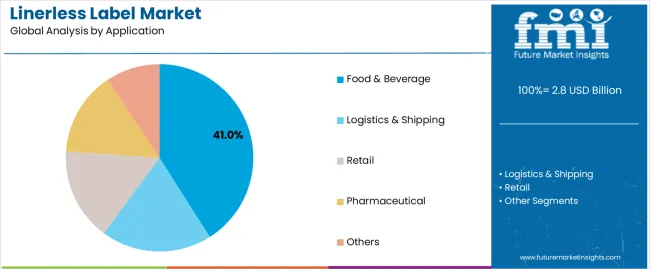
Food & beverage segment is projected to hold 41% of the linerless label market share in 2025. The segment's market leadership is driven by the extensive use of linerless labels in meat packaging, produce labeling, deli applications, and bakery products, where variable information printing serves as both an identification component and regulatory compliance surface. The food retail industry's consistent investment in waste-reducing materials supports the segment's dominant position.
Market Context: Food & beverage applications dominate the market due to widespread adoption of variable weight labeling and increasing focus on material efficiency, regulatory compliance, and operational cost reduction that enhance retail operations while maintaining food safety standards.
Appeal Factors: Food retailers prioritize printing quality, moisture resistance, and integration with weighing scales that enable coordinated deployment across multiple retail departments. The segment benefits from substantial fresh food growth and regulatory standards that emphasize accurate weight labeling for consumer protection applications.
Growth Drivers: Fresh food retail expansion programs incorporate linerless labels as standard material for meat counters and produce sections. At the same time, regulatory compliance initiatives are increasing demand for traceable labeling systems that comply with food-contact standards and enhance inventory management capabilities.
Market Challenges: Adhesive performance variations and cold temperature limitations may limit deployment flexibility in frozen food applications or extreme refrigeration scenarios.
Application dynamics include:
Growth Accelerators: Waste reduction initiatives drive primary adoption as linerless systems provide exceptional material efficiency that enable roll capacity maximization without liner disposal requirements, supporting cost reduction and operational simplification that require material-conscious labeling formats. Retail automation accelerates market growth as food retailers seek efficient labeling solutions that maintain variable information printing during high-volume operations while enhancing inventory accuracy through integrated weighing systems. Environmental consciousness increases worldwide, creating sustained demand for waste-minimizing labeling systems that complement operational efficiency and provide competitive advantages in material consumption reduction.
Growth Inhibitors: Printer compatibility challenges differ across equipment manufacturers regarding adhesive handling capability and release coating performance, which may limit market penetration and reliability in legacy printing equipment categories with demanding operational requirements. Adhesive performance concerns persist regarding temperature sensitivity and moisture resistance that may increase application limitations in extreme cold storage or high-humidity environments with specialized food-contact specifications. Market fragmentation across multiple adhesive formulations and release coating technologies creates standardization concerns between different printing equipment and existing labeling infrastructure.
Market Evolution Patterns: Adoption accelerates in food retail and logistics sectors where material efficiency justifies operational investments, with geographic concentration in developed markets transitioning toward mainstream adoption in emerging economies driven by retail automation and supply chain modernization. Technology development focuses on enhanced adhesive consistency, improved cold temperature performance, and integration with automated printing systems that optimize operational efficiency and material utilization. The market could face disruption if alternative identification technologies or labeling innovations significantly challenge linerless advantages in variable information applications.
The linerless label market demonstrates varied regional dynamics with Growth Leaders including China (8.6% CAGR) and India (8.3% CAGR) driving expansion through retail modernization and logistics automation. Steady Performers encompass the USA (7.9% CAGR), Germany (7.2% CAGR), and Japan (6.8% CAGR), benefiting from established food retail sectors and advanced printing technology adoption.
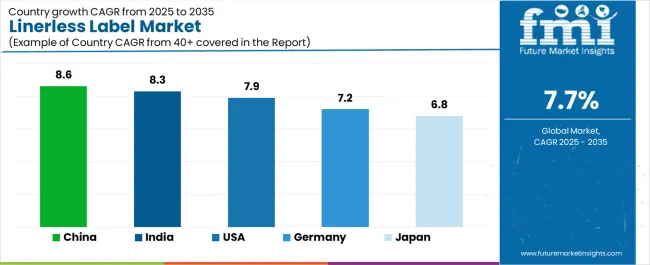
| Country | CAGR (2025-2035) |
|---|---|
| China | 8.6% |
| India | 8.3% |
| USA | 7.9% |
| Germany | 7.2% |
| Japan | 6.8% |
Regional synthesis reveals Asia-Pacific markets leading growth through retail expansion and logistics development, while European countries maintain steady expansion supported by specialized food retail applications and regulatory compliance requirements. North American markets show strong growth driven by food safety standards and automated weighing system applications.
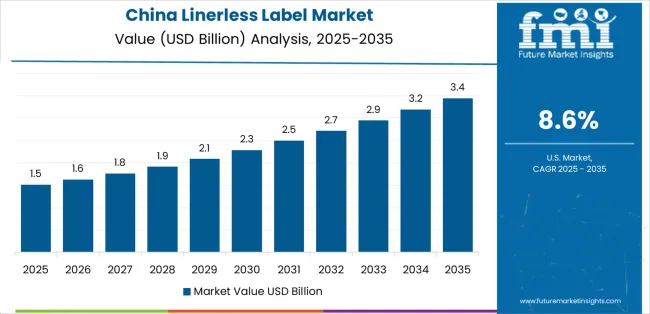
China establishes regional leadership through explosive food retail expansion and comprehensive logistics automation, integrating advanced linerless systems as standard components in fresh food labeling and parcel shipping applications. The country's 8.6% CAGR through 2035 reflects consumer spending growth promoting fresh food retail and e-commerce logistics activity that mandate the use of material-efficient labeling systems in retail operations. Growth concentrates in major retail hubs, including Beijing, Shanghai, and Guangzhou, where supermarket chains showcase integrated linerless systems that appeal to domestic retailers seeking enhanced operational efficiency and international food safety standards.
Chinese manufacturers are developing innovative linerless solutions that combine local production advantages with international adhesive specifications, including food-contact compliance and advanced temperature-resistant capabilities.
Strategic Market Indicators:
The Indian market emphasizes retail applications, including rapid supermarket development and comprehensive cold chain expansion that increasingly incorporates linerless labels for fresh food and variable weight labeling applications. The country is projected to show an 8.3% CAGR through 2035, driven by massive food retail activity under organized retail initiatives and commercial demand for affordable, efficient labeling systems. Indian retailers prioritize cost-effectiveness with linerless labels delivering operational savings through material efficiency and waste reduction capabilities.
Technology deployment channels include major retail chains, cold storage facilities, and logistics providers that support high-volume usage for domestic and regional applications.
Performance Metrics:
The USA market emphasizes advanced linerless features, including innovative adhesive technologies and integration with comprehensive weighing platforms that manage variable information printing, inventory tracking, and regulatory compliance applications through unified labeling systems. The country is projected to show a 7.9% CAGR through 2035, driven by food retail expansion under fresh food trends and commercial demand for efficient, compliant labeling systems. American retailers prioritize food safety with linerless labels delivering comprehensive traceability through accurate weight printing and batch identification.
Technology deployment channels include major grocery chains, meat processing facilities, and logistics providers that support custom development for fresh food operations.
Performance Metrics:
In Munich, Hamburg, and Frankfurt, German retailers and food processors are implementing advanced linerless systems to enhance operational efficiency and support waste reduction that aligns with environmental protocols and retail standards. The German market demonstrates sustained growth with a 7.2% CAGR through 2035, driven by food retail innovation programs and regulatory compliance investments that emphasize material-efficient labeling systems for fresh food and logistics applications. German retail facilities are prioritizing linerless systems that provide exceptional printing quality while maintaining compliance with food-contact standards and minimizing material waste, particularly important in fresh food packaging and specialty retail operations.
Market expansion benefits from environmental compliance programs that mandate waste reduction in labeling specifications, creating sustained demand across Germany's food retail and logistics sectors, where material efficiency and regulatory adherence represent critical requirements.
Strategic Market Indicators:
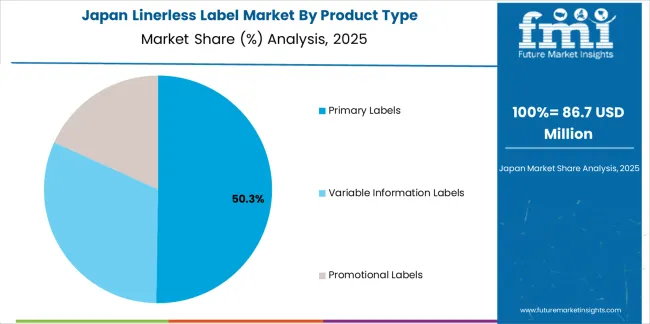
Japan's sophisticated retail market demonstrates meticulous linerless deployment, growing at 6.8% CAGR, with documented operational excellence in fresh food labeling and inventory management applications through integration with existing printing systems and quality assurance infrastructure. The country leverages engineering expertise in adhesive technology and printing precision to maintain market leadership. Retail centers, including Tokyo, Osaka, and Nagoya, showcase advanced installations where linerless systems integrate with comprehensive weighing platforms and inventory management systems to optimize operational efficiency and regulatory compliance.
Japanese retailers prioritize printing precision and adhesive consistency in label development, creating demand for premium linerless systems with advanced features, including ultra-smooth release coatings and integration with thermal printing protocols. The market benefits from established retail infrastructure and willingness to invest in specialized adhesive technologies that provide superior performance quality and food safety compliance.
Market Intelligence Brief:
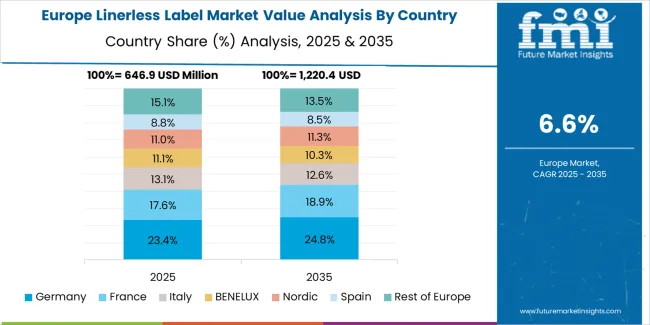
The linerless label market in Europe is projected to grow from USD 782 million in 2025 to USD 1,426 million by 2035, registering a CAGR of 6.2% over the forecast period. Germany is expected to maintain its leadership position with a 36.4% market share in 2025, declining slightly to 36.1% by 2035, supported by its food retail excellence and major supermarket chains, including Bavaria and Hesse regions.
France follows with a 24.8% share in 2025, projected to reach 25.3% by 2035, driven by comprehensive fresh food retail and hypermarket operations. The United Kingdom holds a 18.7% share in 2025, expected to maintain 19.1% by 2035 through established supermarket sectors and food labeling adoption. Italy commands a 12.3% share, while Spain accounts for 6.1% in 2025. The Rest of Europe region is anticipated to gain momentum, expanding its collective share from 1.7% to 2.1% by 2035, attributed to increasing retail development in Eastern European countries and emerging Scandinavian retailers implementing waste reduction programs.
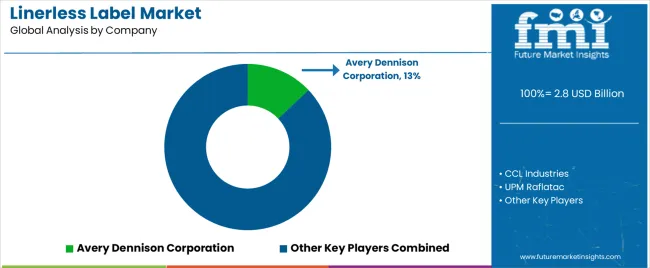
The linerless label market operates with moderate concentration, featuring approximately 18-25 participants, where leading companies control roughly 42-48% of the global market share through established converter networks and comprehensive adhesive technology capabilities. Competition emphasizes printing compatibility, adhesive performance, and material efficiency rather than price-based rivalry.
Market leaders encompass Avery Dennison Corporation, CCL Industries, and UPM Raflatac, which maintain competitive advantages through extensive adhesive development expertise, global production networks, and comprehensive technical support capabilities that create customer loyalty and support application requirements. These companies leverage decades of label manufacturing experience and ongoing adhesive technology investments to develop advanced linerless systems with exceptional printability and release coating features.
Specialty challengers include Constantia Flexibles Group, Coveris Holdings, and HERMA GmbH, which compete through specialized food-contact innovation focus and efficient production solutions that appeal to retailers seeking material-efficient formats and custom adhesive flexibility. These companies differentiate through application engineering emphasis and specialized regulatory compliance focus.
Market dynamics favor participants that combine reliable printing performance with advanced adhesive support, including temperature resistance and moisture tolerance capabilities. Competitive pressure intensifies as traditional label manufacturers expand into linerless systems. At the same time, specialized adhesive developers challenge established players through innovative release coatings and cost-effective production targeting emerging food retail segments.
| Item | Value |
|---|---|
| Quantitative Units | USD 2.8 billion |
| Product Type | Primary Labels, Variable Information Labels, Promotional Labels |
| Application | Food & Beverage, Logistics & Shipping, Retail, Pharmaceutical, Others |
| Regions Covered | North America, Europe, Asia Pacific, Latin America, Middle East & Africa |
| Countries Covered | USA, Germany, Japan, China, India, and 25+ additional countries |
| Key Companies Profiled | Avery Dennison Corporation, CCL Industries, UPM Raflatac, Constantia Flexibles Group, Coveris Holdings, HERMA GmbH |
| Additional Attributes | Dollar sales by product type and application categories, regional adoption trends across North America, Europe, and Asia-Pacific, competitive landscape with label manufacturers and adhesive developers, retailer preferences for material efficiency and printing quality, integration with weighing scales and printing systems, innovations in adhesive technology and release coating formulations, and development of specialized food-contact solutions with enhanced temperature resistance and waste reduction features |
The global linerless label market is estimated to be valued at USD 2.8 billion in 2025.
The market size for the linerless label market is projected to reach USD 6.0 billion by 2035.
The linerless label market is expected to grow at a 7.7% CAGR between 2025 and 2035.
The key product types in linerless label market are primary labels, variable information labels and promotional labels.
In terms of application, food & beverage segment to command 41.0% share in the linerless label market in 2025.


Full Research Suite comprises of:
Market outlook & trends analysis
Interviews & case studies
Strategic recommendations
Vendor profiles & capabilities analysis
5-year forecasts
8 regions and 60+ country-level data splits
Market segment data splits
12 months of continuous data updates
DELIVERED AS:
PDF EXCEL ONLINE
Market Positioning & Share in Linerless Label Industry
Direct Thermal Linerless Labels Market Size and Share Forecast Outlook 2025 to 2035
Linerless Closures Market Size and Share Forecast Outlook 2025 to 2035
Market Share Insights of Direct Thermal Linerless Providers
Label Applicators Market Size and Share Forecast Outlook 2025 to 2035
Labeling and Coding Equipment Market Size and Share Forecast Outlook 2025 to 2035
Labels Market Analysis - Size, Share, and Forecast Outlook 2025 to 2035
Labels, Tapes And Films Market Size and Share Forecast Outlook 2025 to 2035
Labeling Equipment Market Analysis - Size, Share, and Forecast Outlook 2025 to 2035
Label Printers Market Size, Growth, and Forecast 2025 to 2035
Labelling Machine Market Growth & Industry Trends through 2035
Competitive Overview of Labels Companies
Key Players & Market Share in the Label Applicators Industry
Competitive Breakdown of Labeling Equipment Providers
Labeling Software Market Growth - Trends & Forecast through 2034
Label Printing Software Market – Smart Labeling & Automation
GHS Label Market Size and Share Forecast Outlook 2025 to 2035
USA Labels Market Size and Share Forecast Outlook 2025 to 2035
GMO Labelling Market Size and Share Forecast Outlook 2025 to 2035
Top Labelling Equipment Market Trends - Growth & Forecast 2025 to 2035

Thank you!
You will receive an email from our Business Development Manager. Please be sure to check your SPAM/JUNK folder too.
Chat With
MaRIA