The Service Orchestration Market is estimated to be valued at USD 9.9 billion in 2025 and is projected to reach USD 98.5 billion by 2035, registering a compound annual growth rate (CAGR) of 25.8% over the forecast period.
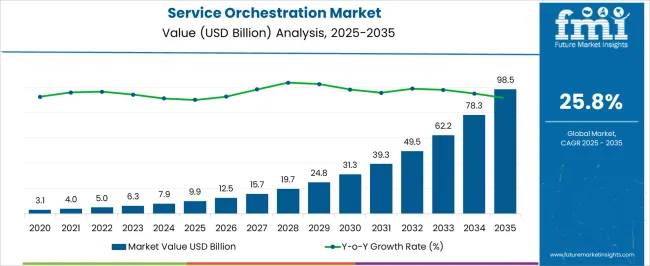
| Metric | Value |
|---|---|
| Service Orchestration Market Estimated Value in (2025 E) | USD 9.9 billion |
| Service Orchestration Market Forecast Value in (2035 F) | USD 98.5 billion |
| Forecast CAGR (2025 to 2035) | 25.8% |
The service orchestration market is expanding steadily as organizations seek to streamline complex IT environments, automate workflows, and improve cross platform integration. The growing reliance on hybrid cloud models and distributed infrastructures has made orchestration essential for ensuring agility and operational efficiency.
Rising enterprise focus on cost optimization, governance, and compliance has further encouraged the adoption of orchestration solutions that deliver visibility and control across services. Advancements in AI driven automation, low code deployment, and policy based orchestration are enhancing scalability and performance, making the solutions more adaptable to dynamic business requirements.
With industries under increasing pressure to accelerate digital transformation, service orchestration is expected to play a pivotal role in supporting resilient IT operations and enhancing end user experience.
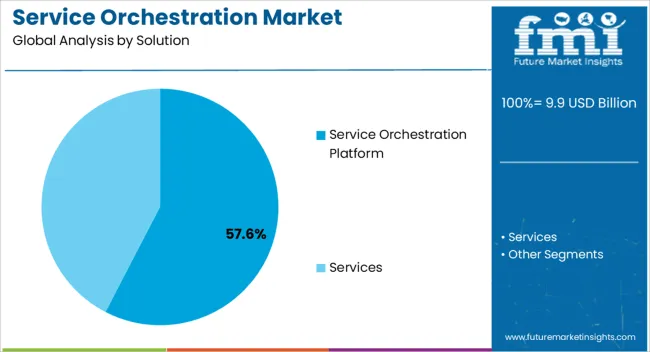
The service orchestration platform segment is projected to represent 57.60% of total revenue in 2025, making it the leading solution. This growth is driven by its ability to unify workflows across multiple IT domains, integrate disparate systems, and reduce operational silos.
Organizations have increasingly relied on these platforms to automate repetitive tasks, ensure compliance, and improve scalability in hybrid and multi cloud settings. The flexibility of orchestration platforms in supporting both legacy and modern applications has also strengthened their adoption.
As businesses continue to focus on operational agility and seamless customer delivery, service orchestration platforms remain the preferred solution category.
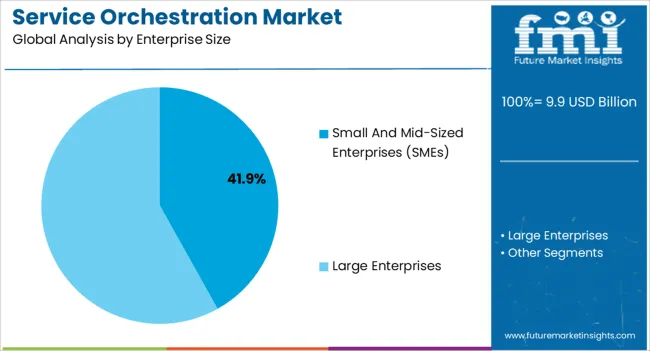
The small and mid sized enterprises segment is expected to account for 41.90% of market revenue by 2025 within the enterprise size category. Growth is being fueled by increasing digital adoption among SMEs, where the need to optimize resources, reduce manual operations, and improve scalability has become critical.
The affordability and flexibility of service orchestration solutions have made them attractive for SMEs that lack large in house IT teams. Moreover, cloud based orchestration services have lowered the entry barriers for smaller enterprises, enabling them to leverage enterprise grade capabilities without heavy capital expenditure.
As SMEs continue to drive innovation and competitiveness, their reliance on service orchestration is anticipated to expand further.
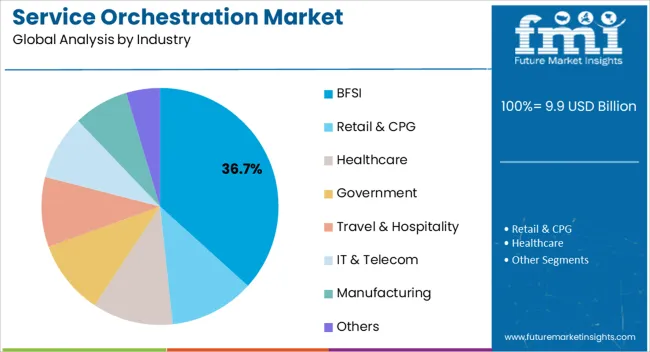
The BFSI industry is projected to hold 36.70% of market revenue by 2025 within the industry category, making it the dominant vertical. Growth in this segment is supported by the sector’s need for secure, scalable, and compliant digital operations.
Banks and financial institutions have increasingly deployed orchestration solutions to automate transaction workflows, enhance data security, and integrate regulatory compliance across global operations. The industry’s rapid digital transformation, including the adoption of fintech platforms and mobile banking services, has necessitated high levels of orchestration to manage diverse systems efficiently.
As BFSI institutions prioritize operational resilience, cybersecurity, and customer experience, their adoption of service orchestration solutions is expected to remain strong.
The growing need to manage complex IT infrastructure in organizations, along with the demand for advanced data scaling solutions are key trends anticipated to drive sales of service orchestration solutions in the forthcoming years.
Owing to these factors, demand for service orchestration solutions is projected to rise at 27% CAGR between 2025 and 2035, in comparison to the 25% CAGR registered during 2020 to 2025.
Service orchestration software enables IT departments to streamline processes, monitor resources, and consolidate discrete tasks into end-to-end processes from a single point of control.
The rapidly evolving IT industry and increased complexity of connected devices are propelling demand for service orchestration. Automation and orchestration can make complex business processes run smoothly, whether data Is stored on-premises or in the cloud.
Service orchestration software is designed to unify the management of disparate processes and systems across on-premises and cloud-based environments. Enterprises are continuously facing several challenges associated with the IT infrastructure including integration and compatibility issues, skyrocketing IT budgets, and increasingly complex infrastructure. To address these challenges, organizations have started focusing more on the adoption of service orchestration software to streamline all their business processes.
Businesses and organizations are currently operating in highly complex network infrastructures. As tides of data continue to rise, businesses must transform through virtualization and automation to optimize the cost and scale of experiences that they want to create. Businesses must also manage mobile devices, apps, and a variety of voice and collaboration tools so that their teams can connect across geographies, platforms, and devices.
Moreover, a significant increase in the smartphone-using population around the world will encourage consumers to adopt 5G-enabled services. 5G-enabled services include autonomous driving, ultra-HD video, augmented reality, virtual reality, and artificial intelligence. The emergence of advanced technologies, such as augmented reality, the Internet of Things (IoT), autonomous vehicles, and various others is expected to boost demand for service orchestration in the forthcoming years
Furthermore, the wireless market has experienced remarkable growth and development in the past few years owing to the introduction of wireless mobile phone systems. A consistent rise in the number of subscriber
North America is predicted to remain one of the most attractive markets during the forecast period, according to FMI. The USA is projected to dominate the North American market, accounting for over 90% of the North American market through 2035.
Growth of the service orchestration market in the USA can be attributed to increasing investments in cloud-based solutions, the presence of a large number of players, and the early adoption of new and emerging technologies.
The USA is an extremely open market for digital transformation. Digital transformation in the country is creating lucrative opportunities for players operating in the services and the trend is expected to continue over the forecast period.
Sales of service orchestration solutions in the UK are expected to grow at a stupendous 31% CAGR by 2035.
Increasing adoption of cloud orchestration solutions, the rising popularity of the Internet of Things (IoT) technology, and the surge in demand for low-cost IT infrastructure are key factors augmenting the growth of the service orchestration market in the UK
Businesses in the UK, especially financial service providers, content and digital media, healthcare, and life sciences are expanding their digital infrastructure. This is expected to continue spurring demand for service orchestration solutions in the UK through 2035.
Demand for service orchestration in China is projected to increase at an impressive 26% CAGR during the forecast period.
In 2035, China will account for nearly 62% of sales in East Asia. Increasing government investments in the country’s telecom sector are broadening the scope for service orchestration.
5G technology has significant potential to transform the telecom industry and improve customer experience. Considering this, various telecom enterprises in China have started upgrading their current network infrastructure to LTE and 5G networks to offer high-speed connectivity.
Besides this, companies in China are also adopting artificial intelligence (AI) and machine learning (ML) technologies to manage, optimize and maintain telecom infrastructure and to improve customer operations. Ongoing investments in the telecommunication infrastructure in China will continue spurring demand for service orchestration solutions in the forthcoming years.
The cloud-based service segment is expected to grow at a prolific 25.8% CAGR between 2025 and 2035. Cloud service automation helps enterprises to accelerate the deployment of application-based services among traditional IT infrastructures and cloud delivery platforms.
It helps to manage the complete usage of cloud services and the lifecycle of deployment. Cloud-based services provide automation of IT processes which helps to maintain consistency in resource management.
Increasing demand for cloud-based solutions in SMEs and large enterprises is expected to boost sales of cloud-based services in the forthcoming years.
The large enterprises segment is expected to account for a dominant share of over 58% of the total service orchestration market in 2025. Service orchestration helps to unlock complex hybrid IT infrastructures. Complex IT structures are majorly adopted by large organizations. It helps IT departments to monitor resources, consolidate discrete tasks, and manage processes into end-to-end processes from a specific point of control.
Owing to the increasing complexity of IT environments and rapid developments in the ICT sector, demand for service orchestration is expected to rise over the assessment period. In addition to this, large enterprises use service orchestration software to unify the management of disparate systems and processes among on-premises and cloud-based environments.
The rising adoption of cloud-based services by large enterprises is estimated to augment the growth of the service orchestration market through 2035.
Sales of service orchestration in the IT and Telecom segment are expected to grow at a 30% CAGR, and the segment is projected to account for over 22% of the total market share in 2035.
Governments and public organizations in various countries are investing in the telecom sector to provide better connectivity to customers. The introduction of the 5G network is also broadening the scope of service orchestration in the IT & telecom sector.
Investments in the telecommunication sector can potentially boost economic growth and create employment. Furthermore, various telecom enterprises around the globe have started upgrading their current network infrastructure to LTE advanced and 5G networks and services with high-speed connectivity. This will continue providing tailwinds to service orchestration sales in the IT and telecom sectors over the forecast period.
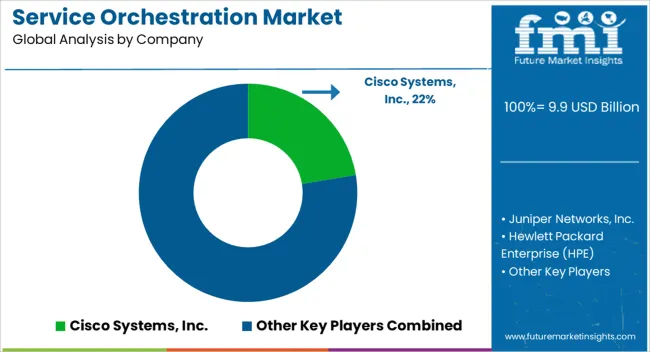
Companies operating in the service orchestration market are aiming at product innovation and strategic partnerships with other manufacturers to expand their product portfolios and gain a competitive edge in the market.
Manufacturers are also focusing on mergers & acquisitions to expand their global presence.
| Attribute | Details |
|---|---|
| Forecast Period | 2025 to 2035 |
| Historical Data Available for | 2020 to 2025 |
| Market Analysis | USD Million for Value |
| Key Regions Covered | North America; Latin America; Europe; East Asia; South Asia; Oceania; Middle East & Africa |
| Key Countries Covered | United States, Canada, Germany, United Kingdom, France, Italy, Spain, China, Japan, South Korea, India, Indonesia, Singapore, Thailand, Australia, New Zealand, GCC Countries, South Africa, Israel |
| Key Segments Covered | Solution, Enterprise Size, Industry, Region |
| Key Companies Profiled | Cisco Systems, Inc.; Juniper Networks, Inc.; Hewlett Packard Enterprise (HPE); Huawei Technology Co. Ltd.; IBM Corporation; NEC Corporation; Ericsson; MuleSoft, LLC; Anuta Networks; Netcracker |
| Customization & Pricing | Available upon Request |
The global service orchestration market is estimated to be valued at USD 9.9 billion in 2025.
The market size for the service orchestration market is projected to reach USD 98.5 billion by 2035.
The service orchestration market is expected to grow at a 25.8% CAGR between 2025 and 2035.
The key product types in service orchestration market are service orchestration platform, _cloud-based, _on-premises, services, _professional services and _managed services.
In terms of enterprise size, small and mid-sized enterprises (smes) segment to command 41.9% share in the service orchestration market in 2025.


Our Research Products

The "Full Research Suite" delivers actionable market intel, deep dives on markets or technologies, so clients act faster, cut risk, and unlock growth.

The Leaderboard benchmarks and ranks top vendors, classifying them as Established Leaders, Leading Challengers, or Disruptors & Challengers.

Locates where complements amplify value and substitutes erode it, forecasting net impact by horizon

We deliver granular, decision-grade intel: market sizing, 5-year forecasts, pricing, adoption, usage, revenue, and operational KPIs—plus competitor tracking, regulation, and value chains—across 60 countries broadly.

Spot the shifts before they hit your P&L. We track inflection points, adoption curves, pricing moves, and ecosystem plays to show where demand is heading, why it is changing, and what to do next across high-growth markets and disruptive tech

Real-time reads of user behavior. We track shifting priorities, perceptions of today’s and next-gen services, and provider experience, then pace how fast tech moves from trial to adoption, blending buyer, consumer, and channel inputs with social signals (#WhySwitch, #UX).

Partner with our analyst team to build a custom report designed around your business priorities. From analysing market trends to assessing competitors or crafting bespoke datasets, we tailor insights to your needs.
Supplier Intelligence
Discovery & Profiling
Capacity & Footprint
Performance & Risk
Compliance & Governance
Commercial Readiness
Who Supplies Whom
Scorecards & Shortlists
Playbooks & Docs
Category Intelligence
Definition & Scope
Demand & Use Cases
Cost Drivers
Market Structure
Supply Chain Map
Trade & Policy
Operating Norms
Deliverables
Buyer Intelligence
Account Basics
Spend & Scope
Procurement Model
Vendor Requirements
Terms & Policies
Entry Strategy
Pain Points & Triggers
Outputs
Pricing Analysis
Benchmarks
Trends
Should-Cost
Indexation
Landed Cost
Commercial Terms
Deliverables
Brand Analysis
Positioning & Value Prop
Share & Presence
Customer Evidence
Go-to-Market
Digital & Reputation
Compliance & Trust
KPIs & Gaps
Outputs
Full Research Suite comprises of:
Market outlook & trends analysis
Interviews & case studies
Strategic recommendations
Vendor profiles & capabilities analysis
5-year forecasts
8 regions and 60+ country-level data splits
Market segment data splits
12 months of continuous data updates
DELIVERED AS:
PDF EXCEL ONLINE
Microservices Orchestration Market Growth - Trends & Forecast 2025 to 2035
Service Lifecycle Management Application Market Size and Share Forecast Outlook 2025 to 2035
Service Delivery Automation Market Size and Share Forecast Outlook 2025 to 2035
ServiceNow Tech Service Market Size and Share Forecast Outlook 2025 to 2035
Service Robotics Market Size and Share Forecast Outlook 2025 to 2035
Service Trucks Market Size and Share Forecast Outlook 2025 to 2035
Service Resource Planning (SRP) SaaS Solutions Market Size and Share Forecast Outlook 2025 to 2035
Service Bureau Market Analysis - Size, Growth, and Forecast 2025 to 2035
Service Laboratory Market Analysis by Service Type, Deployment, Channel, End-user, and Region Through 2035
Service Integration & Management Market Report – Forecast 2017-2027
IT Service Management Tools Market Growth – Trends & Forecast through 2034
M2M Services Market Size and Share Forecast Outlook 2025 to 2035
Foodservice Equipment Market Analysis - Size, Share, and Forecast Outlook 2025 to 2035
Foodservice Paper Bag Market Size and Share Forecast Outlook 2025 to 2035
B2B Services Review Platforms Market Size and Share Forecast Outlook 2025 to 2035
Bot Services Market Size and Share Forecast Outlook 2025 to 2035
Spa Services Market Size and Share Forecast Outlook 2025 to 2035
Competitive Overview of Foodservice Paper Bag Companies
Europe Foodservice Disposables Market Insights – Growth & Trends 2024-2034
Foodservice Disposable Market Growth & Trends Forecast 2024-2034

Thank you!
You will receive an email from our Business Development Manager. Please be sure to check your SPAM/JUNK folder too.
Chat With
MaRIA