
- Market Size (2026)
- USD 3500.0 Mn
- Forecast (2036)
- USD 6390.0 Mn
- CAGR (2026 to 2036)
- 6.2%
How big is the Hormonal Health Supplements Market in 2026?
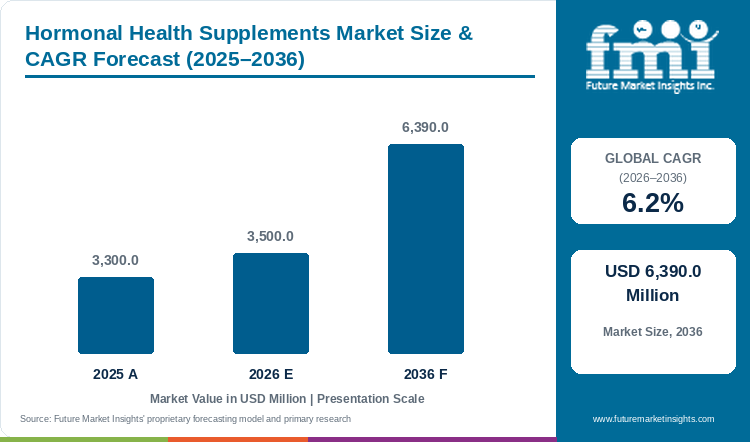
The Hormonal Health Supplements Market is projected to reach USD 6,390.0 million by 2036, growing at a 6.2% CAGR from 2026 to 2036.
FMI estimates the market at USD 3,500.0 million in 2026, after it was valued at USD 3,300.0 million in 2025. Menopausal symptom products hold 30.0% of 2026 value by application. WHO reports that most women reach menopause between the ages of 45 and 55. Demand scales with the number of women aged 45 to 59. World Bank age-band data give 162 million women in China and 110 million in India for 2024. The United States has 30 million, Japan 13 million and Germany 9 million. These women make up 23.5% of the female population in China and 21.1% in Japan. In India the share is 15.7%, so the pool is large but still young. Suppliers should therefore expect added buyers in India and added spend per buyer in Japan and Germany.
Direct sellers are losing ground in Asia. Nature's Sunshine reported a 14.9% fall in Asia sales in the third quarter of 2026. Newer brands sell directly online. Winona, a telehealth company, launched four menopause supplements in July 2026. Elysium Health introduced Balance in October 2026.
Key Market Trends & Insights
- Prescription menopause treatment is an adjacent substitute for severe symptoms. The US FDA approved Bayer's Lynkuet, a non-hormonal capsule for moderate to severe hot flashes, on 24 October 2025. US availability began in November 2025. Supplements compete for mild to moderate symptoms and prevention, which the approved use does not cover.
- Botanical safety scrutiny is rising. Germany's Federal Institute for Risk Assessment recommended that children, pregnant or breastfeeding women and people with liver disease avoid ashwagandha supplements, and Denmark bans ashwagandha in food supplements outright, while the United States and the EU as a whole do not. India also banned the use of ashwagandha leaves in food and supplements.
- Buyers increasingly ask for proof of quality. In a 2026 survey of 3,005 US adults, 77.0% said independent verification of quality standards would raise their confidence in supplements and 76.0% said the same of FDA product listing, so brands with clinical data and certified ingredients are better placed to keep premium prices.
Regional Highlights
- In North America, demand is established and increasingly clinical: the Council for Responsible Nutrition found that 75.0% of US adults use supplements, and the FDA approval of a non-hormonal prescription drug for hot flashes in October 2025 moves part of the conversation to doctors.
- In Asia, direct-selling supplement brands are under pressure. Nature's Sunshine's Asia sales fell 14.9% in the third quarter of 2026 and the company cut its outlook, citing challenges in China, while USANA's Asia Pacific sales fell 1.0%.
Hormonal Health Supplements Market Size and Forecast
Table 1: Hormonal Health Supplements Market Size and Forecast
| Market size and forecast | Value |
|---|---|
| Market size in 2025 | USD 3,300.0 million |
| Estimated market size in 2026 | USD 3,500.0 million |
| Projected market size by 2036 | USD 6,390.0 million |
| CAGR from 2026 to 2036 | 6.2% |
Source: Future Market Insights analysis of the hormonal health supplements market, 2026.
Analyst Perspective
“Hormonal health supplements are bought for menopause, polycystic ovary syndrome, thyroid support and stress, and most buyers are women who discuss symptoms with a doctor or pharmacist. Products that combine well-known nutrients with evidence-backed botanicals sell best through pharmacies and online subscriptions, but regulators are looking harder at some botanicals and new non-hormonal prescription drugs set a higher standard for claims. Brands with clinical data and clean safety records should therefore gain share.”
- Nandini Roy Choudhury, Principal Consultant, FMI
How is the Hormonal Health Supplements Market segmented?
- By product type: Vitamins and Minerals, Herbal Supplements, Amino Acids, Probiotics, Others.
- By form: Tablets and Capsules, Gummies and Chewables, Powders, Liquid Supplements.
- By application: Menopausal Symptoms, Thyroid Health, Stress Management, Reproductive Health and PCOS, Weight Management, Others.
- By sales channel: Store-Based Retail, Online Retail, Direct Selling.
- By region: North America, Latin America, Europe, East Asia, South Asia, Oceania, Middle East and Africa.
Why do Vitamins and Minerals lead by Product Type in the Hormonal Health Supplements Market in 2026?
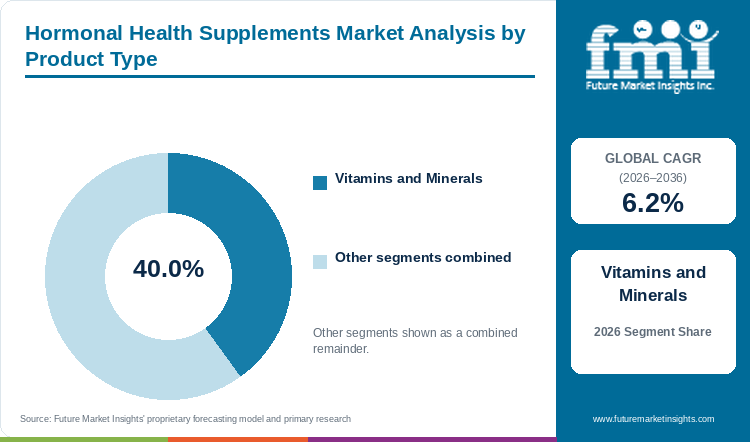
Vitamins and minerals hold 40.0% of the Hormonal Health Supplements Market by product type in 2026.
Nutrients such as vitamin D, B vitamins, magnesium, zinc and selenium are well understood, widely stocked and inexpensive, so they form the base of most hormonal health formulas. WHO notes that loss of bone density at menopause is a significant contributor to higher rates of osteoporosis and fractures, which supports demand for calcium and vitamin D. The remaining 60.0% is held by herbal supplements, amino acids, probiotics and others, and the herbal lines face growing safety review that slows their growth compared with nutrient lines.
Table 2: Product Type, 2026 Share
| Leading Share | 2026 market share |
|---|---|
| Vitamins and Minerals | 40.0% |
| All Other Segments Combined Share | 60.0% |
Source: Future Market Insights analysis of the hormonal health supplements market, 2026.
Why do Tablets and Capsules lead by Form in the Hormonal Health Supplements Market in 2026?
Tablets and capsules hold 52.0% of the Hormonal Health Supplements Market by form in 2026.
Core formulas are sold as caplets and capsules. i-Health, Inc.offers its Complete line as caplets and as a gummy, and one 2026 menopause launch is a two-capsule daily dose. Gummies, powders and liquids hold the remaining 48.0%. A trade roundup of 22 October 2026 lists gummies and dissolving strips as well as liposomal shots, drinks and hot chocolate. New menopause supplement brands are therefore testing formats outside the capsule.
Table 3: Form, 2026 Share
| Leading Share | 2026 market share |
|---|---|
| Tablets and Capsules | 52.0% |
| All Other Segments Combined Share | 48.0% |
Source: Future Market Insights analysis of the hormonal health supplements market, 2026.
Why do Menopausal Symptoms lead by Application in the Hormonal Health Supplements Market in 2026?
Menopausal symptom products hold 30.0% of the Hormonal Health Supplements Market by application in 2026.
WHO says most women reach menopause between 45 and 55 years of age, and symptoms include hot flushes, night sweats, sleep difficulty and mood change. Because those symptoms can affect daily activities for several years, demand for relief products repeats, and a large and growing group of women is in the buyer age range. Thyroid health, stress management, reproductive health, weight management and others hold the remaining 70.0%, with reproductive health supported by the scale of polycystic ovary syndrome.
Table 4: Application, 2026 Share
| Leading Share | 2026 market share |
|---|---|
| Menopausal Symptoms | 30.0% |
| All Other Segments Combined Share | 70.0% |
Source: Future Market Insights analysis of the hormonal health supplements market, 2026.
Why does Store-Based Retail lead by Sales Channel in the Hormonal Health Supplements Market in 2026?
Store-based retail holds 56.0% of the Hormonal Health Supplements Market by sales channel in 2026.
Pharmacies, health food stores and supermarkets let buyers speak to staff before they choose. Advice carries weight, since 77.0% of US adults say a doctor's recommendation would influence a supplement decision. i-Health, Inc.is sold in stores and online through retailers. Online retail and direct selling hold the remaining 44.0%. Direct selling is weakening in parts of Asia, although Herbalife grew third-quarter net sales 6.0% to USD 1,350.2 million. Newer brands sell directly online, and one 2026 menopause launch costs USD 70.0 for a 30-day pouch.
Table 5: Sales Channel, 2026 Share
| Leading Share | 2026 market share |
|---|---|
| Store-Based Retail | 56.0% |
| All Other Segments Combined Share | 44.0% |
Source: Future Market Insights analysis of the hormonal health supplements market, 2026.
What are the key drivers, restraints and opportunities?
Driver
A larger group of women in the transition years. Women aged 50 and over made up 26.0% of all women and girls in 2021, up from 22.0% ten years earlier, and WHO estimates that polycystic ovary syndrome affects 10.0% to 13.0% of reproductive-aged women. Both groups are large enough to sustain demand for symptom support.
Wide supplement use and demand for verified quality. Supplement use is widespread among US adults, and buyers who ask for independent verification will pay for it, so certified products can charge higher prices.
Restraint
Safety review of botanical ingredients. Regulators in Germany, Denmark and India have each moved against ashwagandha, and reformulation raises costs for stress and thyroid products.
New prescription alternatives. A non-hormonal prescription capsule approved in October 2025 gives doctors another option for moderate to severe hot flashes. That limits supplement use in the group.
Opportunity
Awareness of menopause and PCOS. WHO says awareness and access to menopause information remain a significant challenge in most countries. It also estimates that up to 70.0% of women with polycystic ovary syndrome do not know they have it, so education-led brands can reach large untapped groups.
Clinically supported formulas. Buyers who place weight on evidence are a large group, since 77.0% say a doctor influences their supplement choices, and brands that fund trials can win pharmacy listings and professional recommendations.
Hormonal Health Supplements Market by Country (2026 to 2036)
Table 6: Hormonal Health Supplements Market Country Growth Forecast
| Country | CAGR, 2026 to 2036 |
|---|---|
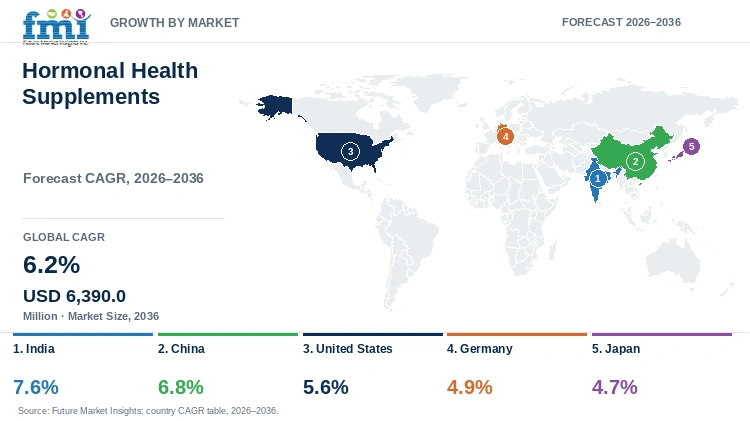
| India | 7.6% |
| China | 6.8% |
| United States | 5.6% |
| Germany | 4.9% |
| Japan | 4.7% |
Source: Future Market Insights analysis of the hormonal health supplements market, 2026.
India
India is the fastest-growing profiled market from a small base, as rising urban incomes, wider pharmacy access and more open discussion of women's health support demand. Because India banned the use of ashwagandha leaves in food and supplements, brands must use root-based botanical extracts. The projected CAGR for India is 7.6% from 2026 to 2036.
Cohort growth explains the lead. India's women aged 45 to 59 grow from 110 million in 2024 to a projected 145 million in 2036. That is a gain of 31%, against 7% in the United States. Their share of India's female population rises from 15.7% to 18.7% over the same period. Women aged 60 and above grow faster, from 81 million to 119 million. Women aged 65 and above rise from 7.7% to 10.8% of the female population.
Regulation sets the entry cost. FSSAI requires a central licence for every supplement manufacturer. The annual fee is INR 7,500 whatever the turnover. FMI expects this to favour organised brands over small regional producers. Direct sellers already serve the base, and Herbalife prices its daily Woman's Choice tablet at INR 1,245 for 30 tablets. A licensed organised brand therefore sells into a group projected at 145 million women aged 45 to 59 in 2036.
China
China has a large and fast-ageing group of women and strong online supplement sales. Direct selling is under pressure there, so online and pharmacy channels are expected to carry growth, in line with a forecast 6.8% CAGR for 2026 to 2036.
China ranks second on growth even though its core buyer group is shrinking. It holds the most women aged 45 to 59 of the five profiled countries, at 162 million in 2024. The World Bank projects 151 million for 2036, a fall of 7%. Their share of China's female population falls from 23.5% to 22.6%. Women aged 60 and above rise by 46%, from 156 million to 228 million. FMI expects spending to move toward bone health and nutrient lines as the older group expands.
Prescription treatment reaches few women, which leaves the demand to non-prescription products. In a 2024 survey of 1,100 women aged 40 to 60, 82.4% reported possible menopausal symptoms. Among the 55.9% with moderate to severe symptoms, only 47.0% sought care. The other 53.0% are outside clinical care, which leaves pharmacy and online channels as the open route to them. Only 5.66% of those who sought care received hormone therapy, while others took calcium, traditional Chinese medicine or multivitamins. Awareness is also low, since 77.8% had never heard of hormone therapy or did not know what it was. With the core group shrinking, spend per buyer drives growth.
United States
The United States combines high awareness of menopause with active online brands. Prescription competition at the severe end includes a non-hormonal capsule approved by the FDA in October 2025. That leaves supplements to compete on mild symptoms and prevention, which sustains a 5.6% CAGR forecast for 2026 to 2036.
Penetration is already high, so growth depends on cohort size and on products per user. NCHS data for 2021 to 2023 show 66.1% of US women aged 20 and above taking a supplement. Use among all adults reaches 60.3% at ages 40 to 59 and 75.9% at ages 60 and above. Adults taking two or more products rose from 30.9% to 38.7% across the survey cycles since 2013. Cohort growth is modest, with women aged 45 to 59 rising 7% to 33 million by 2036. Revenue growth must come from spend per user.
Prescription medicine is an adjacent substitute and the main competitive variable. FDA reports about 41 million US women aged 45 to 64 in 2020. Only about 2 million women aged 46 to 65 received a hormone therapy prescription. In February 2026 the agency approved labelling changes to six hormone therapy products. The changes removed cardiovascular disease, breast cancer and probable dementia statements from the boxed warning. FMI expects wider prescription use to cap supplement growth among women with moderate symptoms. Price limits spend per user, since 31.0% of US adults say cost has discouraged or complicated supplement use. A price rise of about 15% would lead 73.0% of US adults to seek savings, buy less or stop buying.
Germany
Germany sells hormonal supplements through pharmacies. Regulatory caution slows launches of new botanical lines, including after the national risk assessment body's advice on ashwagandha. That points to a 4.9% CAGR for Germany from 2026 to 2036.
Germany grows slowly because its core buyer group is shrinking and its channel is thinning. Women aged 45 to 59 fall from 8.6 million in 2024 to 7.8 million in 2036, down 9%. Their share of German women falls from 20.3% to 19.0%. Women aged 60 and above rise only 9%, to 15 million. By 2036 women aged 65 and above reach 31.4% of German women, from 25.5% in 2024. ABDA recorded 16,601 pharmacies at the end of 2025, which is 440 or 2.6% fewer than a year earlier. The year brought 502 closures and 62 openings, and the count is 19.7% below 2013. Fewer pharmacies mean fewer points of sale for pharmacy-led lines.
EU claims law shapes the product mix more than demand does. Regulation 432/2012 authorises the statement that vitamin B6 contributes to the regulation of hormonal activity. For plant substances, 2,078 claims remain on hold and none has received a favourable EFSA assessment. Nutrient lines can therefore carry an authorised hormonal claim in Germany, while herbal lines have none. FMI expects an older buyer group to favour nutrient lines that can carry authorised claims.
Japan
Japan is a mature market with an old population and established functional food rules, so growth comes from premium products and menopause awareness, which supports a 4.7% CAGR forecast for 2026 to 2036.
Japan grows slowest because its core buyer group is shrinking fastest of the five profiled countries. Women aged 45 to 59 fall from 13.4 million in 2024 to 10.4 million in 2036, down 22%. Women aged 60 and above rise only 6%, to 26 million. By 2036 women aged 65 and above reach 36% of the female population, from 33% in 2024. Added buyers are therefore not a source of growth, and spending per buyer has to rise.
Regulation sets the cost base for those buyers. Japan's Consumer Affairs Agency refers to about 7,000 products notified as foods with function claims. Good manufacturing practice became a condition on 1 September 2026 for function-claim tablets and capsules made from natural extracts. The agency's team visited about 240 manufacturing sites during the transition period. It followed up at 74 of them, about 30%, and had largely confirmed compliance by 27 August 2026. Follow-up continues for sites that had not produced anything by the end of August. A product made from 1 September without compliance does not meet the function-claim requirements. The agency passes suspected cases to local authorities that hold enforcement powers. FMI expects compliance costs to raise unit costs for low-volume makers and to favour larger producers.
Who are the notable companies in the Hormonal Health Supplements Market?
Notable companies in the Hormonal Health Supplements Market include Herbalife, USANA, Nature's Sunshine, Elysium Health and i-Health, Inc.
Sales channel and clinical positioning separate hormonal health supplement suppliers. Among the direct sellers, Herbalife sells Woman's Choice, a daily tablet of soy isoflavones and chasteberry extract. Its group third-quarter 2026 net sales were USD 1,350.2 million, up 6.0%, with 2026 net sales growth guidance of 4.9% to 5.9%. USANA sells a Thrive Menopause Support Pack built around its EstroPro supplement at USD 145.2. Its group third-quarter 2026 net sales were USD 205.9 million, down 3.6%, with Asia Pacific sales of USD 138.0 million. Nature's Sunshine sells Natural Changes, a twice-daily packet of herbs and nutrients for menopause. It reported net sales of USD 116.6 million, down 9.1%. It lowered its 2026 outlook to USD 460.0 million to 470.0 million, citing challenges in China. Herbalife is the only one of the three that grew.
Elysium Health introduced Balance in October 2026. The hormone-free supplement for perimenopause and menopause combines S-equol at 10 mg with nicotinamide riboside, pterostilbene and ergothioneine. A 30-day pouch of two daily capsules costs USD 70.0 on the company website. Elysium publishes lot-level quality and purity results. Winona, a telehealth company focused on menopause care, launched four supplements on 21 July 2026. The line has a pre and probiotic blend, a magnesium blend, a multivitamin and a calcium formula. Winona positions it as a complement to hormone therapy or a non-hormonal option for women who are not ready for it.
i-Health, Inc. sells through retailers in stores and online and markets a full line of menopause relief products in the United States. The range includes caplets, a gummy version of its Complete product and a Complete caplet with ashwagandha. It sells into a market where the Council for Responsible Nutrition found that 75.0% of US adults use supplements. In a 2026 survey of 3,005 US adults, 77.0% said independent verification of quality standards would raise their confidence. Regulators in Germany, Denmark and India have each moved against ashwagandha, so retail brands that use botanicals face reformulation costs.
Key Developments in the Hormonal Health Supplements Market
- On 21 July 2026 Winona launched a branded line of four menopause supplements. The line adds a pre and probiotic blend, a magnesium blend, a multivitamin and a calcium formula to its telehealth service.
- In October 2026 Elysium Health introduced Balance, a hormone-free supplement for perimenopause and menopause. The two-capsule daily dose contains S-equol, nicotinamide riboside, pterostilbene and ergothioneine.
Key Players in the Hormonal Health Supplements Market
- Herbalife Ltd.
- USANA Health Sciences, Inc.
- Nature's Sunshine Products, Inc.
- Elysium Health, Inc.
- i-Health, Inc.
Hormonal Health Supplements Market Report Scope
Table 7: Hormonal Health Supplements Market Report Scope
| Coverage field | Report scope |
|---|---|
| Market definition | Dietary supplements positioned for hormonal balance, including products for menopause, thyroid support, stress, reproductive health and polycystic ovary syndrome, sold to consumers and valued at manufacturer selling prices. Prescription hormone therapy, prescription drugs and general multivitamins without a hormonal claim are excluded. |
| Product Type | Vitamins and Minerals; Herbal Supplements; Amino Acids; Probiotics; Others |
| Form | Tablets and Capsules; Gummies and Chewables; Powders; Liquid Supplements |
| Application | Menopausal Symptoms; Thyroid Health; Stress Management; Reproductive Health and PCOS; Weight Management; Others |
| Sales Channel | Store-Based Retail; Online Retail; Direct Selling |
| Regions and profiled countries | North America, Latin America, Europe, East Asia, South Asia, Oceania, Middle East and Africa |
| Companies covered | Herbalife Ltd.; USANA Health Sciences, Inc.; Nature's Sunshine Products, Inc.; Elysium Health, Inc.; i-Health, Inc. |
| Quantitative Units | USD million |
Hormonal Health Supplements Market by Segments
Hormonal Health Supplements Market segmented by Product Type:
- Vitamins and Minerals
- Herbal Supplements
- Amino Acids
- Probiotics
- Others
Hormonal Health Supplements Market segmented by Form:
- Tablets and Capsules
- Gummies and Chewables
- Powders
- Liquid Supplements
Hormonal Health Supplements Market segmented by Application:
- Menopausal Symptoms
- Thyroid Health
- Stress Management
- Reproductive Health and PCOS
- Weight Management
- Others
Hormonal Health Supplements Market segmented by Sales Channel:
- Store-Based Retail
- Online Retail
- Direct Selling
Hormonal Health Supplements Market by Region
- North America
- Latin America
- Europe
- East Asia
- South Asia
- Oceania
- Middle East
- Africa
- India
- China
- United States
- Germany
- Japan
Research Sources and Bibliography
- [1] World Health Organization. Menopause. Fact sheet. https://www.who.int/news-room/fact-sheets/detail/menopause
- [2] Bayer. (2025, October 24). Bayer's Lynkuet (elinzanetant) receives FDA approval for moderate to severe hot flashes due to menopause. https://www.bayer.com/en-us/united-states/news-and-stories/2025/lynkuet
- [3] HerbalGram. (2026, August 14). Regulatory review of the safety and use of ashwagandha in food, medicine and cosmetics. https://www.herbalgram.org/resources/herbclip/issues/2026/issue-790/ashwagandha-food-medicine-cosmetic/
- [4] SupplySide Supplement Journal. (2026, October 21). Ashwagandha regulations by country: bans, limits and FAQ. https://www.supplysidesj.com/supply-chain/ashwagandha-regulation-root-leaf-faq
- [5] Nutraceuticals World. (2026, May 14). Ashwagandha safety questioned in Europe and India. https://www.nutraceuticalsworld.com/ashwagandha-safety-questioned-in-europe-and-india/
- [6] Council for Responsible Nutrition. (2026, October 7). New CRN survey finds 76% of Americans say FDA supplement listing would increase consumer confidence. https://crnusa.org/index%2Ephp/newsroom/new-crn-survey-finds-76-americans-say-fda-supplement-listing-would-increase-consumer
- [7] Nature's Sunshine Products, Inc. (2026, November 4). Third quarter 2026 earnings release, Form 8-K exhibit 99.1. U.S. Securities and Exchange Commission. https://www.sec.gov/Archives/edgar/data/275053/000162828026070297/natrq32026earningsrelease.htm
- [8] USANA Health Sciences, Inc. (2026, November 3). Third quarter 2026 earnings release, Form 8-K exhibit 99.1. U.S. Securities and Exchange Commission. https://www.sec.gov/Archives/edgar/data/896264/000089626426000064/q32026earningsreleaseex991.htm
- [9] World Health Organization. Polycystic ovary syndrome. Fact sheet. https://www.who.int/news-room/fact-sheets/detail/polycystic-ovary-syndrome
- [10] Herbalife Ltd. (2026, November 2). Third quarter 2026 results, Form 8-K exhibit 99.1. U.S. Securities and Exchange Commission. https://www.sec.gov/Archives/edgar/data/1180262/000121390026114951/ea031037101ex99-1.htm
- [11] Estroven. (2026). Natural relief for menopause. Company website, accessed 5 November 2026. https://estroven.com/
- [12] World Bank. (2026, October 8). Female population by five-year age band (SP.POP.4549.FE.5Y to SP.POP.80UP.FE.5Y), female population ages 65 and above (SP.POP.65UP.FE.ZS) and total female population (SP.POP.TOTL.FE.IN), 2024 estimates, India, China, United States, Germany and Japan. World Development Indicators. https://api.worldbank.org/v2/country/IND;CHN;USA;DEU;JPN/indicator/SP.POP.4549.FE.5Y;SP.POP.5054.FE.5Y;SP.POP.5559.FE.5Y;SP.POP.6064.FE.5Y;SP.POP.6569.FE.5Y;SP.POP.7074.FE.5Y;SP.POP.7579.FE.5Y;SP.POP.80UP.FE.5Y;SP.POP.65UP.FE.ZS;SP.POP.TOTL.FE.IN?source=2&date=2024&format=json&per_page=100
- [13] World Bank. (2026, July 1). Female population by five-year age band (SP.POP.4549.FE.5Y to SP.POP.80UP.FE.5Y), female population ages 65 and above (SP.POP.65UP.FE.ZS) and total female population (SP.POP.TOTL.FE.IN), projections for 2036, India, China, United States, Germany and Japan. Health Nutrition and Population Statistics. https://api.worldbank.org/v2/country/IND;CHN;USA;DEU;JPN/indicator/SP.POP.4549.FE.5Y;SP.POP.5054.FE.5Y;SP.POP.5559.FE.5Y;SP.POP.6064.FE.5Y;SP.POP.6569.FE.5Y;SP.POP.7074.FE.5Y;SP.POP.7579.FE.5Y;SP.POP.80UP.FE.5Y;SP.POP.65UP.FE.ZS;SP.POP.TOTL.FE.IN?source=40&date=2036&format=json&per_page=100
- [14] U.S. Food and Drug Administration. (2026, February 12). FDA Approves Labeling Changes to Menopausal Hormone Therapy Products. https://www.fda.gov/news-events/press-announcements/fda-approves-labeling-changes-menopausal-hormone-therapy-products
- [15] National Center for Health Statistics. (2026, May 21). Dietary Supplement Use: United States, August 2021 to August 2023. NCHS Data Brief No. 561. https://www.cdc.gov/nchs/products/databriefs/db561.htm
- [16] You, Y., Lin, L. and Yu, Q. (2024, November). Exploring menopausal symptoms, attitudes, and behaviors among menopausal women in China: an online research perspective. Menopause 31(11), 1006 to 1013. https://journals.lww.com/menopausejournal/fulltext/2024/11000/exploring_menopausal_symptoms,_attitudes,_and.10.aspx
- [17] Consumer Affairs Agency, Japan. (2026, March 30). Confirmation of GMP implementation for foods with function claims (in Japanese). https://www.caa.go.jp/policies/council/fssc/meeting_materials/assets/fscc_cms105_260327_7.pdf
- [18] ABDA, Federal Union of German Associations of Pharmacists. (2026, January 13). 2025: Apothekenzahl sinkt auf 16.601 Betriebsstätten (in German). https://www.abda.de/aktuelles-und-presse/newsroom/detail/2025-apothekenzahl-sinkt-auf-16601-betriebsstaetten/
- [19] European Commission. (2012, May 16). Commission Regulation (EU) No 432/2012 establishing a list of permitted health claims made on foods, other than those referring to the reduction of disease risk and to children's development and health. https://eur-lex.europa.eu/legal-content/EN/TXT/HTML/?uri=CELEX:32012R0432
- [20] Vojvodić, S. (2025, May 2). Landscape of Herbal Food Supplements: Where Do We Stand with Health Claims? Nutrients 17(9), 1571. https://www.mdpi.com/2072-6643/17/9/1571
- [21] Food Safety and Standards Authority of India. (2026, April 1). Kind of business eligibility for licence and registration, updated 1 April 2026. FoSCoS. https://foscos.fssai.gov.in/assets/docs/Revised_2ndApril2026KindofBusinessEligibility.pdf
- [22] Consumer Affairs Agency, Japan. (2026, August 27). Summary of the press conference of Commissioner Horii, 27 August 2026 (in Japanese). https://www.caa.go.jp/notice/statement/horii/047350.html
- [23] Elysium Health. (2026). Balance: menopause and perimenopause supplement. Company website, accessed 5 November 2026. https://www.elysiumhealth.com/products/balance
- [24] Winona. (2026, July 21). Menopause telehealth leader Winona launches line of supplements specifically formulated to help women navigate the menopause transition. Company press page. https://bywinona.com/media/press/winona-launches-menopause-supplement-line
- [25] NutraIngredients. (2026, October 22). Hormonal health supplement launches target women at every life stage. https://www.nutraingredients.com/Article/2026/10/22/hormonal-health-supplement-launches-target-women-at-every-life-stage/
- [26] Herbalife. (2026). Woman's Choice, 30 tablets. Herbalife India company website, accessed 5 November 2026. https://www.herbalife.com/en-in/u/products/womans-choice-30-tablets-127k
- [27] USANA Health Sciences, Inc. (2026). Thrive Menopause Support Pack. Company website, accessed 5 November 2026. https://www.usana.com/ux/cart/en-US/product/613-010100/thrive-menopause-support-pack
- [28] Nature's Sunshine Products, Inc. (2026). Natural Changes. Company website, accessed 5 November 2026. https://www.naturessunshine.com/product/natural-changes
Table of Content
- Key Takeaways
- Market Size and CAGR
- Top Growth Driver
- Fastest Growing Segment
- Leading Region
- Key Companies
- Emerging Opportunities
- Executive Summary
- Global Market Outlook
- Demand-side Trends
- Supply-side Trends
- Technology Roadmap Analysis
- Analysis and Recommendations
- Analyst Perspective (What is happening? Why now? What should investors know?)
- Key Questions Answered
- How large is the market?
- What is the CAGR?
- What are key trends?
- Which region dominates?
- Who are the leaders?
Read More...
- Market Overview
- Market Coverage / Taxonomy
- Market Definition / Scope / Limitations
- Research Methodology
- Chapter Orientation
- Analytical Lens and Working Hypotheses
- Market Structure, Signals, and Trend Drivers
- Benchmarking and Cross-market Comparability
- Market Sizing, Forecasting, and Opportunity Mapping
- Research Design and Evidence Framework
- Desk Research Programme (Secondary Evidence)
- Expert Input and Fieldwork (Primary Evidence)
- Tooling, Models, and Reference Databases
- Data Engineering and Model Build
- Quality Assurance and Audit Trail
- Market Background
- Market Dynamics (Drivers, Restraints, Opportunity, Trends)
- Scenario Forecast (Optimistic, Likely, Conservative)
- Impact Analysis
- AI Impact
- Sustainability Impact
- Regulatory Impact
- Technology Impact
- Consumer / Buyer Analysis
- Purchase Drivers
- Adoption Barriers
- Buyer Journey
- Opportunity Map Analysis
- Product Life Cycle Analysis
- Supply Chain Analysis
- Investment Feasibility Matrix
- Value Chain Analysis
- PESTLE and Porter's Analysis
- Regulatory Landscape
- Regional Parent Market Outlook
- Production and Consumption Statistics
- Import and Export Statistics
- Global Market Analysis and Forecast, 2021 to 2036
- Historical Market Size Value (USD Million) Analysis, 2021 to 2025
- Current and Future Market Size Value (USD Million) Projections, 2026 to 2036
- Y-o-Y Growth Trend Analysis
- Absolute $ Opportunity Analysis
- Global Market Pricing Analysis, 2021 to 2036
- Global Market Analysis and Forecast, By Product Type, 2021 to 2036
- Introduction / Key Findings
- Historical Market Size Value (USD Million) Analysis By Product Type, 2021 to 2025
- Current and Future Market Size Value (USD Million) Analysis and Forecast By Product Type, 2026 to 2036
- Vitamins and Minerals
- Herbal Supplements
- Amino Acids
- Probiotics
- Others
- Y-o-Y Growth Trend Analysis By Product Type, 2021 to 2025
- Absolute $ Opportunity Analysis By Product Type, 2026 to 2036
- Global Market Analysis and Forecast, By Form, 2021 to 2036
- Introduction / Key Findings
- Historical Market Size Value (USD Million) Analysis By Form, 2021 to 2025
- Current and Future Market Size Value (USD Million) Analysis and Forecast By Form, 2026 to 2036
- Tablets and Capsules
- Gummies and Chewables
- Powders
- Liquid Supplements
- Y-o-Y Growth Trend Analysis By Form, 2021 to 2025
- Absolute $ Opportunity Analysis By Form, 2026 to 2036
- Global Market Analysis and Forecast, By Application, 2021 to 2036
- Introduction / Key Findings
- Historical Market Size Value (USD Million) Analysis By Application, 2021 to 2025
- Current and Future Market Size Value (USD Million) Analysis and Forecast By Application, 2026 to 2036
- Menopausal Symptoms
- Thyroid Health
- Stress Management
- Reproductive Health and PCOS
- Weight Management
- Others
- Y-o-Y Growth Trend Analysis By Application, 2021 to 2025
- Absolute $ Opportunity Analysis By Application, 2026 to 2036
- Global Market Analysis and Forecast, By Sales Channel, 2021 to 2036
- Introduction / Key Findings
- Historical Market Size Value (USD Million) Analysis By Sales Channel, 2021 to 2025
- Current and Future Market Size Value (USD Million) Analysis and Forecast By Sales Channel, 2026 to 2036
- Store-Based Retail
- Online Retail
- Direct Selling
- Y-o-Y Growth Trend Analysis By Sales Channel, 2021 to 2025
- Absolute $ Opportunity Analysis By Sales Channel, 2026 to 2036
- Global Market Analysis and Forecast, By Region, 2021 to 2036
- Introduction
- Historical Market Size Value (USD Million) Analysis By Region, 2021 to 2025
- Current Market Size Value (USD Million) Analysis and Forecast By Region, 2026 to 2036
- North America
- Latin America
- Europe
- East Asia
- South Asia
- Oceania
- Middle East
- Africa
- Market Attractiveness Analysis By Region
- North America Market Analysis and Forecast, By Country, 2021 to 2036
- Historical Market Size Value (USD Million) Trend Analysis By Market Taxonomy, 2021 to 2025
- Market Size Value (USD Million) Forecast By Market Taxonomy, 2026 to 2036
- By Country
- By Product Type
- By Form
- By Application
- By Sales Channel
- Market Attractiveness Analysis
- By Country
- By Product Type
- By Form
- By Application
- By Sales Channel
- Key Takeaways
- Latin America Market Analysis and Forecast, By Country
- Historical Market Size Value (USD Million) Trend Analysis By Market Taxonomy, 2021 to 2025
- Market Size Value (USD Million) Forecast By Market Taxonomy, 2026 to 2036
- By Country
- By Product Type
- By Form
- By Application
- By Sales Channel
- Market Attractiveness Analysis
- By Country
- By Product Type
- By Form
- By Application
- By Sales Channel
- Key Takeaways
- Europe Market Analysis and Forecast, By Country
- Historical Market Size Value (USD Million) Trend Analysis By Market Taxonomy, 2021 to 2025
- Market Size Value (USD Million) Forecast By Market Taxonomy, 2026 to 2036
- By Country
- By Product Type
- By Form
- By Application
- By Sales Channel
- Market Attractiveness Analysis
- By Country
- By Product Type
- By Form
- By Application
- By Sales Channel
- Key Takeaways
- East Asia Market Analysis and Forecast, By Country
- Historical Market Size Value (USD Million) Trend Analysis By Market Taxonomy, 2021 to 2025
- Market Size Value (USD Million) Forecast By Market Taxonomy, 2026 to 2036
- By Country
- By Product Type
- By Form
- By Application
- By Sales Channel
- Market Attractiveness Analysis
- By Country
- By Product Type
- By Form
- By Application
- By Sales Channel
- Key Takeaways
- South Asia Market Analysis and Forecast, By Country
- Historical Market Size Value (USD Million) Trend Analysis By Market Taxonomy, 2021 to 2025
- Market Size Value (USD Million) Forecast By Market Taxonomy, 2026 to 2036
- By Country
- By Product Type
- By Form
- By Application
- By Sales Channel
- Market Attractiveness Analysis
- By Country
- By Product Type
- By Form
- By Application
- By Sales Channel
- Key Takeaways
- Oceania Market Analysis and Forecast, By Country
- Historical Market Size Value (USD Million) Trend Analysis By Market Taxonomy, 2021 to 2025
- Market Size Value (USD Million) Forecast By Market Taxonomy, 2026 to 2036
- By Country
- By Product Type
- By Form
- By Application
- By Sales Channel
- Market Attractiveness Analysis
- By Country
- By Product Type
- By Form
- By Application
- By Sales Channel
- Key Takeaways
- Middle East Market Analysis and Forecast, By Country
- Historical Market Size Value (USD Million) Trend Analysis By Market Taxonomy, 2021 to 2025
- Market Size Value (USD Million) Forecast By Market Taxonomy, 2026 to 2036
- By Country
- By Product Type
- By Form
- By Application
- By Sales Channel
- Market Attractiveness Analysis
- By Country
- By Product Type
- By Form
- By Application
- By Sales Channel
- Key Takeaways
- Africa Market Analysis and Forecast, By Country
- Historical Market Size Value (USD Million) Trend Analysis By Market Taxonomy, 2021 to 2025
- Market Size Value (USD Million) Forecast By Market Taxonomy, 2026 to 2036
- By Country
- India
- China
- United States
- Germany
- Japan
- By Product Type
- By Form
- By Application
- By Sales Channel
- By Country
- Market Attractiveness Analysis
- By Country
- By Product Type
- By Form
- By Application
- By Sales Channel
- Key Takeaways
- Key Countries Market Analysis
- United States
- Pricing Analysis
- Market Share Analysis, 2025
- By Product Type
- By Form
- By Application
- By Sales Channel
- Germany
- Pricing Analysis
- Market Share Analysis, 2025
- By Product Type
- By Form
- By Application
- By Sales Channel
- India
- Pricing Analysis
- Market Share Analysis, 2025
- By Product Type
- By Form
- By Application
- By Sales Channel
- China
- Pricing Analysis
- Market Share Analysis, 2025
- By Product Type
- By Form
- By Application
- By Sales Channel
- Japan
- Pricing Analysis
- Market Share Analysis, 2025
- By Product Type
- By Form
- By Application
- By Sales Channel
- United States
- Market Structure Analysis
- Competition Dashboard
- Competition Benchmarking
- Market Share Analysis of Top Players
- By Regional
- By Product Type
- By Form
- By Application
- By Sales Channel
- Emerging Startups
- Innovation Benchmarking
- Competition Analysis
- Competition Deep Dive
- Herbalife Ltd.
- Overview
- Product Portfolio
- Profitability by Market Segments
- Sales Footprint
- Strategy Overview
- Marketing Strategy
- Product Strategy
- Channel Strategy
- USANA Health Sciences, Inc.
- Nature's Sunshine Products, Inc.
- Elysium Health, Inc.
- i-Health, Inc.
- Herbalife Ltd.
- Case Studies
- Success Stories
- Recent Developments
- Competition Deep Dive
- Assumptions & Acronyms Used
List of Tables
- Table 1: Global Market Value (USD Million) Forecast by Region, 2021 to 2036
- Table 2: Global Market Value (USD Million) Forecast by Product Type, 2021 to 2036
- Table 3: Global Market Value (USD Million) Forecast by Form, 2021 to 2036
- Table 4: Global Market Value (USD Million) Forecast by Application, 2021 to 2036
- Table 5: Global Market Value (USD Million) Forecast by Sales Channel, 2021 to 2036
- Table 6: North America Market Value (USD Million) Forecast by Country, 2021 to 2036
- Table 7: North America Market Value (USD Million) Forecast by Product Type, 2021 to 2036
- Table 8: North America Market Value (USD Million) Forecast by Form, 2021 to 2036
- Table 9: North America Market Value (USD Million) Forecast by Application, 2021 to 2036
- Table 10: North America Market Value (USD Million) Forecast by Sales Channel, 2021 to 2036
- Table 11: Latin America Market Value (USD Million) Forecast by Country, 2021 to 2036
- Table 12: Latin America Market Value (USD Million) Forecast by Product Type, 2021 to 2036
- Table 13: Latin America Market Value (USD Million) Forecast by Form, 2021 to 2036
- Table 14: Latin America Market Value (USD Million) Forecast by Application, 2021 to 2036
- Table 15: Latin America Market Value (USD Million) Forecast by Sales Channel, 2021 to 2036
- Table 16: Europe Market Value (USD Million) Forecast by Country, 2021 to 2036
- Table 17: Europe Market Value (USD Million) Forecast by Product Type, 2021 to 2036
- Table 18: Europe Market Value (USD Million) Forecast by Form, 2021 to 2036
- Table 19: Europe Market Value (USD Million) Forecast by Application, 2021 to 2036
- Table 20: Europe Market Value (USD Million) Forecast by Sales Channel, 2021 to 2036
- Table 21: East Asia Market Value (USD Million) Forecast by Country, 2021 to 2036
- Table 22: East Asia Market Value (USD Million) Forecast by Product Type, 2021 to 2036
- Table 23: East Asia Market Value (USD Million) Forecast by Form, 2021 to 2036
- Table 24: East Asia Market Value (USD Million) Forecast by Application, 2021 to 2036
- Table 25: East Asia Market Value (USD Million) Forecast by Sales Channel, 2021 to 2036
- Table 26: South Asia Market Value (USD Million) Forecast by Country, 2021 to 2036
- Table 27: South Asia Market Value (USD Million) Forecast by Product Type, 2021 to 2036
- Table 28: South Asia Market Value (USD Million) Forecast by Form, 2021 to 2036
- Table 29: South Asia Market Value (USD Million) Forecast by Application, 2021 to 2036
- Table 30: South Asia Market Value (USD Million) Forecast by Sales Channel, 2021 to 2036
- Table 31: Oceania Market Value (USD Million) Forecast by Country, 2021 to 2036
- Table 32: Oceania Market Value (USD Million) Forecast by Product Type, 2021 to 2036
- Table 33: Oceania Market Value (USD Million) Forecast by Form, 2021 to 2036
- Table 34: Oceania Market Value (USD Million) Forecast by Application, 2021 to 2036
- Table 35: Oceania Market Value (USD Million) Forecast by Sales Channel, 2021 to 2036
- Table 36: Middle East Market Value (USD Million) Forecast by Country, 2021 to 2036
- Table 37: Middle East Market Value (USD Million) Forecast by Product Type, 2021 to 2036
- Table 38: Middle East Market Value (USD Million) Forecast by Form, 2021 to 2036
- Table 39: Middle East Market Value (USD Million) Forecast by Application, 2021 to 2036
- Table 40: Middle East Market Value (USD Million) Forecast by Sales Channel, 2021 to 2036
- Table 41: Africa Market Value (USD Million) Forecast by Country, 2021 to 2036
- Table 42: Africa Market Value (USD Million) Forecast by Product Type, 2021 to 2036
- Table 43: Africa Market Value (USD Million) Forecast by Form, 2021 to 2036
- Table 44: Africa Market Value (USD Million) Forecast by Application, 2021 to 2036
- Table 45: Africa Market Value (USD Million) Forecast by Sales Channel, 2021 to 2036
List of Figures
- Figure 1: Global Market Pricing Analysis
- Figure 2: Global Market Value (USD Million) Forecast 2021-2036
- Figure 3: Global Market Value Share and BPS Analysis by Product Type, 2026 and 2036
- Figure 4: Global Market Y-o-Y Growth Comparison by Product Type, 2026-2036
- Figure 5: Global Market Attractiveness Analysis by Product Type
- Figure 6: Global Market Value Share and BPS Analysis by Form, 2026 and 2036
- Figure 7: Global Market Y-o-Y Growth Comparison by Form, 2026-2036
- Figure 8: Global Market Attractiveness Analysis by Form
- Figure 9: Global Market Value Share and BPS Analysis by Application, 2026 and 2036
- Figure 10: Global Market Y-o-Y Growth Comparison by Application, 2026-2036
- Figure 11: Global Market Attractiveness Analysis by Application
- Figure 12: Global Market Value Share and BPS Analysis by Sales Channel, 2026 and 2036
- Figure 13: Global Market Y-o-Y Growth Comparison by Sales Channel, 2026-2036
- Figure 14: Global Market Attractiveness Analysis by Sales Channel
- Figure 15: Global Market Value (USD Million) Share and BPS Analysis by Region, 2026 and 2036
- Figure 16: Global Market Y-o-Y Growth Comparison by Region, 2026-2036
- Figure 17: Global Market Attractiveness Analysis by Region
- Figure 18: North America Market Incremental Dollar Opportunity, 2026-2036
- Figure 19: Latin America Market Incremental Dollar Opportunity, 2026-2036
- Figure 20: Europe Market Incremental Dollar Opportunity, 2026-2036
- Figure 21: East Asia Market Incremental Dollar Opportunity, 2026-2036
- Figure 22: South Asia Market Incremental Dollar Opportunity, 2026-2036
- Figure 23: Oceania Market Incremental Dollar Opportunity, 2026-2036
- Figure 24: Middle East Market Incremental Dollar Opportunity, 2026-2036
- Figure 25: Africa Market Incremental Dollar Opportunity, 2026-2036
- Figure 26: North America Market Value Share and BPS Analysis by Country, 2026 and 2036
- Figure 27: North America Market Value Share and BPS Analysis by Product Type, 2026 and 2036
- Figure 28: North America Market Y-o-Y Growth Comparison by Product Type, 2026-2036
- Figure 29: North America Market Attractiveness Analysis by Product Type
- Figure 30: North America Market Value Share and BPS Analysis by Form, 2026 and 2036
- Figure 31: North America Market Y-o-Y Growth Comparison by Form, 2026-2036
- Figure 32: North America Market Attractiveness Analysis by Form
- Figure 33: North America Market Value Share and BPS Analysis by Application, 2026 and 2036
- Figure 34: North America Market Y-o-Y Growth Comparison by Application, 2026-2036
- Figure 35: North America Market Attractiveness Analysis by Application
- Figure 36: North America Market Value Share and BPS Analysis by Sales Channel, 2026 and 2036
- Figure 37: North America Market Y-o-Y Growth Comparison by Sales Channel, 2026-2036
- Figure 38: North America Market Attractiveness Analysis by Sales Channel
- Figure 39: Latin America Market Value Share and BPS Analysis by Country, 2026 and 2036
- Figure 40: Latin America Market Value Share and BPS Analysis by Product Type, 2026 and 2036
- Figure 41: Latin America Market Y-o-Y Growth Comparison by Product Type, 2026-2036
- Figure 42: Latin America Market Attractiveness Analysis by Product Type
- Figure 43: Latin America Market Value Share and BPS Analysis by Form, 2026 and 2036
- Figure 44: Latin America Market Y-o-Y Growth Comparison by Form, 2026-2036
- Figure 45: Latin America Market Attractiveness Analysis by Form
- Figure 46: Latin America Market Value Share and BPS Analysis by Application, 2026 and 2036
- Figure 47: Latin America Market Y-o-Y Growth Comparison by Application, 2026-2036
- Figure 48: Latin America Market Attractiveness Analysis by Application
- Figure 49: Latin America Market Value Share and BPS Analysis by Sales Channel, 2026 and 2036
- Figure 50: Latin America Market Y-o-Y Growth Comparison by Sales Channel, 2026-2036
- Figure 51: Latin America Market Attractiveness Analysis by Sales Channel
- Figure 52: Europe Market Value Share and BPS Analysis by Country, 2026 and 2036
- Figure 53: Europe Market Value Share and BPS Analysis by Product Type, 2026 and 2036
- Figure 54: Europe Market Y-o-Y Growth Comparison by Product Type, 2026-2036
- Figure 55: Europe Market Attractiveness Analysis by Product Type
- Figure 56: Europe Market Value Share and BPS Analysis by Form, 2026 and 2036
- Figure 57: Europe Market Y-o-Y Growth Comparison by Form, 2026-2036
- Figure 58: Europe Market Attractiveness Analysis by Form
- Figure 59: Europe Market Value Share and BPS Analysis by Application, 2026 and 2036
- Figure 60: Europe Market Y-o-Y Growth Comparison by Application, 2026-2036
- Figure 61: Europe Market Attractiveness Analysis by Application
- Figure 62: Europe Market Value Share and BPS Analysis by Sales Channel, 2026 and 2036
- Figure 63: Europe Market Y-o-Y Growth Comparison by Sales Channel, 2026-2036
- Figure 64: Europe Market Attractiveness Analysis by Sales Channel
- Figure 65: East Asia Market Value Share and BPS Analysis by Country, 2026 and 2036
- Figure 66: East Asia Market Value Share and BPS Analysis by Product Type, 2026 and 2036
- Figure 67: East Asia Market Y-o-Y Growth Comparison by Product Type, 2026-2036
- Figure 68: East Asia Market Attractiveness Analysis by Product Type
- Figure 69: East Asia Market Value Share and BPS Analysis by Form, 2026 and 2036
- Figure 70: East Asia Market Y-o-Y Growth Comparison by Form, 2026-2036
- Figure 71: East Asia Market Attractiveness Analysis by Form
- Figure 72: East Asia Market Value Share and BPS Analysis by Application, 2026 and 2036
- Figure 73: East Asia Market Y-o-Y Growth Comparison by Application, 2026-2036
- Figure 74: East Asia Market Attractiveness Analysis by Application
- Figure 75: East Asia Market Value Share and BPS Analysis by Sales Channel, 2026 and 2036
- Figure 76: East Asia Market Y-o-Y Growth Comparison by Sales Channel, 2026-2036
- Figure 77: East Asia Market Attractiveness Analysis by Sales Channel
- Figure 78: South Asia Market Value Share and BPS Analysis by Country, 2026 and 2036
- Figure 79: South Asia Market Value Share and BPS Analysis by Product Type, 2026 and 2036
- Figure 80: South Asia Market Y-o-Y Growth Comparison by Product Type, 2026-2036
- Figure 81: South Asia Market Attractiveness Analysis by Product Type
- Figure 82: South Asia Market Value Share and BPS Analysis by Form, 2026 and 2036
- Figure 83: South Asia Market Y-o-Y Growth Comparison by Form, 2026-2036
- Figure 84: South Asia Market Attractiveness Analysis by Form
- Figure 85: South Asia Market Value Share and BPS Analysis by Application, 2026 and 2036
- Figure 86: South Asia Market Y-o-Y Growth Comparison by Application, 2026-2036
- Figure 87: South Asia Market Attractiveness Analysis by Application
- Figure 88: South Asia Market Value Share and BPS Analysis by Sales Channel, 2026 and 2036
- Figure 89: South Asia Market Y-o-Y Growth Comparison by Sales Channel, 2026-2036
- Figure 90: South Asia Market Attractiveness Analysis by Sales Channel
- Figure 91: Oceania Market Value Share and BPS Analysis by Country, 2026 and 2036
- Figure 92: Oceania Market Value Share and BPS Analysis by Product Type, 2026 and 2036
- Figure 93: Oceania Market Y-o-Y Growth Comparison by Product Type, 2026-2036
- Figure 94: Oceania Market Attractiveness Analysis by Product Type
- Figure 95: Oceania Market Value Share and BPS Analysis by Form, 2026 and 2036
- Figure 96: Oceania Market Y-o-Y Growth Comparison by Form, 2026-2036
- Figure 97: Oceania Market Attractiveness Analysis by Form
- Figure 98: Oceania Market Value Share and BPS Analysis by Application, 2026 and 2036
- Figure 99: Oceania Market Y-o-Y Growth Comparison by Application, 2026-2036
- Figure 100: Oceania Market Attractiveness Analysis by Application
- Figure 101: Oceania Market Value Share and BPS Analysis by Sales Channel, 2026 and 2036
- Figure 102: Oceania Market Y-o-Y Growth Comparison by Sales Channel, 2026-2036
- Figure 103: Oceania Market Attractiveness Analysis by Sales Channel
- Figure 104: Middle East Market Value Share and BPS Analysis by Country, 2026 and 2036
- Figure 105: Middle East Market Value Share and BPS Analysis by Product Type, 2026 and 2036
- Figure 106: Middle East Market Y-o-Y Growth Comparison by Product Type, 2026-2036
- Figure 107: Middle East Market Attractiveness Analysis by Product Type
- Figure 108: Middle East Market Value Share and BPS Analysis by Form, 2026 and 2036
- Figure 109: Middle East Market Y-o-Y Growth Comparison by Form, 2026-2036
- Figure 110: Middle East Market Attractiveness Analysis by Form
- Figure 111: Middle East Market Value Share and BPS Analysis by Application, 2026 and 2036
- Figure 112: Middle East Market Y-o-Y Growth Comparison by Application, 2026-2036
- Figure 113: Middle East Market Attractiveness Analysis by Application
- Figure 114: Middle East Market Value Share and BPS Analysis by Sales Channel, 2026 and 2036
- Figure 115: Middle East Market Y-o-Y Growth Comparison by Sales Channel, 2026-2036
- Figure 116: Middle East Market Attractiveness Analysis by Sales Channel
- Figure 117: Africa Market Value Share and BPS Analysis by Country, 2026 and 2036
- Figure 118: Africa Market Value Share and BPS Analysis by Product Type, 2026 and 2036
- Figure 119: Africa Market Y-o-Y Growth Comparison by Product Type, 2026-2036
- Figure 120: Africa Market Attractiveness Analysis by Product Type
- Figure 121: Africa Market Value Share and BPS Analysis by Form, 2026 and 2036
- Figure 122: Africa Market Y-o-Y Growth Comparison by Form, 2026-2036
- Figure 123: Africa Market Attractiveness Analysis by Form
- Figure 124: Africa Market Value Share and BPS Analysis by Application, 2026 and 2036
- Figure 125: Africa Market Y-o-Y Growth Comparison by Application, 2026-2036
- Figure 126: Africa Market Attractiveness Analysis by Application
- Figure 127: Africa Market Value Share and BPS Analysis by Sales Channel, 2026 and 2036
- Figure 128: Africa Market Y-o-Y Growth Comparison by Sales Channel, 2026-2036
- Figure 129: Africa Market Attractiveness Analysis by Sales Channel
- Figure 130: Global Market - Tier Structure Analysis
- Figure 131: Global Market - Company Share Analysis
Frequently Asked Questions
How big is the Hormonal Health Supplements Market in 2026?
FMI estimates the market at USD 3,500.0 million in 2026, up from USD 3,300.0 million in 2025. It is forecast to reach USD 6,390.0 million by 2036 at a 6.2% CAGR.
Which product type leads the Hormonal Health Supplements Market in 2026?
Vitamins and minerals lead with 40.0% by product type, while herbal supplements, amino acids, probiotics and others together hold 60.0%.
Which application leads in 2026?
Menopausal symptom products lead with 30.0% by application, ahead of thyroid, stress, reproductive health and weight management.
Which country is forecast to grow fastest through 2036?
India has the highest forecast CAGR among the profiled countries at 7.6% during 2026 to 2036, followed by China at 6.8%.
Is ashwagandha banned?
Not globally: Denmark bans it outright in food supplements, while the United States and the EU as a whole do not [4], and Germany's risk assessment body advises some groups to avoid it [3].
Preview the report firsthand - request a free sample
Get SampleGet the brochure for pricing and purchase details.
Get PDF
