Cellular Health Supplement Market Size and Share Forecast Outlook 2025 to 2035

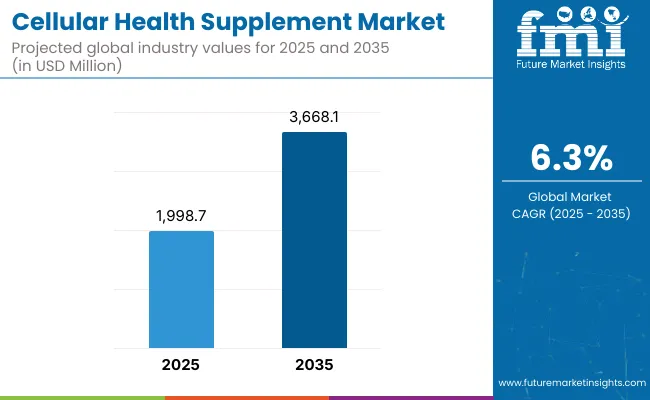
The Cellular Health Supplement Market is expected to record a valuation of USD 1,998.7 million in 2025 and USD 3,668.1 million in 2035, marking a rise of USD 1,669.4 million, which equals a growth of 77% over the decade. This expansion represents a compound annual growth rate (CAGR) of 6.3% and reflects a 1.83X increase in market size.
Quick Stats for Cellular Health Supplement Market

  • Cellular Health Supplement Market Value (2025): USD 1,998.7 million
  • Cellular Health Supplement Market Forecast Value (2035): USD 3,668.1 million
  • Cellular Health Supplement Market Forecast CAGR (2025 to 2035): 6.3%
  • Leading Segment in Cellular Health Supplement Market in 2025: NAD⁺ Precursors (42%)
  • Key Growth Regions in the Cellular Health Supplement Market: Asia-Pacific, North America, Europe
  • Top Key Players in Cellulsar Health Supplement Market: TruNiagen (ChromaDex), Elysium Health, Thorne, Life Extension, HUM Nutrition, NOW Foods, Doctor’s Best, Jarrow Formulas, GNC, Gundry MD

Cellular Health Supplement Market

Cellular Health Supplement Market Key Takeaways

Metric Value
Market Estimated Value in (2025E) USD 1,998.7 million
Market Forecast Value in (2035F) USD 3,668.1 million
Forecast CAGR (2025 to 2035) 6.3%

During the first half of the forecast period, from 2025 to 2030, the market is anticipated to grow from USD 1,998.7 million to USD 2,652 million, adding nearly USD 654 million, which accounts for 43% of the total decade growth.

This growth phase is likely to be driven by heightened clinical interest in mitochondrial health and accelerated uptake across digital-first nutraceutical platforms. Early adoption has been facilitated by health-literate consumers in North America and Asia, supported by scientific publications that validate cellular function markers.

The second half, from 2030 to 2035, is projected to contribute an additional USD 886 million, equating to 57% of total growth. The shift is expected to be influenced by precision diagnostics, personalized supplement stacks, and multi-ingredient synergy innovations tailored to individual cellular profiles.

Advanced delivery formats and software-driven regimen tracking tools are expected to raise adherence levels, thus increasing per capita intake volumes and improving lifetime customer value for brands.

Between 2020 and 2024, the Cellular Health Supplement Market scaled steadily, laying the groundwork for an estimated USD 1,998.7 million valuation in 2025. Growth was propelled by rising awareness of mitochondrial decline, NAD⁺ biology, and cellular resilience pathways. Ingredient-led brand differentiation, particularly within NAD⁺ boosters and polyphenols, defined early market leadership.

During this phase, hardware-centric legacy strategies were replaced by integrated digital ecosystems. Software-enabled platforms tracking biomarkers and guiding supplement regimens began capturing user attention, though they contributed under 10% to the revenue mix.

By 2035, market demand is forecasted to reach USD 3.67 billion, with innovation accelerating through AI-based personalization, subscription DTC platforms, and diagnostics-linked formulations. Competitive advantage is expected to be earned through precision, clinical trust, and ecosystem scalability where formulation alone will no longer suffice.

Why the Cellular Health Supplement Market is growing?

Growth in the Cellular Health Supplement Market is being driven by rising scientific validation around cellular aging, mitochondrial dysfunction, and oxidative stress as root causes of chronic health decline. Greater awareness of longevity pathways such as AMPK, mTOR, and sirtuins has been created through academic publications and wellness media, prompting demand for preventive bioactive interventions. Consumer behavior has shifted toward proactive aging and vitality management, supported by expanding access to diagnostic tools that assess cellular biomarkers.

Trust has been reinforced by clinical research supporting NAD+ precursors, polyphenols, and mitochondrial enhancers. Supplement formulations have been increasingly integrated into holistic wellness protocols via direct-to-consumer models and practitioner channels.

Functional food convergence and digital health tracking have accelerated recurring usage. Regulatory bodies have gradually clarified frameworks for health claims, enabling more consistent product positioning. As ingredient innovation and personalized nutrition advance, continued growth is expected to be sustained across both developed and emerging wellness-focused economies.

Segmental Analysis

The Cellular Health Supplement Market has been segmented across key dimensions to reflect diverse demand drivers and functional priorities. Ingredient types have been categorized into NAD+ precursors, CoQ10 & PQQ, polyphenols, and broader antioxidant bioactives, each targeting distinct cellular mechanisms.

From a health function standpoint, segmentation has been structured around longevity, energy metabolism, cognitive performance, cardiovascular stability, immune modulation, and metabolic support. In terms of product format, market share has been distributed among capsules, softgels, powders, liquids, and gummies, aligning with evolving consumer preferences for convenience, bioavailability, and formulation compatibility.

This multidimensional segmentation has enabled stakeholders to tailor strategies by biological need-state, ingredient efficacy, and delivery innovation positioning the category as one of the most personalized and functionally targeted in the broader nutraceutical landscape.
Insights into the Ingredient Type Segment with NAD+ Precursors and Antioxidants Leading

Cellular Health Supplement Market By Ingrediant

Ingredient Type Market Value Share, 2025
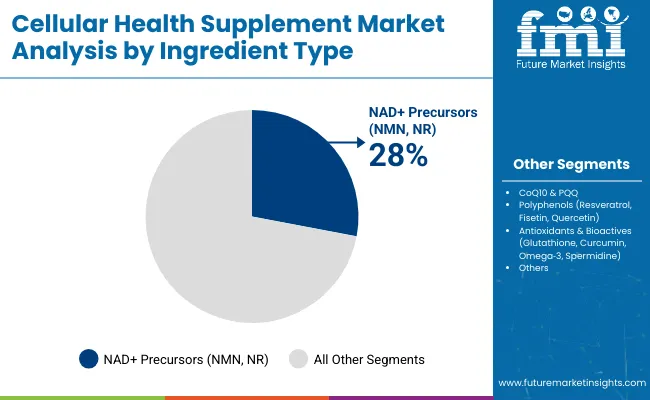
NAD+ Precursors (NMN, NR) 28%
CoQ10 & PQQ 22%
Polyphenols (Resveratrol, Fisetin, Quercetin) 18%
Other Antioxidants & Bioactives (Glutathione, Curcumin, Omega 3, Spermidine) 32%

The ingredient landscape has been led by NAD+ precursors, which are projected to capture 28% of market value by 2025. Their dominance has been reinforced by evidence linking NAD+ levels with mitochondrial energy, DNA repair, and sirtuin activation.

Polyphenols including resveratrol, quercetin, and fisetin have also witnessed elevated inclusion rates due to their senolytic and anti-inflammatory effects. Meanwhile, broader antioxidant and bioactive groups, comprising glutathione, curcumin, omega-3s, and spermidine, have collectively captured the largest share at 32%.

These formulations have been favored for their multi-pathway action across oxidative stress reduction, inflammation management, and membrane integrity. CoQ10 and PQQ, contributing 22%, have sustained demand due to their roles in ATP synthesis and cellular redox cycling. As novel bioactives gain regulatory approval and clinical validation, continuous portfolio optimization is expected across this segment.
Insights into the Health Function Segment with Longevity and Mitochondrial Support Driving Demand

Cellular Health Supplement Market By Health

Health Function Value Share % 2025
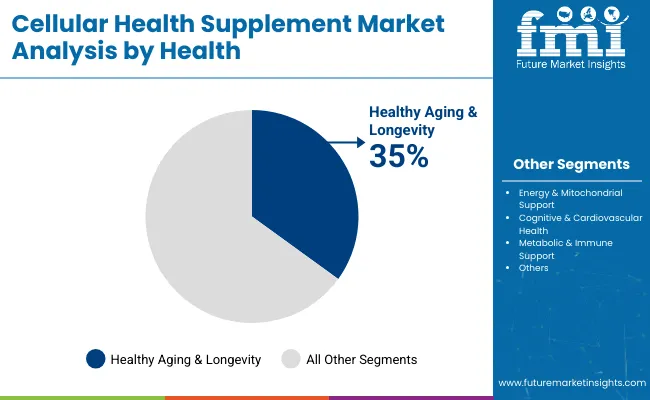
Healthy Aging & Longevity 35%
Energy & Mitochondrial Support 25%
Cognitive & Cardiovascular Health 20%
Metabolic & Immune Support 20%

In 2025, Healthy Aging & Longevity is forecasted to account for 35% of the total market value, driven by widespread interest in biological age reversal and healthspan optimization. Cellular supplements have been increasingly adopted as core interventions in longevity routines, fueled by consumer interest in NAD+ repletion, autophagy activation, and telomere maintenance.

Energy and mitochondrial support are expected to capture 25%, with demand being fueled by rising fatigue-related conditions and increased public understanding of mitochondrial dysfunction. Cognitive and cardiovascular health, contributing 20%, have gained relevance through aging-related cognitive decline and endothelial stress.

Immune and metabolic support have jointly held another 20%, driven by demand for homeostasis, metabolic flexibility, and defense against age-induced immunosenescence. As functional segmentation deepens, multi-claim formulations are projected to become the default, supporting cross-function wellness strategies.
Insights into the Product Format Segment with Capsules Dominating

Cellular Health Supplement Market By Product

Product Format Value Share % 2025
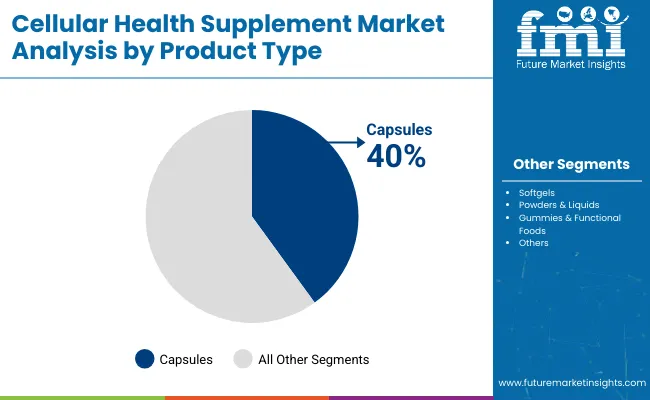
Capsules 40%
Softgels 25%
Powders & Liquids 20%
Gummies & Functional Foods 15%

Capsules have been projected to contribute 40% of market value by 2025, driven by their familiarity, dosing accuracy, and compatibility with both dry and microencapsulated ingredients. The format has been widely accepted among both retail consumers and clinicians for its ease of formulation and scalability.

Softgels, accounting for 25%, have remained popular for lipid-soluble compounds such as CoQ10 and omega-3s, offering improved bioavailability. Powders and liquids, comprising 20%, have been favored for customizable routines, often integrated into smoothies and health beverages.

Gummies and functional foods, capturing 15%, have gained traction among younger consumers and supplement-averse demographics. Despite lower market share, they have been identified as high-growth segments. As format innovation evolves around absorption kinetics and compliance enhancement, capsules and softgels are expected to retain dominance while emerging formats capture niche segments.

What are the Drivers, Restraints, and Key Trends of the Cellular Health Supplement Market?

Adoption of cellular health supplements has accelerated despite scientific complexity and consumer skepticism, as growing interest in longevity, mitochondrial renewal, and proactive aging continues to expand across functional nutrition, clinical wellness, and digital biomarker-linked supplement ecosystems worldwide.

Scientific Validation of NAD+ and Cellular Pathways

Rapid growth has been supported by increasing scientific validation surrounding NAD+ restoration, sirtuin activation, and autophagy as modifiable factors in cellular aging. These mechanisms have been prioritized in both academic research and commercial formulation pipelines.

Clinical trials have confirmed improvements in energy metabolism, DNA repair, and mitochondrial density driving practitioner endorsement and consumer confidence. Demand has been amplified by integrative medicine protocols and the rise of longevity clinics, where NAD+ boosters are increasingly being positioned as foundational interventions. As evidence-based marketing becomes a strategic differentiator, products backed by peer-reviewed data are expected to capture significant long-term market share.

Integration with Personalized Health Platforms

A major trend has been the integration of cellular health supplements into AI-driven personalized health ecosystems. Supplement recommendations have been increasingly guided by biomarker feedback, wearable data, and digital diagnostics. Platforms that link genetic predispositions to cellular pathways are being leveraged to enhance precision and user trust.

As longevity-focused consumers adopt bio-individual wellness strategies, personalization is expected to evolve from optional to essential. Brands capable of embedding cellular supplements into dynamic, feedback-loop-driven wellness plans are likely to gain competitive advantage, especially as real-time health optimization becomes a consumer expectation.
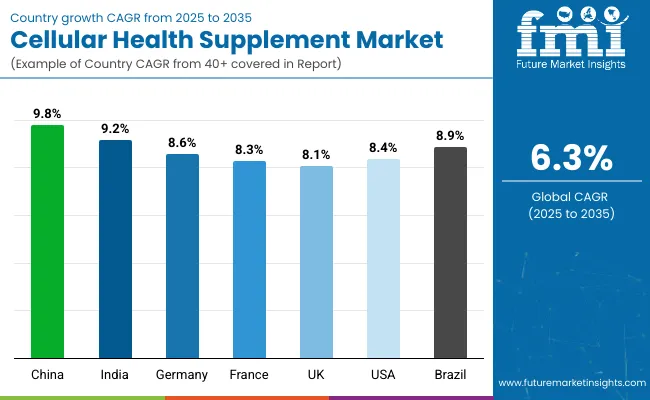
Analysis of Cellular Health Supplement Market By Key Countries

Cellular Health Supplement Market By Country

Countries CAGR
China 9.80%
India 9.20%
Germany 8.60%
France 8.30%
UK 8.10%
USA 8.40%
Brazil 8.90%

The global Cellular Health Supplement Market has exhibited varying adoption trajectories across major economies, shaped by demographic trends, healthcare innovation, and the regulatory environment surrounding preventive nutrition. Asia-Pacific has emerged as the fastest-growing region, led by China at a projected CAGR of 9.8% and India at 9.2% from 2025 to 2035.

This momentum has been driven by an aging population, rising chronic fatigue cases, and increased consumer education surrounding cellular energy and longevity. In China, widespread digital health integration and consumer trust in science-backed formulations have further propelled adoption, while India’s growth has been catalyzed by urban preventive health movements and expanding nutraceutical access through online retail.

Europe has maintained a strong outlook, anchored by Germany (8.6%), France (8.3%), and the UK (8.1%). Growth in these countries has been reinforced by clinical channel endorsements, aging demographics, and increased funding for longevity research. Preventive care integration into national health systems is expected to enhance adoption.

North America continues to demonstrate robust maturity, with the USA growing at 8.4% CAGR. Here, demand has been shaped by the integration of supplements into personalized longevity stacks and biohacking protocols. Brazil, growing at 8.9%, is expected to benefit from growing middle-class health consciousness and practitioner-led education.

Sales Outlook for Cellular Health Supplements in the United States

Year USA Cellular Health Supplement Market
2025 350
2026 379
2027 411
2028 445
2029 482
2030 522
2031 565
2032 612
2033 663
2034 719
2035 779

The Cellular Health Supplement Market in the United States is projected to grow at a CAGR of 8.4% from 2025 to 2035, supported by rising adoption of longevity interventions and bio-optimized nutritional strategies. Demand has been increasingly influenced by personalized wellness regimens, where supplements targeting mitochondrial health, NAD+ repletion, and telomere preservation are being prioritized.

Clinical practitioners have incorporated cellular supplements into anti-aging and integrative medicine protocols, while digital wellness platforms have enabled broad consumer access. Advanced diagnostics and wearable biomarker integrations have elevated personalized dosing models, which are expected to drive retention and repeat purchase behavior. Brands have been differentiating through third-party certifications, clinical study backing, and doctor-formulated positioning.

  • Longevity clinics and functional medicine practices have driven prescription-based uptake.
  • Digital health platforms have integrated cellular supplements into personalized wellness stacks.
  • Recurring revenue models have been strengthened through subscription-based DTC formulations.

Growth and Expansion Outlook for Cellular Health Supplement Market in the United Kingdom

The Cellular Health Supplement Market in the United Kingdom is projected to grow at a CAGR of 8.1% between 2025 and 2035, supported by high consumer awareness, an aging population, and the strong presence of evidence-backed nutraceutical brands. Demand has been reinforced by NHS-aligned preventive care campaigns and a rising shift toward clinically supervised longevity protocols. Practitioners have increasingly prescribed supplements focused on mitochondrial function and oxidative stress reduction.

Health-focused retail channels and digital-first supplement platforms have expanded accessibility, while compliance with EFSA claims has enhanced product trust. As personalization becomes embedded in consumer health journeys, cellular health supplements are expected to play a foundational role in maintaining vitality and reducing biological age markers.

  • EFSA-backed claims have strengthened trust in ingredient efficacy.
  • Preventive aging strategies have been incorporated into mainstream wellness routines.
  • Clinician-prescribed supplements are increasingly replacing generic multivitamins

Growth and Expansion Outlook for Cellular Health Supplement Market in India

The Cellular Health Supplement Market in India is expected to expand at a CAGR of 9.2% from 2025 to 2035, supported by rising urbanization, disposable income growth, and greater health literacy among younger demographics. Increased digital penetration has enabled broad access to longevity-focused supplements via online channels and DTC brands.

Practitioner-led awareness in Tier 1 cities and corporate wellness programs has accelerated early adoption. The shift from curative to preventive care has encouraged demand for NAD+ boosters, mitochondrial enhancers, and antioxidants. As Ayurveda-modern hybrid formulations gain popularity, global and domestic brands are expected to intensify portfolio localization strategies.

  • Online retail has expanded access to premium cellular health formulations.
  • Urban millennials and Gen Z have prioritized long-term healthspan.
  • Demand has been amplified by employer-sponsored wellness initiatives.

Sales Outlook for Cellular Health Supplement in China

China’s Cellular Health Supplement Market is forecasted to grow at a CAGR of 9.8%, making it the fastest-growing market globally from 2025 to 2035. Accelerated demand has been driven by aging demographics, high digital engagement, and strong consumer acceptance of science-backed nutraceuticals.

Cross-border e-commerce and regulatory facilitation under the “Blue Hat” registration have enabled market access for international brands. Cellular rejuvenation products have been actively promoted via influencer channels, health platforms, and biotech-aligned pharmacies. AI-based health monitoring apps are expected to play a growing role in supplement personalization. Clinical credibility and functional labeling will likely remain pivotal in long-term brand differentiation.

  • Digital health ecosystems have accelerated personalized supplement use.
  • Regulatory clarity has improved importation and compliance speed.
  • Longevity-focused platforms have aligned with national healthy aging agendas.

In-depth Analysis of Cellular Health Supplement in Germany

Countries 2025
UK 12%
Germany 18%
Italy 10%
France 14%
Spain 8%
BENELUX 7%
Nordic 6%
Rest of Europe 25%
Countries 2035
UK 13%
Germany 17%
Italy 10%
France 14%
Spain 9%
BENELUX 7%
Nordic 7%
Rest of Europe 23%

Germany’s Cellular Health Supplement Market is projected to grow at a CAGR of 8.6% between 2025 and 2035, driven by an aging population, widespread supplement literacy, and strong clinical integration of preventive nutrition. The market has been reinforced by practitioner-led adoption within naturopathy and integrative care clinics, where mitochondrial and antioxidant formulations have been positioned as foundational protocols.

Pharmacies and regulated e-commerce platforms have served as the primary channels for distribution, while trust in pharmacy-onlylabeling has bolstered premium positioning. Institutional R&D funding in longevity science is expected to expand innovation pipelines. EU-compliant claims and traceability standards will likely play a continued role in building consumer trust and brand loyalty.

  • Practitioner-led channels have supported therapeutic-grade positioning.
  • Premium pricing has been sustained by regulatory credibility and traceability.
  • Aging demographics have created stable demand for mitochondrial and senolytic products.

Growth Outlook for Cellular Health Supplement Market in Japan

Ingredient Type Japan Market Share 2025 (%)
NAD+ Precursors (NMN, NR) 42%
CoQ10 & PQQ 25%
Polyphenols (Resveratrol, Fisetin, Quercetin) 18%
Other Antioxidants & Bioactives (Glutathione, Curcumin, Omega 3) 15%

The Cellular Health Supplement Market in Japan is projected at USD 179.8 million in 2025. Ingredient adoption is led by NAD+ precursors at 42%, significantly ahead of CoQ10 & PQQ at 25%, underscoring Japan’s prioritization of mitochondrial health and energy optimization.

This leadership has been driven by widespread clinical education around NAD+ pathways and their direct link to aging biomarkers. CoQ10, already integrated into cardiovascular support routines, has sustained popularity due to its traditional alignment with Japanese heart health practices.

Polyphenols account for 18%, fueled by interest in anti-inflammatory and senolytic mechanisms, while broader antioxidant blends hold 15%, reflecting moderate uptake. Japanese consumers have favored ingredients backed by peer-reviewed trials and precision-formulated products tailored to individual genetic and metabolic profiles. As personalized supplementation and smart diagnostics gain momentum, further growth in NAD+ formulations is expected.

  • Japan holds a significant regional share of the global market by 2025
  • NAD+ Precursors lead at 42%, far ahead of other ingredient groups
  • Growth is supported by integration into longevity clinics and digital health tools

Opportunity Analysis of South Korea Cellular Health Supplement Market

Health Function South Korea Market Share 2025 (%)
Healthy Aging & Longevity 38%
Energy & Mitochondrial Support 27%
Cognitive & Cardiovascular Health 20%
Metabolic & Immune Support 15%

The Cellular Health Supplement Market in South Korea is expected to reflect highly specialized demand across longevity and energy-related functions. In 2025, Healthy Aging & Longevity is projected to lead at 38%, supported by the nation’s advanced aging demographics and the strong cultural alignment with long-term wellness.

Government-backed health education and integration with anti-aging clinics have reinforced consumer confidence in cellular-level interventions targeting biological age and mitochondrial decline.

Energy & Mitochondrial Support, contributing 27%, has been prioritized due to rising urban fatigue, workplace burnout, and competitive academic environments. Cognitive and cardiovascular support, holding 20%, has seen growing relevance through stress-related neurovascular issues among working-age adults. Metabolic and immune support comprises 15%, sustained by functional formulations targeting insulin sensitivity and immune resilience.

  • South Korea holds a specialized profile driven by aging and fatigue-related health concerns
  • Healthy aging dominates at 38%, followed closely by energy and mitochondrial enhancement
  • Adoption is powered by health tech integration and clinic-backed supplementation models

Competitive Landscape of Cellular Health Supplement Market

Global pioneers Global Value Share 2025
Tru Niagen ( ChromaDex ) 4.5%
Others 95.5%

The Cellular Health Supplement Market is moderately fragmented, with multinational brands, clinical-grade formulators, and DTC wellness specialists competing across ingredient categories and distribution models. Global pioneers such as ChromaDex (TruNiagen), Thorne, and Life Extension have been recognized for their science-backed formulations, clinical trial visibility, and early investments in NAD+ and mitochondrial support segments. Their strategies have emphasized evidence-based claims, personalized stack integration, and physician-channel partnerships, particularly in North America and parts of Asia.

Established mid-sized players such as NOW Foods, Jarrow Formulas, and Doctor’s Best have catered to value-driven and retail-oriented consumer segments. These brands have been favored for their broad ingredient portfolios, strong Amazon presence, and reliability among budget-conscious buyers. Growth has been supported through third-party certifications and transparent sourcing.

Specialist DTC brands such as Elysium Health, HUM Nutrition, and Gundry MD have built differentiation via personalization, subscription models, and digital biomarker feedback systems. Their ability to link cellular supplements to broader lifestyle goals has allowed for stronger engagement among younger, tech-savvy audiences.

Key Developments in Cellular Health Supplement Market

  • In March 2025, ChromaDex Corp. was officially rebranded as Niagen Bioscience, Inc., and began trading under the new ticker “NAGE” on Nasdaq. The move was positioned to reflect greater dedication to NAD⁺ research and healthy‑aging science, underscoring a strategic shift toward bioscience innovation.
  • In May 2025, Niagen Bioscience secured an exclusive license from Haukeland University Hospital to develop its patented nicotinamide riboside (NR) as a potential Parkinson’s disease therapeutic. This milestone signaled a transition from supplement design toward regulated drug development for degenerative neurological conditions.

Scope of the Report

Item Value
Quantitative Units USD 1,998 Million
Component Ingredients (NAD+ Precursors, CoQ10, Polyphenols, Antioxidants), Delivery Systems (Capsules, Softgels, Powders, Liquids, Gummies), Diagnostics Integration (Biomarker-driven platforms, Genomic Nutrition Tools)
Health Function Healthy Aging & Longevity, Energy & Mitochondrial Support, Cognitive & Cardiovascular Health, Metabolic & Immune Support
Product Format Capsules, Tablets, Softgels, Powders, Liquid Formulations, Gummies, Functional Foods & Beverages
Application Healthy Aging, Energy & Vitality, Cognitive Health, Cardiovascular Health, Metabolic Health, Immune Support
Sales Channel Pharmacies & Drugstores, Health & Nutrition Stores, Online Retail, Direct to Consumer (DTC) Brands, Practitioner / Clinic Distribution
Regions Covered North America, Europe, Asia-Pacific, Latin America, Middle East & Africa
Countries Covered United States, Canada, Germany, France, United Kingdom, China, Japan, India, Brazil, South Korea
Key Companies Profiled Elysium Health, Tru Niagen (ChromaDex), Life Extension, Thorne, Gundry MD, GNC, NOW Foods, Doctor’s Best, Jarrow Formulas, HUM Nutrition

Key Segments

By Ingredient Type:

  • NAD+ Precursors (NMN, NR)
  • CoQ10
  • PQQ (Pyrroloquinoline Quinone)
  • Alpha‑Lipoic Acid
  • L‑Carnitine
  • Resveratrol
  • Quercetin
  • Fisetin
  • Curcumin
  • Astaxanthin
  • Omega‑3 Fatty Acids
  • Phospholipids (Phosphatidylcholine, Phosphatidylserine)

By Health Function:

  • Mitochondrial Support & Energy Production
  • Antioxidant Protection & Oxidative Stress Reduction
  • DNA Repair & Telomere Support
  • Cellular Signaling & Longevity Pathways (AMPK, mTOR, Sirtuins)
  • Cell Membrane Integrity & Function
  • Metabolic Health Support

By Product Format:

  • Capsules
  • Tablets
  • Softgels
  • Powders
  • Liquid Formulations
  • Gummies
  • Functional Foods & Beverages

By Application:

  • Healthy Aging
  • Energy & Vitality
  • Cognitive Health
  • Cardiovascular Health
  • Metabolic Health
  • Immune Support

By Sales Channel:

  • Pharmacies & Drugstores
  • Health & Nutrition Stores
  • Online Retail
  • Direct‑to‑Consumer (DTC) Brands
  • Practitioner / Clinic Distribution

By Region:

  • North America
  • Latin America
  • Western Europe
  • Eastern Europe
  • East Asia
  • South Asia & Pacific
  • Middle East and Africa

Table of Content

  1. Executive Summary
    • Global Market Outlook
    • Demand-side Trends
    • Supply-side Trends
    • Technology Roadmap Analysis
    • Analysis and Recommendations
  2. Market Overview
    • Market Coverage / Taxonomy
    • Market Definition / Scope / Limitations
  3. Market Background
    • Market Dynamics
      • Drivers
      • Restraints
      • Opportunity
      • Trends
    • Scenario Forecast
      • Demand in Optimistic Scenario
      • Demand in Likely Scenario
      • Demand in Conservative Scenario
    • Opportunity Map Analysis
    • Product Life Cycle Analysis
    • Supply Chain Analysis
      • Supply Side Participants and their Roles
        • Producers
        • Mid-Level Participants (Traders/ Agents/ Brokers)
        • Wholesalers and Distributors
      • Value Added and Value Created at Node in the Supply Chain
      • List of Raw Material Suppliers
      • List of Existing and Potential Buyer’s
    • Investment Feasibility Matrix
    • Value Chain Analysis
      • Profit Margin Analysis
      • Wholesalers and Distributors
      • Retailers
    • PESTLE and Porter’s Analysis
    • Regulatory Landscape
      • By Key Regions
      • By Key Countries
    • Regional Parent Market Outlook
    • Production and Consumption Statistics
    • Import and Export Statistics
  4. Global Market Analysis 2020 to 2024 and Forecast, 2025 to 2035
    • Historical Market Size Value (USD Billion) & Volume (Units) Analysis, 2020 to 2024
    • Current and Future Market Size Value (USD Billion) & Volume (Units) Projections, 2025 to 2035
      • Y-o-Y Growth Trend Analysis
      • Absolute $ Opportunity Analysis
  5. Global Market Pricing Analysis 2020 to 2024 and Forecast 2025 to 2035
  6. Global Market Analysis 2020 to 2024 and Forecast 2025 to 2035, By Ingredient Type
    • Introduction / Key Findings
    • Historical Market Size Value (USD Billion) & Volume (Units) Analysis By Ingredient Type, 2020 to 2024
    • Current and Future Market Size Value (USD Billion) & Volume (Units) Analysis and Forecast By Ingredient Type, 2025 to 2035
      • NAD+ Precursors (NMN, NR)
      • CoQ10
      • PQQ (Pyrroloquinoline Quinone)
      • Alpha‑Lipoic Acid
      • L‑Carnitine
      • Resveratrol
      • Quercetin
      • Fisetin
      • Curcumin
      • Astaxanthin
      • Omega‑3 Fatty Acids
      • Phospholipids (Phosphatidylcholine, Phosphatidylserine)
    • Y-o-Y Growth Trend Analysis By Ingredient Type, 2020 to 2024
    • Absolute $ Opportunity Analysis By Ingredient Type, 2025 to 2035
  7. Global Market Analysis 2020 to 2024 and Forecast 2025 to 2035, By Health Function
    • Introduction / Key Findings
    • Historical Market Size Value (USD Billion) & Volume (Units) Analysis By Health Function, 2020 to 2024
    • Current and Future Market Size Value (USD Billion) & Volume (Units) Analysis and Forecast By Health Function, 2025 to 2035
      • Mitochondrial Support & Energy Production
      • Antioxidant Protection & Oxidative Stress Reduction
      • DNA Repair & Telomere Support
      • Cellular Signaling & Longevity Pathways (AMPK, mTOR, Sirtuins)
      • Cell Membrane Integrity & Function
      • Metabolic Health Support
    • Y-o-Y Growth Trend Analysis By Health Function, 2020 to 2024
    • Absolute $ Opportunity Analysis By Health Function, 2025 to 2035
  8. Global Market Analysis 2020 to 2024 and Forecast 2025 to 2035, By Product Format
    • Introduction / Key Findings
    • Historical Market Size Value (USD Billion) & Volume (Units) Analysis By Product Format, 2020 to 2024
    • Current and Future Market Size Value (USD Billion) & Volume (Units) Analysis and Forecast By Product Format, 2025 to 2035
      • Capsules
      • Tablets
      • Softgels
      • Powders
      • Liquid Formulations
      • Gummies
      • Functional Foods & Beverages
    • Y-o-Y Growth Trend Analysis By Product Format, 2020 to 2024
    • Absolute $ Opportunity Analysis By Product Format, 2025 to 2035
  9. Global Market Analysis 2020 to 2024 and Forecast 2025 to 2035, By Application
    • Introduction / Key Findings
    • Historical Market Size Value (USD Billion) & Volume (Units) Analysis By Application, 2020 to 2024
    • Current and Future Market Size Value (USD Billion) & Volume (Units) Analysis and Forecast By Application, 2025 to 2035
      • Healthy Aging
      • Energy & Vitality
      • Cognitive Health
      • Cardiovascular Health
      • Metabolic Health
      • Immune Support
    • Y-o-Y Growth Trend Analysis By Application, 2020 to 2024
    • Absolute $ Opportunity Analysis By Application, 2025 to 2035
  10. Global Market Analysis 2020 to 2024 and Forecast 2025 to 2035, By Sales Channel
    • Introduction / Key Findings
    • Historical Market Size Value (USD Billion) & Volume (Units) Analysis By Sales Channel, 2020 to 2024
    • Current and Future Market Size Value (USD Billion) & Volume (Units) Analysis and Forecast By Sales Channel, 2025 to 2035
      • Pharmacies & Drugstores
      • Health & Nutrition Stores
      • Online Retail
      • Direct‑to‑Consumer (DTC) Brands
      • Practitioner / Clinic Distribution
    • Y-o-Y Growth Trend Analysis By Sales Channel, 2020 to 2024
    • Absolute $ Opportunity Analysis By Sales Channel, 2025 to 2035
  11. Global Market Analysis 2020 to 2024 and Forecast 2025 to 2035, By Region
    • Introduction
    • Historical Market Size Value (USD Billion) & Volume (Units) Analysis By Region, 2020 to 2024
    • Current Market Size Value (USD Billion) & Volume (Units) Analysis and Forecast By Region, 2025 to 2035
      • North America
      • Latin America
      • Western Europe
      • Eastern Europe
      • East Asia
      • South Asia & Pacific
      • Middle East and Africa
    • Market Attractiveness Analysis By Region
  12. North America Market Analysis 2020 to 2024 and Forecast 2025 to 2035, By Country
    • Historical Market Size Value (USD Billion) & Volume (Units) Trend Analysis By Market Taxonomy, 2020 to 2024
    • Market Size Value (USD Billion) & Volume (Units) Forecast By Market Taxonomy, 2025 to 2035
      • By Country
        • USA
        • Canada
        • Mexico
      • By Ingredient Type
      • By Health Function
      • By Product Format
      • By Application
      • By Sales Channel
    • Market Attractiveness Analysis
      • By Country
      • By Ingredient Type
      • By Health Function
      • By Product Format
      • By Application
      • By Sales Channel
    • Key Takeaways
  13. Latin America Market Analysis 2020 to 2024 and Forecast 2025 to 2035, By Country
    • Historical Market Size Value (USD Billion) & Volume (Units) Trend Analysis By Market Taxonomy, 2020 to 2024
    • Market Size Value (USD Billion) & Volume (Units) Forecast By Market Taxonomy, 2025 to 2035
      • By Country
        • Brazil
        • Argentina
        • Rest of LATAM
      • By Ingredient Type
      • By Health Function
      • By Product Format
      • By Application
      • By Sales Channel
    • Market Attractiveness Analysis
      • By Country
      • By Ingredient Type
      • By Health Function
      • By Product Format
      • By Application
      • By Sales Channel
    • Key Takeaways
  14. Western Europe Market Analysis 2020 to 2024 and Forecast 2025 to 2035, By Country
    • Historical Market Size Value (USD Billion) & Volume (Units) Trend Analysis By Market Taxonomy, 2020 to 2024
    • Market Size Value (USD Billion) & Volume (Units) Forecast By Market Taxonomy, 2025 to 2035
      • By Country
        • Germany
        • Italy
        • France
        • UK
        • Spain
        • BENELUX
        • Nordic
        • Rest of W.Europe
      • By Ingredient Type
      • By Health Function
      • By Product Format
      • By Application
      • By Sales Channel
    • Market Attractiveness Analysis
      • By Country
      • By Ingredient Type
      • By Health Function
      • By Product Format
      • By Application
      • By Sales Channel
    • Key Takeaways
  15. Eastern Europe Market Analysis 2020 to 2024 and Forecast 2025 to 2035, By Country
    • Historical Market Size Value (USD Billion) & Volume (Units) Trend Analysis By Market Taxonomy, 2020 to 2024
    • Market Size Value (USD Billion) & Volume (Units) Forecast By Market Taxonomy, 2025 to 2035
      • By Country
        • Russia
        • Hungary
        • Poland
        • Balkan & Baltics
        • Rest of E. Europe
      • By Ingredient Type
      • By Health Function
      • By Product Format
      • By Application
      • By Sales Channel
    • Market Attractiveness Analysis
      • By Country
      • By Ingredient Type
      • By Health Function
      • By Product Format
      • By Application
      • By Sales Channel
    • Key Takeaways
  16. East Asia Market Analysis 2020 to 2024 and Forecast 2025 to 2035, By Country
    • Historical Market Size Value (USD Billion) & Volume (Units) Trend Analysis By Market Taxonomy, 2020 to 2024
    • Market Size Value (USD Billion) & Volume (Units) Forecast By Market Taxonomy, 2025 to 2035
      • By Country
        • China
        • Japan
        • South Korea
      • By Ingredient Type
      • By Health Function
      • By Product Format
      • By Application
      • By Sales Channel
    • Market Attractiveness Analysis
      • By Country
      • By Ingredient Type
      • By Health Function
      • By Product Format
      • By Application
      • By Sales Channel
    • Key Takeaways
  17. South Asia & Pacific Market Analysis 2020 to 2024 and Forecast 2025 to 2035, By Country
    • Historical Market Size Value (USD Billion) & Volume (Units) Trend Analysis By Market Taxonomy, 2020 to 2024
    • Market Size Value (USD Billion) & Volume (Units) Forecast By Market Taxonomy, 2025 to 2035
      • By Country
        • India
        • Australia & New Zealand
        • ASEAN
        • Rest of SAP
      • By Ingredient Type
      • By Health Function
      • By Product Format
      • By Application
      • By Sales Channel
    • Market Attractiveness Analysis
      • By Country
      • By Ingredient Type
      • By Health Function
      • By Product Format
      • By Application
      • By Sales Channel
    • Key Takeaways
  18. Middle East and Africa Market Analysis 2020 to 2024 and Forecast 2025 to 2035, By Country
    • Historical Market Size Value (USD Billion) & Volume (Units) Trend Analysis By Market Taxonomy, 2020 to 2024
    • Market Size Value (USD Billion) & Volume (Units) Forecast By Market Taxonomy, 2025 to 2035
      • By Country
        • GCC Countries
        • Northern Africa
        • South Africa
        • Turkiye
        • Rest of MEA
      • By Ingredient Type
      • By Health Function
      • By Product Format
      • By Application
      • By Sales Channel
    • Market Attractiveness Analysis
      • By Country
      • By Ingredient Type
      • By Health Function
      • By Product Format
      • By Application
      • By Sales Channel
    • Key Takeaways
  19. Key Countries Market Analysis
    • USA
      • Pricing Analysis
      • Market Share Analysis, 2024
        • By Ingredient Type
        • By Health Function
        • By Product Format
        • By Application
        • By Sales Channel
    • Canada
      • Pricing Analysis
      • Market Share Analysis, 2024
        • By Ingredient Type
        • By Health Function
        • By Product Format
        • By Application
        • By Sales Channel
    • Brazil
      • Pricing Analysis
      • Market Share Analysis, 2024
        • By Ingredient Type
        • By Health Function
        • By Product Format
        • By Application
        • By Sales Channel
    • Mexico
      • Pricing Analysis
      • Market Share Analysis, 2024
        • By Ingredient Type
        • By Health Function
        • By Product Format
        • By Application
        • By Sales Channel
    • Argentina
      • Pricing Analysis
      • Market Share Analysis, 2024
        • By Ingredient Type
        • By Health Function
        • By Product Format
        • By Application
        • By Sales Channel
  20. Market Structure Analysis
    • Competition Dashboard
    • Competition Benchmarking
    • Market Share Analysis of Top Players
      • By Regional
      • By Ingredient Type
      • By Health Function
      • By Product Format
      • By Application
      • By Sales Channel
  21. Competition Analysis
    • Competition Deep Dive
      • Elysium Health
        • Overview
        • Product Portfolio
        • Profitability by Market Segments (Product/Age /Sales Channel/Region)
        • Sales Footprint
        • Strategy Overview
          • Marketing Strategy
          • Product Strategy
          • Channel Strategy
      • Tru Niagen (ChromaDex)
        • Overview
        • Product Portfolio
        • Profitability by Market Segments (Product/Age /Sales Channel/Region)
        • Sales Footprint
        • Strategy Overview
          • Marketing Strategy
          • Product Strategy
          • Channel Strategy
      • Life Extension
        • Overview
        • Product Portfolio
        • Profitability by Market Segments (Product/Age /Sales Channel/Region)
        • Sales Footprint
        • Strategy Overview
          • Marketing Strategy
          • Product Strategy
          • Channel Strategy
      • Thorne
        • Overview
        • Product Portfolio
        • Profitability by Market Segments (Product/Age /Sales Channel/Region)
        • Sales Footprint
        • Strategy Overview
          • Marketing Strategy
          • Product Strategy
          • Channel Strategy
      • Gundry MD
        • Overview
        • Product Portfolio
        • Profitability by Market Segments (Product/Age /Sales Channel/Region)
        • Sales Footprint
        • Strategy Overview
          • Marketing Strategy
          • Product Strategy
          • Channel Strategy
      • GNC
        • Overview
        • Product Portfolio
        • Profitability by Market Segments (Product/Age /Sales Channel/Region)
        • Sales Footprint
        • Strategy Overview
          • Marketing Strategy
          • Product Strategy
          • Channel Strategy
      • NOW Foods
        • Overview
        • Product Portfolio
        • Profitability by Market Segments (Product/Age /Sales Channel/Region)
        • Sales Footprint
        • Strategy Overview
          • Marketing Strategy
          • Product Strategy
          • Channel Strategy
      • Doctor’s Best
        • Overview
        • Product Portfolio
        • Profitability by Market Segments (Product/Age /Sales Channel/Region)
        • Sales Footprint
        • Strategy Overview
          • Marketing Strategy
          • Product Strategy
          • Channel Strategy
      • Jarrow Formulas
        • Overview
        • Product Portfolio
        • Profitability by Market Segments (Product/Age /Sales Channel/Region)
        • Sales Footprint
        • Strategy Overview
          • Marketing Strategy
          • Product Strategy
          • Channel Strategy
      • HUM Nutrition
        • Overview
        • Product Portfolio
        • Profitability by Market Segments (Product/Age /Sales Channel/Region)
        • Sales Footprint
        • Strategy Overview
          • Marketing Strategy
          • Product Strategy
          • Channel Strategy
  22. Assumptions & Acronyms Used
  23. Research Methodology

List of Tables

  • Table 1: Global Market Value (USD Million) Forecast by Region, 2020-2035
  • Table 2: Global Market Volume (Units) Forecast by Region, 2020-2035
  • Table 3: Global Market Value (USD Million) Forecast by Ingredient Type, 2020-2035
  • Table 4: Global Market Volume (Units) Forecast by Ingredient Type, 2020-2035
  • Table 5: Global Market Value (USD Million) Forecast by Health Function, 2020-2035
  • Table 6: Global Market Volume (Units) Forecast by Health Function, 2020-2035
  • Table 7: Global Market Value (USD Million) Forecast by Product Format, 2020-2035
  • Table 8: Global Market Volume (Units) Forecast by Product Format, 2020-2035
  • Table 9: Global Market Value (USD Million) Forecast by Application, 2020-2035
  • Table 10: Global Market Volume (Units) Forecast by Application, 2020-2035
  • Table 11: Global Market Value (USD Million) Forecast by Sales Channel, 2020-2035
  • Table 12: Global Market Volume (Units) Forecast by Sales Channel, 2020-2035
  • Table 13: North America Market Value (USD Million) Forecast by Country, 2020-2035
  • Table 14: North America Market Volume (Units) Forecast by Country, 2020-2035
  • Table 15: North America Market Value (USD Million) Forecast by Ingredient Type, 2020-2035
  • Table 16: North America Market Volume (Units) Forecast by Ingredient Type, 2020-2035
  • Table 17: North America Market Value (USD Million) Forecast by Health Function, 2020-2035
  • Table 18: North America Market Volume (Units) Forecast by Health Function, 2020-2035
  • Table 19: North America Market Value (USD Million) Forecast by Product Format, 2020-2035
  • Table 20: North America Market Volume (Units) Forecast by Product Format, 2020-2035
  • Table 21: North America Market Value (USD Million) Forecast by Application, 2020-2035
  • Table 22: North America Market Volume (Units) Forecast by Application, 2020-2035
  • Table 23: North America Market Value (USD Million) Forecast by Sales Channel, 2020-2035
  • Table 24: North America Market Volume (Units) Forecast by Sales Channel, 2020-2035
  • Table 25: Latin America Market Value (USD Million) Forecast by Country, 2020-2035
  • Table 26: Latin America Market Volume (Units) Forecast by Country, 2020-2035
  • Table 27: Latin America Market Value (USD Million) Forecast by Ingredient Type, 2020-2035
  • Table 28: Latin America Market Volume (Units) Forecast by Ingredient Type, 2020-2035
  • Table 29: Latin America Market Value (USD Million) Forecast by Health Function, 2020-2035
  • Table 30: Latin America Market Volume (Units) Forecast by Health Function, 2020-2035
  • Table 31: Latin America Market Value (USD Million) Forecast by Product Format, 2020-2035
  • Table 32: Latin America Market Volume (Units) Forecast by Product Format, 2020-2035
  • Table 33: Latin America Market Value (USD Million) Forecast by Application, 2020-2035
  • Table 34: Latin America Market Volume (Units) Forecast by Application, 2020-2035
  • Table 35: Latin America Market Value (USD Million) Forecast by Sales Channel, 2020-2035
  • Table 36: Latin America Market Volume (Units) Forecast by Sales Channel, 2020-2035
  • Table 37: Europe Market Value (USD Million) Forecast by Country, 2020-2035
  • Table 38: Europe Market Volume (Units) Forecast by Country, 2020-2035
  • Table 39: Europe Market Value (USD Million) Forecast by Ingredient Type, 2020-2035
  • Table 40: Europe Market Volume (Units) Forecast by Ingredient Type, 2020-2035
  • Table 41: Europe Market Value (USD Million) Forecast by Health Function, 2020-2035
  • Table 42: Europe Market Volume (Units) Forecast by Health Function, 2020-2035
  • Table 43: Europe Market Value (USD Million) Forecast by Product Format, 2020-2035
  • Table 44: Europe Market Volume (Units) Forecast by Product Format, 2020-2035
  • Table 45: Europe Market Value (USD Million) Forecast by Application, 2020-2035
  • Table 46: Europe Market Volume (Units) Forecast by Application, 2020-2035
  • Table 47: Europe Market Value (USD Million) Forecast by Sales Channel, 2020-2035
  • Table 48: Europe Market Volume (Units) Forecast by Sales Channel, 2020-2035
  • Table 49: East Asia Market Value (USD Million) Forecast by Country, 2020-2035
  • Table 50: East Asia Market Volume (Units) Forecast by Country, 2020-2035
  • Table 51: East Asia Market Value (USD Million) Forecast by Ingredient Type, 2020-2035
  • Table 52: East Asia Market Volume (Units) Forecast by Ingredient Type, 2020-2035
  • Table 53: East Asia Market Value (USD Million) Forecast by Health Function, 2020-2035
  • Table 54: East Asia Market Volume (Units) Forecast by Health Function, 2020-2035
  • Table 55: East Asia Market Value (USD Million) Forecast by Product Format, 2020-2035
  • Table 56: East Asia Market Volume (Units) Forecast by Product Format, 2020-2035
  • Table 57: East Asia Market Value (USD Million) Forecast by Application, 2020-2035
  • Table 58: East Asia Market Volume (Units) Forecast by Application, 2020-2035
  • Table 59: East Asia Market Value (USD Million) Forecast by Sales Channel, 2020-2035
  • Table 60: East Asia Market Volume (Units) Forecast by Sales Channel, 2020-2035
  • Table 61: South Asia & Pacific Market Value (USD Million) Forecast by Country, 2020-2035
  • Table 62: South Asia & Pacific Market Volume (Units) Forecast by Country, 2020-2035
  • Table 63: South Asia & Pacific Market Value (USD Million) Forecast by Ingredient Type, 2020-2035
  • Table 64: South Asia & Pacific Market Volume (Units) Forecast by Ingredient Type, 2020-2035
  • Table 65: South Asia & Pacific Market Value (USD Million) Forecast by Health Function, 2020-2035
  • Table 66: South Asia & Pacific Market Volume (Units) Forecast by Health Function, 2020-2035
  • Table 67: South Asia & Pacific Market Value (USD Million) Forecast by Product Format, 2020-2035
  • Table 68: South Asia & Pacific Market Volume (Units) Forecast by Product Format, 2020-2035
  • Table 69: South Asia & Pacific Market Value (USD Million) Forecast by Application, 2020-2035
  • Table 70: South Asia & Pacific Market Volume (Units) Forecast by Application, 2020-2035
  • Table 71: South Asia & Pacific Market Value (USD Million) Forecast by Sales Channel, 2020-2035
  • Table 72: South Asia & Pacific Market Volume (Units) Forecast by Sales Channel, 2020-2035
  • Table 73: MEA Market Value (USD Million) Forecast by Country, 2020-2035
  • Table 74: MEA Market Volume (Units) Forecast by Country, 2020-2035
  • Table 75: MEA Market Value (USD Million) Forecast by Ingredient Type, 2020-2035
  • Table 76: MEA Market Volume (Units) Forecast by Ingredient Type, 2020-2035
  • Table 77: MEA Market Value (USD Million) Forecast by Health Function, 2020-2035
  • Table 78: MEA Market Volume (Units) Forecast by Health Function, 2020-2035
  • Table 79: MEA Market Value (USD Million) Forecast by Product Format, 2020-2035
  • Table 80: MEA Market Volume (Units) Forecast by Product Format, 2020-2035
  • Table 81: MEA Market Value (USD Million) Forecast by Application, 2020-2035
  • Table 82: MEA Market Volume (Units) Forecast by Application, 2020-2035
  • Table 83: MEA Market Value (USD Million) Forecast by Sales Channel, 2020-2035
  • Table 84: MEA Market Volume (Units) Forecast by Sales Channel, 2020-2035

List of Figures

  • Figure 1: Global Market Value (USD Million) by Ingredient Type, 2025-2035
  • Figure 2: Global Market Value (USD Million) by Health Function, 2025-2035
  • Figure 3: Global Market Value (USD Million) by Product Format, 2025-2035
  • Figure 4: Global Market Value (USD Million) by Application, 2025-2035
  • Figure 5: Global Market Value (USD Million) by Sales Channel, 2025-2035
  • Figure 6: Global Market Value (USD Million) by Region, 2025-2035
  • Figure 7: Global Market Value (USD Million) Analysis by Region, 2020-2035
  • Figure 8: Global Market Volume (Units) Analysis by Region, 2020-2035
  • Figure 9: Global Market Value Share (%) and BPS Analysis by Region, 2025-2035
  • Figure 10: Global Market Y-o-Y Growth (%) Projections by Region, 2025-2035
  • Figure 11: Global Market Value (USD Million) Analysis by Ingredient Type, 2020-2035
  • Figure 12: Global Market Volume (Units) Analysis by Ingredient Type, 2020-2035
  • Figure 13: Global Market Value Share (%) and BPS Analysis by Ingredient Type, 2025-2035
  • Figure 14: Global Market Y-o-Y Growth (%) Projections by Ingredient Type, 2025-2035
  • Figure 15: Global Market Value (USD Million) Analysis by Health Function, 2020-2035
  • Figure 16: Global Market Volume (Units) Analysis by Health Function, 2020-2035
  • Figure 17: Global Market Value Share (%) and BPS Analysis by Health Function, 2025-2035
  • Figure 18: Global Market Y-o-Y Growth (%) Projections by Health Function, 2025-2035
  • Figure 19: Global Market Value (USD Million) Analysis by Product Format, 2020-2035
  • Figure 20: Global Market Volume (Units) Analysis by Product Format, 2020-2035
  • Figure 21: Global Market Value Share (%) and BPS Analysis by Product Format, 2025-2035
  • Figure 22: Global Market Y-o-Y Growth (%) Projections by Product Format, 2025-2035
  • Figure 23: Global Market Value (USD Million) Analysis by Application, 2020-2035
  • Figure 24: Global Market Volume (Units) Analysis by Application, 2020-2035
  • Figure 25: Global Market Value Share (%) and BPS Analysis by Application, 2025-2035
  • Figure 26: Global Market Y-o-Y Growth (%) Projections by Application, 2025-2035
  • Figure 27: Global Market Value (USD Million) Analysis by Sales Channel, 2020-2035
  • Figure 28: Global Market Volume (Units) Analysis by Sales Channel, 2020-2035
  • Figure 29: Global Market Value Share (%) and BPS Analysis by Sales Channel, 2025-2035
  • Figure 30: Global Market Y-o-Y Growth (%) Projections by Sales Channel, 2025-2035
  • Figure 31: Global Market Attractiveness by Ingredient Type, 2025-2035
  • Figure 32: Global Market Attractiveness by Health Function, 2025-2035
  • Figure 33: Global Market Attractiveness by Product Format, 2025-2035
  • Figure 34: Global Market Attractiveness by Application, 2025-2035
  • Figure 35: Global Market Attractiveness by Sales Channel, 2025-2035
  • Figure 36: Global Market Attractiveness by Region, 2025-2035
  • Figure 37: North America Market Value (USD Million) by Ingredient Type, 2025-2035
  • Figure 38: North America Market Value (USD Million) by Health Function, 2025-2035
  • Figure 39: North America Market Value (USD Million) by Product Format, 2025-2035
  • Figure 40: North America Market Value (USD Million) by Application, 2025-2035
  • Figure 41: North America Market Value (USD Million) by Sales Channel, 2025-2035
  • Figure 42: North America Market Value (USD Million) by Country, 2025-2035
  • Figure 43: North America Market Value (USD Million) Analysis by Country, 2020-2035
  • Figure 44: North America Market Volume (Units) Analysis by Country, 2020-2035
  • Figure 45: North America Market Value Share (%) and BPS Analysis by Country, 2025-2035
  • Figure 46: North America Market Y-o-Y Growth (%) Projections by Country, 2025-2035
  • Figure 47: North America Market Value (USD Million) Analysis by Ingredient Type, 2020-2035
  • Figure 48: North America Market Volume (Units) Analysis by Ingredient Type, 2020-2035
  • Figure 49: North America Market Value Share (%) and BPS Analysis by Ingredient Type, 2025-2035
  • Figure 50: North America Market Y-o-Y Growth (%) Projections by Ingredient Type, 2025-2035
  • Figure 51: North America Market Value (USD Million) Analysis by Health Function, 2020-2035
  • Figure 52: North America Market Volume (Units) Analysis by Health Function, 2020-2035
  • Figure 53: North America Market Value Share (%) and BPS Analysis by Health Function, 2025-2035
  • Figure 54: North America Market Y-o-Y Growth (%) Projections by Health Function, 2025-2035
  • Figure 55: North America Market Value (USD Million) Analysis by Product Format, 2020-2035
  • Figure 56: North America Market Volume (Units) Analysis by Product Format, 2020-2035
  • Figure 57: North America Market Value Share (%) and BPS Analysis by Product Format, 2025-2035
  • Figure 58: North America Market Y-o-Y Growth (%) Projections by Product Format, 2025-2035
  • Figure 59: North America Market Value (USD Million) Analysis by Application, 2020-2035
  • Figure 60: North America Market Volume (Units) Analysis by Application, 2020-2035
  • Figure 61: North America Market Value Share (%) and BPS Analysis by Application, 2025-2035
  • Figure 62: North America Market Y-o-Y Growth (%) Projections by Application, 2025-2035
  • Figure 63: North America Market Value (USD Million) Analysis by Sales Channel, 2020-2035
  • Figure 64: North America Market Volume (Units) Analysis by Sales Channel, 2020-2035
  • Figure 65: North America Market Value Share (%) and BPS Analysis by Sales Channel, 2025-2035
  • Figure 66: North America Market Y-o-Y Growth (%) Projections by Sales Channel, 2025-2035
  • Figure 67: North America Market Attractiveness by Ingredient Type, 2025-2035
  • Figure 68: North America Market Attractiveness by Health Function, 2025-2035
  • Figure 69: North America Market Attractiveness by Product Format, 2025-2035
  • Figure 70: North America Market Attractiveness by Application, 2025-2035
  • Figure 71: North America Market Attractiveness by Sales Channel, 2025-2035
  • Figure 72: North America Market Attractiveness by Country, 2025-2035
  • Figure 73: Latin America Market Value (USD Million) by Ingredient Type, 2025-2035
  • Figure 74: Latin America Market Value (USD Million) by Health Function, 2025-2035
  • Figure 75: Latin America Market Value (USD Million) by Product Format, 2025-2035
  • Figure 76: Latin America Market Value (USD Million) by Application, 2025-2035
  • Figure 77: Latin America Market Value (USD Million) by Sales Channel, 2025-2035
  • Figure 78: Latin America Market Value (USD Million) by Country, 2025-2035
  • Figure 79: Latin America Market Value (USD Million) Analysis by Country, 2020-2035
  • Figure 80: Latin America Market Volume (Units) Analysis by Country, 2020-2035
  • Figure 81: Latin America Market Value Share (%) and BPS Analysis by Country, 2025-2035
  • Figure 82: Latin America Market Y-o-Y Growth (%) Projections by Country, 2025-2035
  • Figure 83: Latin America Market Value (USD Million) Analysis by Ingredient Type, 2020-2035
  • Figure 84: Latin America Market Volume (Units) Analysis by Ingredient Type, 2020-2035
  • Figure 85: Latin America Market Value Share (%) and BPS Analysis by Ingredient Type, 2025-2035
  • Figure 86: Latin America Market Y-o-Y Growth (%) Projections by Ingredient Type, 2025-2035
  • Figure 87: Latin America Market Value (USD Million) Analysis by Health Function, 2020-2035
  • Figure 88: Latin America Market Volume (Units) Analysis by Health Function, 2020-2035
  • Figure 89: Latin America Market Value Share (%) and BPS Analysis by Health Function, 2025-2035
  • Figure 90: Latin America Market Y-o-Y Growth (%) Projections by Health Function, 2025-2035
  • Figure 91: Latin America Market Value (USD Million) Analysis by Product Format, 2020-2035
  • Figure 92: Latin America Market Volume (Units) Analysis by Product Format, 2020-2035
  • Figure 93: Latin America Market Value Share (%) and BPS Analysis by Product Format, 2025-2035
  • Figure 94: Latin America Market Y-o-Y Growth (%) Projections by Product Format, 2025-2035
  • Figure 95: Latin America Market Value (USD Million) Analysis by Application, 2020-2035
  • Figure 96: Latin America Market Volume (Units) Analysis by Application, 2020-2035
  • Figure 97: Latin America Market Value Share (%) and BPS Analysis by Application, 2025-2035
  • Figure 98: Latin America Market Y-o-Y Growth (%) Projections by Application, 2025-2035
  • Figure 99: Latin America Market Value (USD Million) Analysis by Sales Channel, 2020-2035
  • Figure 100: Latin America Market Volume (Units) Analysis by Sales Channel, 2020-2035
  • Figure 101: Latin America Market Value Share (%) and BPS Analysis by Sales Channel, 2025-2035
  • Figure 102: Latin America Market Y-o-Y Growth (%) Projections by Sales Channel, 2025-2035
  • Figure 103: Latin America Market Attractiveness by Ingredient Type, 2025-2035
  • Figure 104: Latin America Market Attractiveness by Health Function, 2025-2035
  • Figure 105: Latin America Market Attractiveness by Product Format, 2025-2035
  • Figure 106: Latin America Market Attractiveness by Application, 2025-2035
  • Figure 107: Latin America Market Attractiveness by Sales Channel, 2025-2035
  • Figure 108: Latin America Market Attractiveness by Country, 2025-2035
  • Figure 109: Europe Market Value (USD Million) by Ingredient Type, 2025-2035
  • Figure 110: Europe Market Value (USD Million) by Health Function, 2025-2035
  • Figure 111: Europe Market Value (USD Million) by Product Format, 2025-2035
  • Figure 112: Europe Market Value (USD Million) by Application, 2025-2035
  • Figure 113: Europe Market Value (USD Million) by Sales Channel, 2025-2035
  • Figure 114: Europe Market Value (USD Million) by Country, 2025-2035
  • Figure 115: Europe Market Value (USD Million) Analysis by Country, 2020-2035
  • Figure 116: Europe Market Volume (Units) Analysis by Country, 2020-2035
  • Figure 117: Europe Market Value Share (%) and BPS Analysis by Country, 2025-2035
  • Figure 118: Europe Market Y-o-Y Growth (%) Projections by Country, 2025-2035
  • Figure 119: Europe Market Value (USD Million) Analysis by Ingredient Type, 2020-2035
  • Figure 120: Europe Market Volume (Units) Analysis by Ingredient Type, 2020-2035
  • Figure 121: Europe Market Value Share (%) and BPS Analysis by Ingredient Type, 2025-2035
  • Figure 122: Europe Market Y-o-Y Growth (%) Projections by Ingredient Type, 2025-2035
  • Figure 123: Europe Market Value (USD Million) Analysis by Health Function, 2020-2035
  • Figure 124: Europe Market Volume (Units) Analysis by Health Function, 2020-2035
  • Figure 125: Europe Market Value Share (%) and BPS Analysis by Health Function, 2025-2035
  • Figure 126: Europe Market Y-o-Y Growth (%) Projections by Health Function, 2025-2035
  • Figure 127: Europe Market Value (USD Million) Analysis by Product Format, 2020-2035
  • Figure 128: Europe Market Volume (Units) Analysis by Product Format, 2020-2035
  • Figure 129: Europe Market Value Share (%) and BPS Analysis by Product Format, 2025-2035
  • Figure 130: Europe Market Y-o-Y Growth (%) Projections by Product Format, 2025-2035
  • Figure 131: Europe Market Value (USD Million) Analysis by Application, 2020-2035
  • Figure 132: Europe Market Volume (Units) Analysis by Application, 2020-2035
  • Figure 133: Europe Market Value Share (%) and BPS Analysis by Application, 2025-2035
  • Figure 134: Europe Market Y-o-Y Growth (%) Projections by Application, 2025-2035
  • Figure 135: Europe Market Value (USD Million) Analysis by Sales Channel, 2020-2035
  • Figure 136: Europe Market Volume (Units) Analysis by Sales Channel, 2020-2035
  • Figure 137: Europe Market Value Share (%) and BPS Analysis by Sales Channel, 2025-2035
  • Figure 138: Europe Market Y-o-Y Growth (%) Projections by Sales Channel, 2025-2035
  • Figure 139: Europe Market Attractiveness by Ingredient Type, 2025-2035
  • Figure 140: Europe Market Attractiveness by Health Function, 2025-2035
  • Figure 141: Europe Market Attractiveness by Product Format, 2025-2035
  • Figure 142: Europe Market Attractiveness by Application, 2025-2035
  • Figure 143: Europe Market Attractiveness by Sales Channel, 2025-2035
  • Figure 144: Europe Market Attractiveness by Country, 2025-2035
  • Figure 145: East Asia Market Value (USD Million) by Ingredient Type, 2025-2035
  • Figure 146: East Asia Market Value (USD Million) by Health Function, 2025-2035
  • Figure 147: East Asia Market Value (USD Million) by Product Format, 2025-2035
  • Figure 148: East Asia Market Value (USD Million) by Application, 2025-2035
  • Figure 149: East Asia Market Value (USD Million) by Sales Channel, 2025-2035
  • Figure 150: East Asia Market Value (USD Million) by Country, 2025-2035
  • Figure 151: East Asia Market Value (USD Million) Analysis by Country, 2020-2035
  • Figure 152: East Asia Market Volume (Units) Analysis by Country, 2020-2035
  • Figure 153: East Asia Market Value Share (%) and BPS Analysis by Country, 2025-2035
  • Figure 154: East Asia Market Y-o-Y Growth (%) Projections by Country, 2025-2035
  • Figure 155: East Asia Market Value (USD Million) Analysis by Ingredient Type, 2020-2035
  • Figure 156: East Asia Market Volume (Units) Analysis by Ingredient Type, 2020-2035
  • Figure 157: East Asia Market Value Share (%) and BPS Analysis by Ingredient Type, 2025-2035
  • Figure 158: East Asia Market Y-o-Y Growth (%) Projections by Ingredient Type, 2025-2035
  • Figure 159: East Asia Market Value (USD Million) Analysis by Health Function, 2020-2035
  • Figure 160: East Asia Market Volume (Units) Analysis by Health Function, 2020-2035
  • Figure 161: East Asia Market Value Share (%) and BPS Analysis by Health Function, 2025-2035
  • Figure 162: East Asia Market Y-o-Y Growth (%) Projections by Health Function, 2025-2035
  • Figure 163: East Asia Market Value (USD Million) Analysis by Product Format, 2020-2035
  • Figure 164: East Asia Market Volume (Units) Analysis by Product Format, 2020-2035
  • Figure 165: East Asia Market Value Share (%) and BPS Analysis by Product Format, 2025-2035
  • Figure 166: East Asia Market Y-o-Y Growth (%) Projections by Product Format, 2025-2035
  • Figure 167: East Asia Market Value (USD Million) Analysis by Application, 2020-2035
  • Figure 168: East Asia Market Volume (Units) Analysis by Application, 2020-2035
  • Figure 169: East Asia Market Value Share (%) and BPS Analysis by Application, 2025-2035
  • Figure 170: East Asia Market Y-o-Y Growth (%) Projections by Application, 2025-2035
  • Figure 171: East Asia Market Value (USD Million) Analysis by Sales Channel, 2020-2035
  • Figure 172: East Asia Market Volume (Units) Analysis by Sales Channel, 2020-2035
  • Figure 173: East Asia Market Value Share (%) and BPS Analysis by Sales Channel, 2025-2035
  • Figure 174: East Asia Market Y-o-Y Growth (%) Projections by Sales Channel, 2025-2035
  • Figure 175: East Asia Market Attractiveness by Ingredient Type, 2025-2035
  • Figure 176: East Asia Market Attractiveness by Health Function, 2025-2035
  • Figure 177: East Asia Market Attractiveness by Product Format, 2025-2035
  • Figure 178: East Asia Market Attractiveness by Application, 2025-2035
  • Figure 179: East Asia Market Attractiveness by Sales Channel, 2025-2035
  • Figure 180: East Asia Market Attractiveness by Country, 2025-2035
  • Figure 181: South Asia & Pacific Market Value (USD Million) by Ingredient Type, 2025-2035
  • Figure 182: South Asia & Pacific Market Value (USD Million) by Health Function, 2025-2035
  • Figure 183: South Asia & Pacific Market Value (USD Million) by Product Format, 2025-2035
  • Figure 184: South Asia & Pacific Market Value (USD Million) by Application, 2025-2035
  • Figure 185: South Asia & Pacific Market Value (USD Million) by Sales Channel, 2025-2035
  • Figure 186: South Asia & Pacific Market Value (USD Million) by Country, 2025-2035
  • Figure 187: South Asia & Pacific Market Value (USD Million) Analysis by Country, 2020-2035
  • Figure 188: South Asia & Pacific Market Volume (Units) Analysis by Country, 2020-2035
  • Figure 189: South Asia & Pacific Market Value Share (%) and BPS Analysis by Country, 2025-2035
  • Figure 190: South Asia & Pacific Market Y-o-Y Growth (%) Projections by Country, 2025-2035
  • Figure 191: South Asia & Pacific Market Value (USD Million) Analysis by Ingredient Type, 2020-2035
  • Figure 192: South Asia & Pacific Market Volume (Units) Analysis by Ingredient Type, 2020-2035
  • Figure 193: South Asia & Pacific Market Value Share (%) and BPS Analysis by Ingredient Type, 2025-2035
  • Figure 194: South Asia & Pacific Market Y-o-Y Growth (%) Projections by Ingredient Type, 2025-2035
  • Figure 195: South Asia & Pacific Market Value (USD Million) Analysis by Health Function, 2020-2035
  • Figure 196: South Asia & Pacific Market Volume (Units) Analysis by Health Function, 2020-2035
  • Figure 197: South Asia & Pacific Market Value Share (%) and BPS Analysis by Health Function, 2025-2035
  • Figure 198: South Asia & Pacific Market Y-o-Y Growth (%) Projections by Health Function, 2025-2035
  • Figure 199: South Asia & Pacific Market Value (USD Million) Analysis by Product Format, 2020-2035
  • Figure 200: South Asia & Pacific Market Volume (Units) Analysis by Product Format, 2020-2035
  • Figure 201: South Asia & Pacific Market Value Share (%) and BPS Analysis by Product Format, 2025-2035
  • Figure 202: South Asia & Pacific Market Y-o-Y Growth (%) Projections by Product Format, 2025-2035
  • Figure 203: South Asia & Pacific Market Value (USD Million) Analysis by Application, 2020-2035
  • Figure 204: South Asia & Pacific Market Volume (Units) Analysis by Application, 2020-2035
  • Figure 205: South Asia & Pacific Market Value Share (%) and BPS Analysis by Application, 2025-2035
  • Figure 206: South Asia & Pacific Market Y-o-Y Growth (%) Projections by Application, 2025-2035
  • Figure 207: South Asia & Pacific Market Value (USD Million) Analysis by Sales Channel, 2020-2035
  • Figure 208: South Asia & Pacific Market Volume (Units) Analysis by Sales Channel, 2020-2035
  • Figure 209: South Asia & Pacific Market Value Share (%) and BPS Analysis by Sales Channel, 2025-2035
  • Figure 210: South Asia & Pacific Market Y-o-Y Growth (%) Projections by Sales Channel, 2025-2035
  • Figure 211: South Asia & Pacific Market Attractiveness by Ingredient Type, 2025-2035
  • Figure 212: South Asia & Pacific Market Attractiveness by Health Function, 2025-2035
  • Figure 213: South Asia & Pacific Market Attractiveness by Product Format, 2025-2035
  • Figure 214: South Asia & Pacific Market Attractiveness by Application, 2025-2035
  • Figure 215: South Asia & Pacific Market Attractiveness by Sales Channel, 2025-2035
  • Figure 216: South Asia & Pacific Market Attractiveness by Country, 2025-2035
  • Figure 217: MEA Market Value (USD Million) by Ingredient Type, 2025-2035
  • Figure 218: MEA Market Value (USD Million) by Health Function, 2025-2035
  • Figure 219: MEA Market Value (USD Million) by Product Format, 2025-2035
  • Figure 220: MEA Market Value (USD Million) by Application, 2025-2035
  • Figure 221: MEA Market Value (USD Million) by Sales Channel, 2025-2035
  • Figure 222: MEA Market Value (USD Million) by Country, 2025-2035
  • Figure 223: MEA Market Value (USD Million) Analysis by Country, 2020-2035
  • Figure 224: MEA Market Volume (Units) Analysis by Country, 2020-2035
  • Figure 225: MEA Market Value Share (%) and BPS Analysis by Country, 2025-2035
  • Figure 226: MEA Market Y-o-Y Growth (%) Projections by Country, 2025-2035
  • Figure 227: MEA Market Value (USD Million) Analysis by Ingredient Type, 2020-2035
  • Figure 228: MEA Market Volume (Units) Analysis by Ingredient Type, 2020-2035
  • Figure 229: MEA Market Value Share (%) and BPS Analysis by Ingredient Type, 2025-2035
  • Figure 230: MEA Market Y-o-Y Growth (%) Projections by Ingredient Type, 2025-2035
  • Figure 231: MEA Market Value (USD Million) Analysis by Health Function, 2020-2035
  • Figure 232: MEA Market Volume (Units) Analysis by Health Function, 2020-2035
  • Figure 233: MEA Market Value Share (%) and BPS Analysis by Health Function, 2025-2035
  • Figure 234: MEA Market Y-o-Y Growth (%) Projections by Health Function, 2025-2035
  • Figure 235: MEA Market Value (USD Million) Analysis by Product Format, 2020-2035
  • Figure 236: MEA Market Volume (Units) Analysis by Product Format, 2020-2035
  • Figure 237: MEA Market Value Share (%) and BPS Analysis by Product Format, 2025-2035
  • Figure 238: MEA Market Y-o-Y Growth (%) Projections by Product Format, 2025-2035
  • Figure 239: MEA Market Value (USD Million) Analysis by Application, 2020-2035
  • Figure 240: MEA Market Volume (Units) Analysis by Application, 2020-2035
  • Figure 241: MEA Market Value Share (%) and BPS Analysis by Application, 2025-2035
  • Figure 242: MEA Market Y-o-Y Growth (%) Projections by Application, 2025-2035
  • Figure 243: MEA Market Value (USD Million) Analysis by Sales Channel, 2020-2035
  • Figure 244: MEA Market Volume (Units) Analysis by Sales Channel, 2020-2035
  • Figure 245: MEA Market Value Share (%) and BPS Analysis by Sales Channel, 2025-2035
  • Figure 246: MEA Market Y-o-Y Growth (%) Projections by Sales Channel, 2025-2035
  • Figure 247: MEA Market Attractiveness by Ingredient Type, 2025-2035
  • Figure 248: MEA Market Attractiveness by Health Function, 2025-2035
  • Figure 249: MEA Market Attractiveness by Product Format, 2025-2035
  • Figure 250: MEA Market Attractiveness by Application, 2025-2035
  • Figure 251: MEA Market Attractiveness by Sales Channel, 2025-2035
  • Figure 252: MEA Market Attractiveness by Country, 2025-2035

Frequently Asked Questions

How big is the Cellular Health Supplement Market in 2025?

The global Cellular Health Supplement Market is estimated to be valued at USD 1,998.7 million in 2025, supported by rising awareness of cellular aging and the growing use of NAD⁺ and mitochondrial-focused supplements.

What will be the size of the Cellular Health Supplement Market in 2035?

The market size for the Cellular Health Supplement Market is projected to reach USD 3,668.1 million by 2035, as demand strengthens for personalized, biomarker-driven formulations and anti-aging interventions.

How much will the Cellular Health Supplement Market grow between 2025 and 2035?

The Cellular Health Supplement Market is expected to grow at a CAGR of 6.3% between 2025 and 2035, adding approximately USD 1,669.4 million in incremental value over the decade.

What are the key product formats in the Cellular Health Supplement Market?

The key product formats in the Cellular Health Supplement Market are capsules, softgels, powders, liquids, gummies, and functional foods & beverages, with capsules accounting for the highest value share due to ease of use and superior shelf stability.

Which health function segment will contribute the most in 2025?

In 2025, the Healthy Aging & Longevity segment is expected to lead, accounting for 38% of South Korea’s market and a comparable share globally, driven by increased focus on NAD⁺ optimization, DNA repair, and biological age reversal.

Explore Similar Insights

Future Market Insights

Cellular Health Supplement Market