Cellular Renewal Actives Market Size and Share Forecast Outlook 2025 to 2035

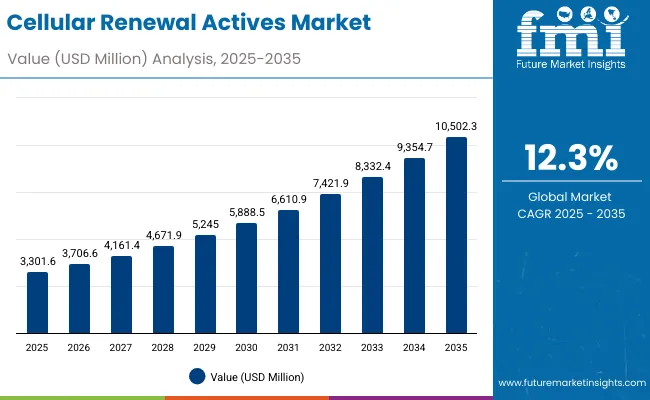
The Cellular Renewal Actives Market is expected to record a valuation of USD 3,301.6 million in 2025 and USD 10,502.3 million in 2035, with an increase of USD 7,200.7 million, which equals a growth of 193% over the decade. The overall expansion represents a CAGR of 12.3% and more than a 3X increase in market size.
Quick Stats for Cellular Renewal Actives Market

  • Cellular Renewal Actives Market Value (2025): USD 3,301.6 million
  • Cellular Renewal Actives Market Forecast Value (2035): USD 10,502.3 million
  • Cellular Renewal Actives Market Forecast CAGR: 12.3%
  • Leading Segment in 2025 by Function: Cell turnover/renewal (54.5%)
  • Leading Product Type in 2025: Serums (51.2%)
  • Key Growth Regions: China, India, Japan, USA, UK
  • Top Key Players: The Ordinary, Paula’s Choice, Neostrata, Murad, Drunk Elephant, SkinCeuticals, La Roche-Posay, Peter Thomas Roth, Sunday Riley, The Inkey List

Cellular Renewal Actives Market

Cellular Renewal Actives Market Key Takeaways

Metric Value
Cellular Renewal Actives Market Estimated Value in (2025E) USD 3,301.6 million
Cellular Renewal Actives Market Forecast Value in (2035F) USD 10,502.3 million
Forecast CAGR (2025 to 2035) 12.3%

During the first five-year period from 2025 to 2030, the market increases from USD 3,301.6 million to USD 5,888.5 million, adding USD 2,586.9 million, which accounts for 35.9% of the total decade growth. This phase records steady adoption of retinoids, AHAs, and peptides across skincare serums, creams, and peeling solutions. The rise is driven by consumer demand for visible cell renewal, texture refinement, and dermatologist-tested actives. Serums dominate this period as they cater to over 51% of consumer demand, being lightweight, fast-absorbing, and suitable for daily routines.

The second half from 2030 to 2035 contributes USD 4,613.8 million, equal to 64.1% of total growth, as the market jumps from USD 5,888.5 million to USD 10,502.3 million. This acceleration is powered by the mainstreaming of clean-label claims, premium dermatology clinic partnerships, and consumer shift toward clinical-grade formulations. Beyond serums, masks/pads and advanced creams/lotions gain traction as multifunctional formats. The radiance and anti-aging & firmness functions accelerate, while peptides and growth factors rise in prominence as next-generation actives. Distribution expands across pharmacies, e-commerce, and premium beauty retail, reinforcing the omnichannel approach of leading brands.

From 2020 to 2024, the Cellular Renewal Actives Market grew steadily from USD 2,100 million to USD 3,000 million, driven by strong consumer adoption of serum-based AHAs, retinoids, and peptide-infused formulations. During this period, the competitive landscape was dominated by mass-premium brands like The Ordinary, Paula’s Choice, and La Roche-Posay, which controlled over 20% of combined revenue in key online channels. Competitive differentiation relied on clinical validation, visible performance in 4-8 weeks, and affordability, while luxury clinical-grade solutions remained niche but growing. Service-based models such as dermatologist-led subscription skincare contributed less than 8% of total market value.

Demand for cellular renewal actives will expand to USD 3,301.6 million in 2025, and the revenue mix will shift as dermatologist-tested and clean-label claims grow beyond 50% share. Traditional active-led players face rising competition from clinical-grade innovators offering enzyme-based resurfacing, peptide-growth factor blends, and PHA-based sensitive skin exfoliants. Major serum and clinical skincare vendors are pivoting toward hybrid models that combine e-commerce subscription, dermatology clinic endorsements, and premium retail partnerships. Emerging entrants focusing on bio-fermented actives, microbiome-safe exfoliants, and peptide innovations are gaining share. The competitive advantage is moving away from just product strength to holistic efficacy, safety perception, and claim credibility.

Why the Cellular Renewal Actives Market is growing?

Advances in active class innovation have significantly improved performance and consumer safety. Retinoids and retinols, long considered gold-standard for renewal, are now offered in encapsulated and stabilized forms to reduce irritation, expanding adoption among sensitive skin consumers. The popularity of AHAs, BHAs, and PHAs reflects growing consumer awareness of chemical exfoliation for texture smoothing, while enzyme-based actives like papain and bromelain are carving out a niche for gentler exfoliation.

The market is also driven by peptides and growth factors, which not only stimulate cellular renewal but also support firmness and anti-aging outcomes, aligning with premium skincare positioning. Industries such as dermatology clinics, pharmacies, and premium beauty retail are reinforcing credibility through dermatologist-tested claims, which now account for over 50% of global market share.

The expansion of e-commerce and subscription-based sales models has fueled rapid access to renewal actives. Innovations in serum textures, peeling solutions, and multifunctional creams are expected to open new application areas. Segment growth is expected to be led by cell turnover/renewal in functions, serums in product types, and dermatologist-tested claims in consumer preference, given their clinical backing and growing visibility through KOL dermatologists and social media amplification.

Segmental Analysis

The Cellular Renewal Actives Market is segmented by active class, function, product type, channel, and claim. Active classes include retinoids/retinals, AHAs/BHAs/PHAs, enzymes (papain, bromelain), and peptides/growth factors, highlighting the core actives driving adoption. Functions are categorized into cell turnover/renewal, texture smoothing, radiance enhancement, and anti-aging & firmness, representing distinct consumer needs.

Product types encompass serums, peeling solutions, creams/lotions, and masks/pads, reflecting multiple skincare routines. Channels of purchase include e-commerce, pharmacies, dermatology clinics, and premium beauty retail, covering both direct-to-consumer and professional distribution. Claims span dermatologist-tested, clinical-grade, clean-label, and fragrance-free, underscoring how credibility, safety, and sustainability drive consumer choice.
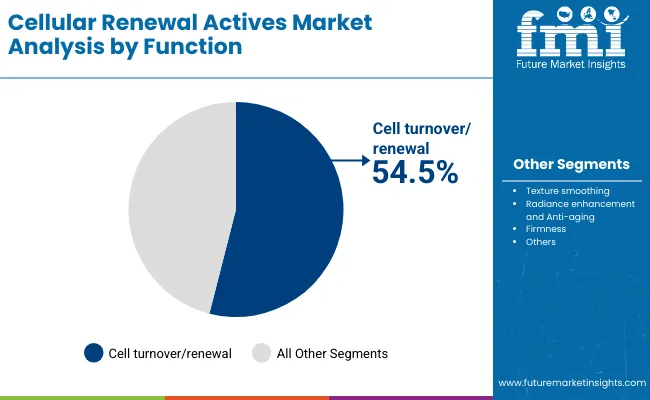
Insights into the Function Segment with Cell Turnover/Renewal Leading in Market Share

Cellular Renewal Actives Market By Function

Function Value Share% 2025
Cell turnover/renewal 54.5%
Others 45.5%

The cell turnover/renewal function is projected to contribute 54.5% of the global market revenue in 2025, maintaining its lead as the dominant category. This is driven by the widespread use of retinoids and AHAs, which accelerate the natural shedding of dead skin cells and encourage healthier renewal. Consumers increasingly seek products that deliver visible changes in smoothness, brightness, and fine line reduction, positioning this function as the backbone of the category.

The segment’s growth is also supported by the mainstream acceptance of dermatologist-recommended retinoids and the innovation of gentler alternatives like retinaldehyde and PHAs for sensitive users. As clinical validation and digital dermatology consultations rise, cell turnover remains the central claim for renewal actives, ensuring its leadership over the decade.
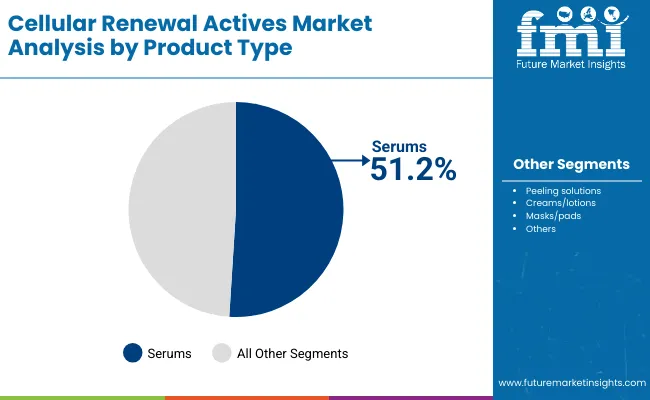
Insights into the Product Type Segment with Serums Dominating the Demand

Cellular Renewal Actives Market By Product

Product Type Value Share% 2025
Serums 51.2%
Others 48.8%

The serums segment is forecasted to hold 51.2% of the market share in 2025, led by its lightweight, fast-absorbing format suited for high concentration delivery. These products are favored for their ability to penetrate deeper layers and offer targeted results, making them the most trusted format for renewal-focused consumers.

Their compact design, versatility across AHAs, retinoids, peptides, and enzymes, and strong alignment with dermatologist-tested claims have facilitated their dominance in e-commerce, pharmacies, and clinical settings. As consumers increasingly adopt layered skincare routines, serums are expected to remain the flagship delivery system for cellular renewal actives well into 2035.
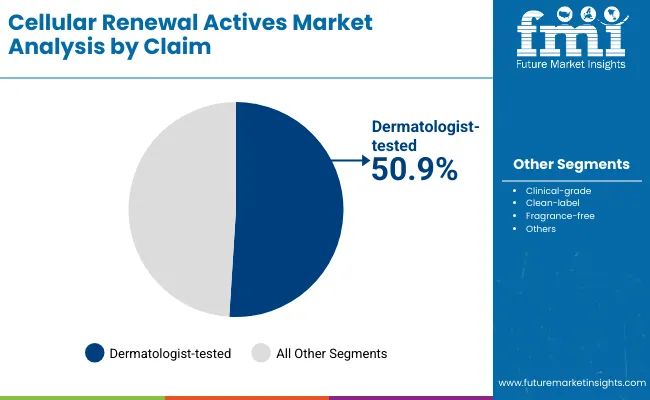
Insights into the Claim Segment with Dermatologist-Tested Claims Leading the Demand

Cellular Renewal Actives Market By Claim

Claim Value Share% 2025
Dermatologist-tested 50.9%
Others 49.1%

The dermatologist-tested segment is projected to account for 50.9% of global market revenue in 2025, underscoring the importance of clinical credibility in consumer decision-making. With rising sensitivity concerns and growing regulatory scrutiny, dermatologist-tested positioning assures consumers of safety and efficacy.

This claim resonates strongly in markets like the USA, Germany, and UK, where regulatory frameworks and professional endorsements heavily influence purchasing decisions. In Asia, particularly China and India, the claim boosts consumer trust in relatively new brands entering the renewal actives space. As clinical-grade and clean-label trends converge, dermatologist-tested validation will remain the most influential claim, reinforcing consumer loyalty and premium pricing.

What are the Drivers, Restraints, and Key Trends of the Cellular Renewal Actives Market?

Drivers

Rising Consumer Shift Toward Clinical-Grade and Dermatologist-Tested Claims

One of the strongest drivers in the Cellular Renewal Actives Market is the growing consumer reliance on clinical-grade and dermatologist-tested formulations. With over 50.9% of market value in 2025 attributed to dermatologist-tested claims, it is evident that consumer trust is anchored in clinical validation. This demand is particularly strong in mature markets such as the USA and Germany, where regulatory oversight and consumer skepticism of “beauty-only” positioning push brands to secure dermatological endorsements, publish trial data, and highlight safety testing.

For example, brands like SkinCeuticals and La Roche-Posay have leveraged their clinical-grade heritage to dominate pharmacy and dermatology clinic channels, effectively blurring the line between skincare and treatment. This driver is amplified by social media dermatologists (DermTok, YouTube KOLs) who frequently recommend clinically tested actives, accelerating adoption across both premium beauty retail and e-commerce. As consumer awareness of long-term safety increases, clinical validation will not only sustain demand but also justify premium pricing and expand the clinic-pharmacy channel.

Rapid Growth in Emerging Asian Markets with Younger Demographics

Markets such as India (CAGR 22.2%) and China (CAGR 18.7%) are accelerating demand for cellular renewal actives, driven by demographic and lifestyle-specific factors. These countries have a relatively younger consumer base, which is increasingly exposed to preventive skincare concepts through K-beauty, J-beauty, and influencer-led education. Unlike Western markets, where cellular renewal is often associated with anti-aging, in Asia it is framed as glow, radiance, and preventive skin health.

Serums and peeling solutions dominate in these regions because younger consumers prefer affordable, fast-acting, and lightweight products that can integrate into multi-step routines. E-commerce platforms like Tmall, Nykaa, and Lazada are accelerating access, while local players are launching PHA-based and enzyme-led actives to differentiate from harsher Western AHA/BHA formulas. This driver is crucial because these regions are not only growing faster than global averages but also influencing global product development encouraging brands to develop sensitive-skin safe and multifunctional actives tailored to Gen Z and millennials.

Restraints

Irritation and Tolerance Barriers in Active Classes

While retinoids and AHAs dominate renewal claims, their high irritation potential remains a major restraint. Consumers with sensitive skin or specific conditions (eczema, rosacea) often experience redness, dryness, and purging, which limits repeat purchase rates. This barrier is evident in Western markets, where demand for gentler alternatives such as retinaldehyde, PHAs, and enzyme actives is rising. The irritation issue also restricts penetration into dermatology clinics for sensitive patients and into broader mainstream retail where tolerance-friendly formulations are prioritized.

Brands are investing in encapsulation, micro-dosing, and time-release formulations to overcome this restraint, but the negative perception of “harsh exfoliants” still slows growth in consumer adoption. This is particularly challenging in pharmacy channels, where consumers expect safety-first skincare. As a result, innovation must focus on stability + tolerability alongside efficacy, or risk losing long-term consumer loyalty.

Regulatory Complexity and Ingredient Scrutiny Across Regions

The global market is restrained by regulatory fragmentation around active classes such as retinoids, peptides, and growth factors. In the EU, strict guidelines around concentration levels and permissible claims restrict how brands market their products compared to more lenient regions like the USA or Asia. Similarly, China’s National Medical Products Administration (NMPA) has introduced stringent filing and testing requirements for functional cosmetics, making clinical claims (anti-aging, renewal) harder to substantiate without extensive data.

This complexity not only slows time-to-market for global brands but also increases compliance costs, particularly for smaller entrants. Companies must often reformulate products for different regions, creating inefficiencies. Regulatory caution around stem-cell derived peptides or growth factors is another bottleneck, as these high-potential actives are under heavy scrutiny for safety and ethical concerns. As claims become more aggressive (“clinically proven to reverse aging”), compliance pressures will intensify, restraining free market expansion.

Key Trends

Bio-Fermented and Enzyme-Based Renewal Actives as Gentle Alternatives

A key trend reshaping the global market is the shift toward bio-fermented and enzyme-led actives (e.g., papain, bromelain). Unlike traditional AHAs and retinoids, these actives offer gentler exfoliation and renewal by breaking down proteins on the skin surface, making them highly suitable for sensitive skin and daily use. Their popularity is rising in Asia and Europe, where demand for clean-label and low-irritation solutions is higher.

Fermentation technologies are further introducing postbiotic and microbiome-balancing renewal actives, which combine cell turnover with barrier protection an angle that directly addresses consumer concerns about over-exfoliation. Global brands like Drunk Elephant and Sunday Riley are experimenting with enzyme blends in masks/pads and peeling solutions, positioning them as “modern exfoliation” alternatives. This trend represents not only product innovation but also a shift in consumer education, emphasizing gentleness and skin health over aggressive resurfacing.

Integration of Peptides and Growth Factors into Anti-Aging Renewal

While retinoids and AHAs remain strong, the fastest-growing innovation trend is the integration of peptides and growth factors into renewal products. These actives move beyond simple exfoliation, targeting cell signaling, collagen production, and firmness restoration. Their role in anti-aging & firmness aligns with rising consumer interest in multi-benefit skincare.

Premium brands like SkinCeuticals and Neostrata are leading in this space, combining peptides with established actives (retinoids, AHAs) to create hybrid formulations that deliver renewal plus structural repair. In Asia, bioengineered growth factors are being marketed as next-generation solutions for skin regeneration, appealing to both younger preventive users and older anti-aging consumers. This trend marks a shift from single-active hero formulations to synergistic blends, creating competitive differentiation while also raising barriers for smaller players due to R&D intensity.
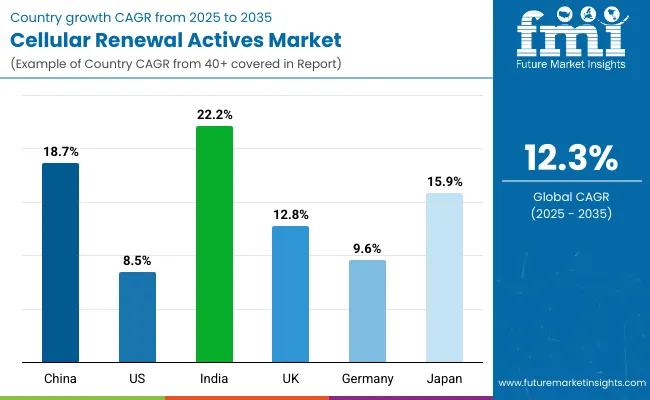
Analysis of Cellular Renewal Actives Market By Key Countries

Cellular Renewal Actives Market By Country

Countries Estimated CAGR (2025 to 2035)
China 18.7%
USA 8.5%
India 22.2%
UK 12.8%
Germany 9.6%
Japan 15.9%

The Cellular Renewal Actives Market is witnessing highly uneven growth across countries, shaped by demographic profiles, consumer preferences, and channel dynamics. India leads with a CAGR of 22.2%, driven by a young and urbanizing population increasingly educated about preventive skincare and active-based routines. Affordable serums and peeling solutions dominate, distributed heavily through e-commerce and pharmacy chains.

China follows with a CAGR of 18.7%, where the appetite for premium serums and clinical-grade claims is accelerating. The market here benefits from strong K-beauty and J-beauty influences, a rising middle class, and regulatory reforms encouraging product innovation. Japan, at 15.9% CAGR, reflects mature yet dynamic demand where renewal actives are positioned more toward gentle, enzyme-based and PHA formulations, aligning with the country’s preference for subtle, long-term skin health rather than aggressive exfoliation.

On the other hand, growth in Western markets is steady but more moderate. The USA at 8.5% CAGR shows resilience, anchored by high adoption of dermatologist-tested formulations and a strong clinical-grade positioning in dermatology clinics and pharmacies. Germany (9.6% CAGR) is shaped by pharmacy-led trust, where regulatory rigor ensures dermatologist-backed claims dominate.

The UK, at 12.8% CAGR, shows a stronger tilt toward premium beauty retail and e-commerce adoption, with consumers responding well to influencer-driven education on retinoids and peptides. Collectively, this regional divergence indicates that Asia-Pacific will serve as the growth engine, particularly India, China, and Japan, while the USA and Europe will continue to represent strong value pools where clinical validation and safety claims remain the decisive purchase factors.
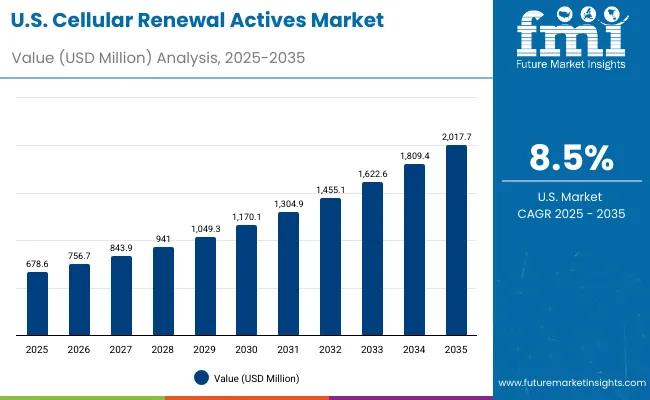
Sales Outlook for Cellular Renewal Actives in the United States

Cellular Renewal Actives Market Usa

Year USA Cellular Renewal Actives Market (USD Million)
2025 678.6
2026 756.7
2027 843.9
2028 941.0
2029 1,049.3
2030 1,170.1
2031 1,304.9
2032 1,455.1
2033 1,622.6
2034 1,809.4
2035 2,017.7

The Cellular Renewal Actives Market in the United States is projected to grow at a CAGR of 8.5%, led by consumer preference for dermatologist-tested and clinical-grade formulations. Demand is particularly strong in pharmacies and dermatology clinics, where cell turnover/renewal products account for over 54% share. Serums dominate the USA landscape due to their efficacy-driven perception and ability to integrate into multi-step routines, while creams/lotions expand adoption among mature consumers seeking anti-aging benefits. Rising consumer awareness of peptides and growth factors is diversifying demand away from just retinoids and AHAs. Regulatory scrutiny and emphasis on safety claims create opportunities for premium brands to differentiate through clinical studies and endorsements from dermatology KOLs.

  • Dermatologist-tested claims are the strongest purchase driver in the USA market.
  • Serums remain the most dominant format across both e-commerce and pharmacy channels.
  • Peptide and growth factor innovations are gaining share in anti-aging and firmness applications.

Growth and Expansion Outlook for Cellular Renewal Actives in the United Kingdom

The Cellular Renewal Actives Market in the United Kingdom is expected to grow at a CAGR of 12.8%, supported by applications in premium beauty retail, dermatology clinics, and online subscription services. British consumers are highly responsive to influencer-driven education on actives such as retinoids and AHAs, which has accelerated serum adoption. At the same time, clinical-grade and clean-label claims are boosting credibility, especially in pharmacy-driven purchases. Masks and pads are increasingly popular in the UK, positioned as convenient “at-home clinic” solutions for exfoliation and radiance enhancement. Partnerships between premium retailers and dermocosmetic brands are further fueling market penetration.

  • Premium beauty retail and e-commerce drive active-based skincare adoption in the UK.
  • Consumers are responding strongly to influencer-led education on retinoids and exfoliating acids.
  • Masks/pads are emerging as convenience-led delivery systems for renewal actives.

Growth and Expansion Outlook for Cellular Renewal Actives in India

India is witnessing rapid growth in the Cellular Renewal Actives Market, forecast to expand at a CAGR of 22.2% through 2035, the highest globally. A sharp increase in serum and peeling solution demand is driven by urban Gen Z and millennial consumers, who adopt preventive skincare routines early. Tier-2 and tier-3 cities are showing rising penetration through cost-effective e-commerce platforms and pharmacy chains. Affordable PHA-based and enzyme-led actives are gaining popularity as gentler alternatives to stronger retinoids and AHAs, helping overcome sensitivity barriers. Educational outreach by dermatologists and beauty influencers is accelerating awareness, while international brands entering India are partnering with local online-first retailers for rapid scale-up.
  • Serum and peeling solution adoption is surging among urban youth in India.
  • Enzyme and PHA-based actives are penetrating sensitive-skin segments.
  • E-commerce and pharmacy chains are expanding renewal actives into smaller cities.

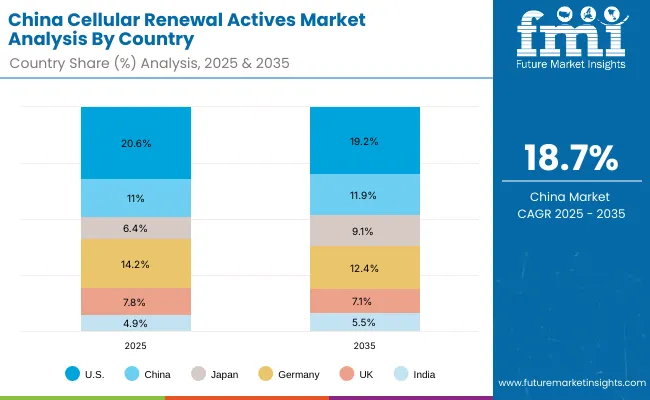
Sales Outlook for Cellular Renewal Actives in China

Cellular Renewal Actives Market China

The Cellular Renewal Actives Market in China is expected to grow at a CAGR of 18.7%, among the highest of leading economies. This momentum is driven by premium serum adoption, clinical-grade positioning, and K-beauty/J-beauty influences that emphasize exfoliation and radiance. E-commerce platforms such as Tmall and JD.com are critical growth enablers, while local C-beauty brands are competing through enzyme and peptide innovation. Demand for masks/pads is accelerating, as consumers embrace weekly at-home exfoliation as part of multi-step routines. Regulatory reforms are tightening claim requirements, but they also create trust and opportunity for brands that can prove clinical efficacy and dermatologist-tested safety.
  • E-commerce giants are shaping adoption of renewal actives in China.
  • Local C-beauty brands are innovating with enzyme-based and peptide-led solutions.
  • Masks/pads and serums dominate consumer preference, aligned with multi-step routines.

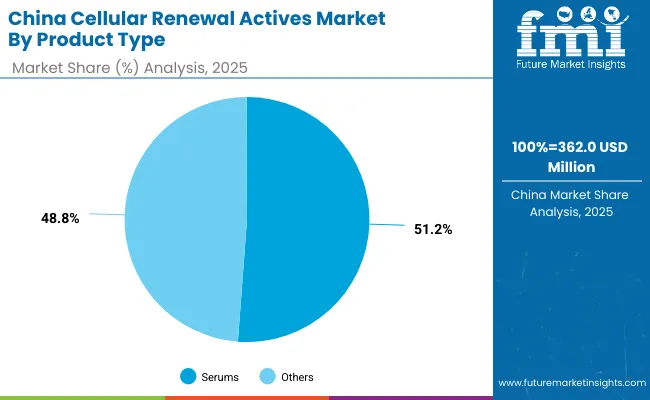
Opportunity Analysis of China Cellular Renewal Actives Market

Cellular Renewal Actives Market China 2

China by Product Type Value Share% 2025
Serums 51.2%
Others 48.8%

The Cellular Renewal Actives Market in China is valued at USD 362.0 million in 2025, with serums leading at 51.2%. The dominance of serums is a direct outcome of China’s multi-step skincare routines, influenced heavily by K-beauty and J-beauty traditions, where lightweight, high-potency formats are preferred for layering. Chinese consumers increasingly demand visible radiance and texture improvements, which has accelerated the adoption of serum-based AHAs, retinoids, and peptides. Portability, versatility, and compatibility with both daily and weekly routines enhance adoption, allowing serums to integrate into both mass-market e-commerce brands and clinical-grade dermatology offerings.

This advantage positions serums as the essential format for exfoliation, renewal, and preventive anti-aging, while masks/pads remain popular for episodic radiance boosts. Clean-label and clinical-grade claims are gaining traction among China’s rising middle-class consumers, with peptides and enzyme-based renewal actives increasingly marketed as gentler, science-backed alternatives. As the country continues its digital-first retail expansion, AI-driven personalization tools on platforms such as Tmall and JD.com will strengthen serum penetration and fuel mass-market accessibility.
  • Market size for China in 2025 is USD 362.0 million
  • Global market share is approximately 11.0%
  • Serums lead at 51.2% due to layering routines and clinical-grade positioning

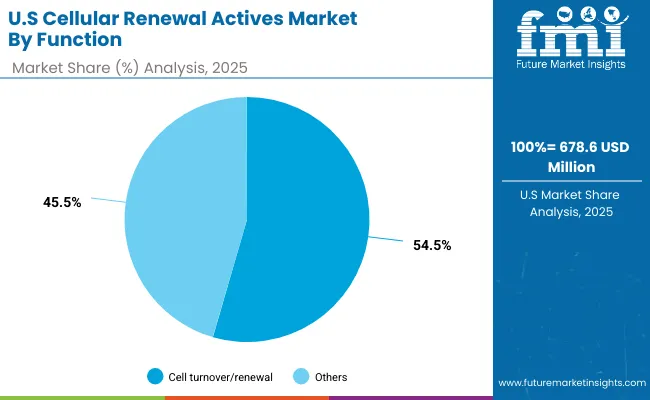
Opportunity Analysis of United States Cellular Renewal Actives Market

Cellular Renewal Actives Market Usa 2

USA by Function Value Share% 2025
Cell turnover/renewal 54.5%
Others 45.5%

The Cellular Renewal Actives Market in the United States is valued at USD 678.6 million in 2025, with cell turnover/renewal leading at 54.5%. This dominance reflects the USA consumer preference for scientifically validated, performance-driven formulations, especially those backed by dermatologist endorsements. Products focusing on cell renewal, such as retinoids and exfoliating acids, are heavily adopted in pharmacies and dermatology clinics, where safety and clinical claims hold significant weight. Anti-aging and firmness benefits are often communicated as secondary outcomes of renewal-focused products, strengthening this segment’s lead.

The USA market also benefits from a strong ecosystem of dermatology KOLs, subscription skincare platforms, and premium pharmacy chains, which amplify demand for dermatologist-tested renewal actives. While serums dominate in channel versatility, creams and lotions are also popular among older demographics for anti-aging. As regulatory oversight and consumer awareness intensify, clinical-backed renewal actives will continue to expand across both professional and consumer skincare spaces, making this segment the backbone of USA adoption.
  • Market size for the USA in 2025 is USD 678.6 million
  • Global market share is approximately 20.6%
  • Cell turnover/renewal leads at 54.5%, anchored by retinoids and AHA-led formulations

Competitive Landscape of the Cellular Renewal Actives Market

Cellular Renewal Actives Market By Company

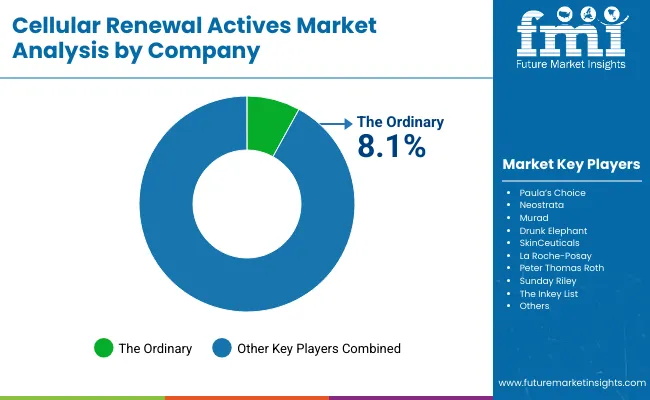
The Cellular Renewal Actives Market is moderately fragmented, with mass-premium brands, clinical-grade dermocosmetic leaders, and niche innovators competing across diverse channels. Leading players such as The Ordinary, Paula’s Choice, and La Roche-Posay hold significant share, driven by their serum-first strategies, affordability, and dermatologist-tested claims. Their strategies increasingly emphasize online distribution, clinical trial validation, and clean-label formulations to retain trust among sensitive-skin consumers. Premium players including SkinCeuticals, Neostrata, and Murad are expanding clinical-grade positioning through pharmacy and dermatology clinics, where dermatologist endorsements accelerate credibility. These brands are accelerating adoption through peptide- and growth factor-based actives, making them highly relevant for anti-aging and firmness solutions.

Niche-focused providers such as Peter Thomas Roth, Sunday Riley, and The Inkey List drive differentiation with innovative textures, influencer partnerships, and hybrid enzyme/acid blends that appeal to early adopters and Gen Z. Their strength lies in customization, agility, and trend-led product launches rather than global scale.

Competitive differentiation is shifting away from single active hero formulas toward integrated product ecosystems that include multi-active blends, clinical claims, subscription-based retail models, and dermatologist collaborations. This reflects a broader market transition from affordable, efficacy-driven mass serums toward ecosystem-based skincare portfolios that combine scientific validation, omnichannel retail, and consumer education.

Key Developments in Cellular Renewal Actives Market

  • On March 7, 2024, The Ordinary launched its Retinal 0.2% Emulsion, a high-strength retinaldehyde formulation targeted at “advanced users.” This innovation uses an encapsulated form of retinaldehyde (enclosed in hydroxyapatite particles) to increase efficacy while including synthetic oat analogues to reduce irritation. It is marketed as delivering visible improvements in fine lines, texture, tone, and radiance, with significant reductions in frown lines and crow’s feet after six weeks.
  • On July 23, 2024, SkinCeuticals introduced P-TIOX, a clinically backed peptide serum designed to reduce expression wrinkles and reveal “glass skin” radiance. The formulation combines an advanced peptide complex with synergistic actives (polyhydroxy acid, niacinamide, and laminaria extract) to address nine types of contraction lines, including areas not commonly treated with neurotoxin injections. This move signified a shift toward topicals that aim to mimic injectable benefits, giving consumers non-invasive options for wrinkle modulation.

Scope of the Report

Item Value
Quantitative Units USD 3,301.6 million
Active Class Retinoids / retinals, AHAs/BHAs/PHAs, Enzymes (papain, bromelain), and Peptides/growth factors
Function Cell turnover/renewal, Texture smoothing, Radiance enhancement, and Anti-aging & firmness
Product Type Serums, Peeling solutions, Creams/lotions, and Masks/pads
Channel E-commerce, Pharmacies, Dermatology clinics, and Premium beauty retail
Claim Dermatologist-tested, Clinical-grade, Clean-label, and Fragrance-free
Regions Covered North America, Europe, Asia-Pacific, Latin America, Middle East & Africa
Country Covered United States, Canada, Germany, France, United Kingdom, China, Japan, India, Brazil, South Africa
Key Companies Profiled The Ordinary, Paula’s Choice, Neostrata, Murad, Drunk Elephant, SkinCeuticals, La Roche- Posay, Peter Thomas Roth, Sunday Riley, The Inkey List
Additional Attributes Dollar sales by product type and function, adoption trends in dermatology clinics and e-commerce, rising demand for serums as the leading delivery format, sector-specific growth in anti-aging and radiance-enhancement functions, segmentation of sales by clinical-grade and dermatologist-tested claims, integration of AI-based personalization in e-commerce platforms, regional trends influenced by consumer demographics and skincare culture, and innovations in encapsulated retinoids, PHAs, a nd peptide-growth factor blends.

Key Segments

By Active Class:

  • Retinoids/retinals
  • AHAs/BHAs/PHAs
  • Enzymes (papain, bromelain)
  • Peptides/growth factors

By Function:

  • Cell turnover/renewal
  • Texture smoothing
  • Radiance enhancement
  • Anti-aging & firmness

By Product Type:

  • Serums
  • Peeling solutions
  • Creams/lotions
  • Masks/pads

By Channel:

  • E-commerce
  • Pharmacies
  • Dermatology clinics
  • Premium beauty retail

By Claim:

  • Dermatologist-tested
  • Clinical-grade
  • Clean-label
  • Fragrance-free

By Region:

  • North America
  • Latin America
  • Europe
  • East Asia
  • South Asia & Pacific
  • Middle East and Africa

Table of Content

  1. Executive Summary
    • Global Market Outlook
    • Demand-side Trends
    • Supply-side Trends
    • Technology Roadmap Analysis
    • Analysis and Recommendations
  2. Market Overview
    • Market Coverage / Taxonomy
    • Market Definition / Scope / Limitations
  3. Market Background
    • Market Dynamics
      • Drivers
      • Restraints
      • Opportunity
      • Trends
    • Scenario Forecast
      • Demand in Optimistic Scenario
      • Demand in Likely Scenario
      • Demand in Conservative Scenario
    • Opportunity Map Analysis
    • Product Life Cycle Analysis
    • Supply Chain Analysis
    • Investment Feasibility Matrix
    • Value Chain Analysis
    • PESTLE and Porter’s Analysis
    • Regulatory Landscape
    • Regional Parent Market Outlook
    • Production and Consumption Statistics
    • Import and Export Statistics
  4. Global Market Analysis 2020 to 2024 and Forecast, 2025 to 2035
    • Historical Market Size Value (USD Million) Analysis, 2020 to 2024
    • Current and Future Market Size Value (USD Million) Projections, 2025 to 2035
      • Y-o-Y Growth Trend Analysis
      • Absolute $ Opportunity Analysis
  5. Global Market Pricing Analysis 2020 to 2024 and Forecast 2025 to 2035
  6. Global Market Analysis 2020 to 2024 and Forecast 2025 to 2035, By Active Class
    • Introduction / Key Findings
    • Historical Market Size Value (USD Million) Analysis By Active Class, 2020 to 2024
    • Current and Future Market Size Value (USD Million) Analysis and Forecast By Active Class, 2025 to 2035
      • Retinoids/retinals
      • AHAs/BHAs/PHAs
      • Enzymes (papain, bromelain)
      • Peptides/growth factors
    • Y-o-Y Growth Trend Analysis By Active Class, 2020 to 2024
    • Absolute $ Opportunity Analysis By Active Class, 2025 to 2035
  7. Global Market Analysis 2020 to 2024 and Forecast 2025 to 2035, By Function
    • Introduction / Key Findings
    • Historical Market Size Value (USD Million) Analysis By Function, 2020 to 2024
    • Current and Future Market Size Value (USD Million) Analysis and Forecast By Function, 2025 to 2035
      • Cell turnover/renewal
      • Texture smoothing
      • Radiance enhancement
      • Anti-aging & firmness
    • Y-o-Y Growth Trend Analysis By Function, 2020 to 2024
    • Absolute $ Opportunity Analysis By Function, 2025 to 2035
  8. Global Market Analysis 2020 to 2024 and Forecast 2025 to 2035, By Product Type
    • Introduction / Key Findings
    • Historical Market Size Value (USD Million) Analysis By Product Type, 2020 to 2024
    • Current and Future Market Size Value (USD Million) Analysis and Forecast By Product Type, 2025 to 2035
      • Serums
      • Peeling solutions
      • Creams/lotions
      • Masks/pads
    • Y-o-Y Growth Trend Analysis By Product Type, 2020 to 2024
    • Absolute $ Opportunity Analysis By Product Type, 2025 to 2035
  9. Global Market Analysis 2020 to 2024 and Forecast 2025 to 2035, By Channel
    • Introduction / Key Findings
    • Historical Market Size Value (USD Million) Analysis By Channel, 2020 to 2024
    • Current and Future Market Size Value (USD Million) Analysis and Forecast By Channel, 2025 to 2035
      • E-commerce
      • Pharmacies
      • Dermatology clinics
      • Premium beauty retail
    • Y-o-Y Growth Trend Analysis By Channel, 2020 to 2024
    • Absolute $ Opportunity Analysis By Channel, 2025 to 2035
  10. Global Market Analysis 2020 to 2024 and Forecast 2025 to 2035, By Claim
    • Introduction / Key Findings
    • Historical Market Size Value (USD Million) Analysis By Claim, 2020 to 2024
    • Current and Future Market Size Value (USD Million) Analysis and Forecast By Claim, 2025 to 2035
      • Dermatologist-tested
      • Clinical-grade
      • Clean-label
      • Fragrance-free
    • Y-o-Y Growth Trend Analysis By Claim, 2020 to 2024
    • Absolute $ Opportunity Analysis By Claim, 2025 to 2035
  11. Global Market Analysis 2020 to 2024 and Forecast 2025 to 2035, By Region
    • Introduction
    • Historical Market Size Value (USD Million) Analysis By Region, 2020 to 2024
    • Current Market Size Value (USD Million) Analysis and Forecast By Region, 2025 to 2035
      • North America
      • Latin America
      • Europe
      • East Asia
      • South Asia & Pacific
      • Middle East and Africa
    • Market Attractiveness Analysis By Region
  12. North America Market Analysis 2020 to 2024 and Forecast 2025 to 2035, By Country
    • Historical Market Size Value (USD Million) Trend Analysis By Market Taxonomy, 2020 to 2024
    • Market Size Value (USD Million) Forecast By Market Taxonomy, 2025 to 2035
      • By Country
        • USA
        • Canada
      • By Active Class
      • By Function
      • By Product Type
      • By Channel
      • By Claim
    • Market Attractiveness Analysis
      • By Country
      • By Active Class
      • By Function
      • By Product Type
      • By Channel
      • By Claim
    • Key Takeaways
  13. Latin America Market Analysis 2020 to 2024 and Forecast 2025 to 2035, By Country
    • Historical Market Size Value (USD Million) Trend Analysis By Market Taxonomy, 2020 to 2024
    • Market Size Value (USD Million) Forecast By Market Taxonomy, 2025 to 2035
      • By Country
        • Brazil
        • Mexico
        • Colombia
        • Rest of Latin America
      • By Active Class
      • By Function
      • By Product Type
      • By Channel
      • By Claim
    • Market Attractiveness Analysis
      • By Country
      • By Active Class
      • By Function
      • By Product Type
      • By Channel
      • By Claim
    • Key Takeaways
  14. Europe Market Analysis 2020 to 2024 and Forecast 2025 to 2035, By Country
    • Historical Market Size Value (USD Million) Trend Analysis By Market Taxonomy, 2020 to 2024
    • Market Size Value (USD Million) Forecast By Market Taxonomy, 2025 to 2035
      • By Country
        • Germany
        • UK
        • France
        • Italy
        • Spain
        • Belgium
        • Netherlands
        • Nordic
        • Switzerland
        • Russia
        • Poland
        • Rest of Europe
      • By Active Class
      • By Function
      • By Product Type
      • By Channel
      • By Claim
    • Market Attractiveness Analysis
      • By Country
      • By Active Class
      • By Function
      • By Product Type
      • By Channel
      • By Claim
    • Key Takeaways
  15. East Asia Market Analysis 2020 to 2024 and Forecast 2025 to 2035, By Country
    • Historical Market Size Value (USD Million) Trend Analysis By Market Taxonomy, 2020 to 2024
    • Market Size Value (USD Million) Forecast By Market Taxonomy, 2025 to 2035
      • By Country
        • China
        • Japan
        • South Korea
      • By Active Class
      • By Function
      • By Product Type
      • By Channel
      • By Claim
    • Market Attractiveness Analysis
      • By Country
      • By Active Class
      • By Function
      • By Product Type
      • By Channel
      • By Claim
    • Key Takeaways
  16. South Asia & Pacific Market Analysis 2020 to 2024 and Forecast 2025 to 2035, By Country
    • Historical Market Size Value (USD Million) Trend Analysis By Market Taxonomy, 2020 to 2024
    • Market Size Value (USD Million) Forecast By Market Taxonomy, 2025 to 2035
      • By Country
        • India
        • Thailand
        • Malaysia
        • Indonesia
        • Singapore
        • Vietnam
        • Australia
        • New Zealand
        • Rest of South Asia
      • By Active Class
      • By Function
      • By Product Type
      • By Channel
      • By Claim
    • Market Attractiveness Analysis
      • By Country
      • By Active Class
      • By Function
      • By Product Type
      • By Channel
      • By Claim
    • Key Takeaways
  17. Middle East and Africa Market Analysis 2020 to 2024 and Forecast 2025 to 2035, By Country
    • Historical Market Size Value (USD Million) Trend Analysis By Market Taxonomy, 2020 to 2024
    • Market Size Value (USD Million) Forecast By Market Taxonomy, 2025 to 2035
      • By Country
        • Turkey
        • UAE
        • Saudi Arabia
        • Israel
        • Other GCC Countries
        • North Africa
        • South Africa
      • By Active Class
      • By Function
      • By Product Type
      • By Channel
      • By Claim
    • Market Attractiveness Analysis
      • By Country
      • By Active Class
      • By Function
      • By Product Type
      • By Channel
      • By Claim
    • Key Takeaways
  18. Key Countries Market Analysis
    • USA
      • Pricing Analysis
      • Market Share Analysis, 2024
        • By Active Class
        • By Function
        • By Product Type
        • By Channel
        • By Claim
    • Canada
      • Pricing Analysis
      • Market Share Analysis, 2024
        • By Active Class
        • By Function
        • By Product Type
        • By Channel
        • By Claim
    • Mexico
      • Pricing Analysis
      • Market Share Analysis, 2024
        • By Active Class
        • By Function
        • By Product Type
        • By Channel
        • By Claim
    • Brazil
      • Pricing Analysis
      • Market Share Analysis, 2024
        • By Active Class
        • By Function
        • By Product Type
        • By Channel
        • By Claim
    • Chile
      • Pricing Analysis
      • Market Share Analysis, 2024
        • By Active Class
        • By Function
        • By Product Type
        • By Channel
        • By Claim
    • Germany
      • Pricing Analysis
      • Market Share Analysis, 2024
        • By Active Class
        • By Function
        • By Product Type
        • By Channel
        • By Claim
    • UK
      • Pricing Analysis
      • Market Share Analysis, 2024
        • By Active Class
        • By Function
        • By Product Type
        • By Channel
        • By Claim
    • Italy
      • Pricing Analysis
      • Market Share Analysis, 2024
        • By Active Class
        • By Function
        • By Product Type
        • By Channel
        • By Claim
    • Spain
      • Pricing Analysis
      • Market Share Analysis, 2024
        • By Active Class
        • By Function
        • By Product Type
        • By Channel
        • By Claim
    • France
      • Pricing Analysis
      • Market Share Analysis, 2024
        • By Active Class
        • By Function
        • By Product Type
        • By Channel
        • By Claim
    • India
      • Pricing Analysis
      • Market Share Analysis, 2024
        • By Active Class
        • By Function
        • By Product Type
        • By Channel
        • By Claim
    • ASEAN
      • Pricing Analysis
      • Market Share Analysis, 2024
        • By Active Class
        • By Function
        • By Product Type
        • By Channel
        • By Claim
    • Australia & New Zealand
      • Pricing Analysis
      • Market Share Analysis, 2024
        • By Active Class
        • By Function
        • By Product Type
        • By Channel
        • By Claim
    • China
      • Pricing Analysis
      • Market Share Analysis, 2024
        • By Active Class
        • By Function
        • By Product Type
        • By Channel
        • By Claim
    • Japan
      • Pricing Analysis
      • Market Share Analysis, 2024
        • By Active Class
        • By Function
        • By Product Type
        • By Channel
        • By Claim
    • South Korea
      • Pricing Analysis
      • Market Share Analysis, 2024
        • By Active Class
        • By Function
        • By Product Type
        • By Channel
        • By Claim
    • Russia
      • Pricing Analysis
      • Market Share Analysis, 2024
        • By Active Class
        • By Function
        • By Product Type
        • By Channel
        • By Claim
    • Poland
      • Pricing Analysis
      • Market Share Analysis, 2024
        • By Active Class
        • By Function
        • By Product Type
        • By Channel
        • By Claim
    • Hungary
      • Pricing Analysis
      • Market Share Analysis, 2024
        • By Active Class
        • By Function
        • By Product Type
        • By Channel
        • By Claim
    • Kingdom of Saudi Arabia
      • Pricing Analysis
      • Market Share Analysis, 2024
        • By Active Class
        • By Function
        • By Product Type
        • By Channel
        • By Claim
    • Turkiye
      • Pricing Analysis
      • Market Share Analysis, 2024
        • By Active Class
        • By Function
        • By Product Type
        • By Channel
        • By Claim
    • South Africa
      • Pricing Analysis
      • Market Share Analysis, 2024
        • By Active Class
        • By Function
        • By Product Type
        • By Channel
        • By Claim
  19. Market Structure Analysis
    • Competition Dashboard
    • Competition Benchmarking
    • Market Share Analysis of Top Players
      • By Regional
      • By Active Class
      • By Function
      • By Product Type
      • By Channel
      • By Claim
  20. Competition Analysis
    • Competition Deep Dive
      • The Ordinary
        • Overview
        • Product Portfolio
        • Profitability by Market Segments (Product/Age /Sales Channel/Region)
        • Sales Footprint
        • Strategy Overview
        • Paula’s Choice
        • Neostrata
        • Murad
        • Drunk Elephant
        • SkinCeuticals
        • La Roche-Posay
        • Peter Thomas Roth
        • Sunday Riley
        • The Inkey List
    • Assumptions & Acronyms Used
    • Research Methodology

List of Tables

  • Table 1: Global Market Value (USD Million) Forecast by Region, 2020-2035
  • Table 2: Global Market Value (USD Million) Forecast by Active Class, 2020-2035
  • Table 3: Global Market Value (USD Million) Forecast by Function, 2020-2035
  • Table 4: Global Market Value (USD Million) Forecast by Product Type, 2020-2035
  • Table 5: Global Market Value (USD Million) Forecast by Channel, 2020-2035
  • Table 6: Global Market Value (USD Million) Forecast by Claim, 2020-2035
  • Table 7: North America Market Value (USD Million) Forecast by Country, 2020-2035
  • Table 8: North America Market Value (USD Million) Forecast by Active Class, 2020-2035
  • Table 9: North America Market Value (USD Million) Forecast by Function, 2020-2035
  • Table 10: North America Market Value (USD Million) Forecast by Product Type, 2020-2035
  • Table 11: North America Market Value (USD Million) Forecast by Channel, 2020-2035
  • Table 12: North America Market Value (USD Million) Forecast by Claim, 2020-2035
  • Table 13: Latin America Market Value (USD Million) Forecast by Country, 2020-2035
  • Table 14: Latin America Market Value (USD Million) Forecast by Active Class, 2020-2035
  • Table 15: Latin America Market Value (USD Million) Forecast by Function, 2020-2035
  • Table 16: Latin America Market Value (USD Million) Forecast by Product Type, 2020-2035
  • Table 17: Latin America Market Value (USD Million) Forecast by Channel, 2020-2035
  • Table 18: Latin America Market Value (USD Million) Forecast by Claim, 2020-2035
  • Table 19: Europe Market Value (USD Million) Forecast by Country, 2020-2035
  • Table 20: Europe Market Value (USD Million) Forecast by Active Class, 2020-2035
  • Table 21: Europe Market Value (USD Million) Forecast by Function, 2020-2035
  • Table 22: Europe Market Value (USD Million) Forecast by Product Type, 2020-2035
  • Table 23: Europe Market Value (USD Million) Forecast by Channel, 2020-2035
  • Table 24: Europe Market Value (USD Million) Forecast by Claim, 2020-2035
  • Table 25: East Asia Market Value (USD Million) Forecast by Country, 2020-2035
  • Table 26: East Asia Market Value (USD Million) Forecast by Active Class, 2020-2035
  • Table 27: East Asia Market Value (USD Million) Forecast by Function, 2020-2035
  • Table 28: East Asia Market Value (USD Million) Forecast by Product Type, 2020-2035
  • Table 29: East Asia Market Value (USD Million) Forecast by Channel, 2020-2035
  • Table 30: East Asia Market Value (USD Million) Forecast by Claim, 2020-2035
  • Table 31: South Asia & Pacific Market Value (USD Million) Forecast by Country, 2020-2035
  • Table 32: South Asia & Pacific Market Value (USD Million) Forecast by Active Class, 2020-2035
  • Table 33: South Asia & Pacific Market Value (USD Million) Forecast by Function, 2020-2035
  • Table 34: South Asia & Pacific Market Value (USD Million) Forecast by Product Type, 2020-2035
  • Table 35: South Asia & Pacific Market Value (USD Million) Forecast by Channel, 2020-2035
  • Table 36: South Asia & Pacific Market Value (USD Million) Forecast by Claim, 2020-2035
  • Table 37: Middle East and Africa Market Value (USD Million) Forecast by Country, 2020-2035
  • Table 38: Middle East and Africa Market Value (USD Million) Forecast by Active Class, 2020-2035
  • Table 39: Middle East and Africa Market Value (USD Million) Forecast by Function, 2020-2035
  • Table 40: Middle East and Africa Market Value (USD Million) Forecast by Product Type, 2020-2035
  • Table 41: Middle East and Africa Market Value (USD Million) Forecast by Channel, 2020-2035
  • Table 42: Middle East and Africa Market Value (USD Million) Forecast by Claim, 2020-2035

List of Figures

  • Figure 1: Global Market Pricing Analysis
  • Figure 2: Global Market Value (USD Million) Forecast 2020-2035
  • Figure 3: Global Market Value Share and BPS Analysis by Active Class, 2025 and 2035
  • Figure 4: Global Market Y-o-Y Growth Comparison by Active Class, 2025-2035
  • Figure 5: Global Market Attractiveness Analysis by Active Class
  • Figure 6: Global Market Value Share and BPS Analysis by Function, 2025 and 2035
  • Figure 7: Global Market Y-o-Y Growth Comparison by Function, 2025-2035
  • Figure 8: Global Market Attractiveness Analysis by Function
  • Figure 9: Global Market Value Share and BPS Analysis by Product Type, 2025 and 2035
  • Figure 10: Global Market Y-o-Y Growth Comparison by Product Type, 2025-2035
  • Figure 11: Global Market Attractiveness Analysis by Product Type
  • Figure 12: Global Market Value Share and BPS Analysis by Channel, 2025 and 2035
  • Figure 13: Global Market Y-o-Y Growth Comparison by Channel, 2025-2035
  • Figure 14: Global Market Attractiveness Analysis by Channel
  • Figure 15: Global Market Value Share and BPS Analysis by Claim, 2025 and 2035
  • Figure 16: Global Market Y-o-Y Growth Comparison by Claim, 2025-2035
  • Figure 17: Global Market Attractiveness Analysis by Claim
  • Figure 18: Global Market Value (USD Million) Share and BPS Analysis by Region, 2025 and 2035
  • Figure 19: Global Market Y-o-Y Growth Comparison by Region, 2025-2035
  • Figure 20: Global Market Attractiveness Analysis by Region
  • Figure 21: North America Market Incremental $ Opportunity, 2025-2035
  • Figure 22: Latin America Market Incremental $ Opportunity, 2025-2035
  • Figure 23: Europe Market Incremental $ Opportunity, 2025-2035
  • Figure 24: East Asia Market Incremental $ Opportunity, 2025-2035
  • Figure 25: South Asia & Pacific Market Incremental $ Opportunity, 2025-2035
  • Figure 26: Middle East and Africa Market Incremental $ Opportunity, 2025-2035
  • Figure 27: North America Market Value Share and BPS Analysis by Country, 2025 and 2035
  • Figure 28: North America Market Value Share and BPS Analysis by Active Class, 2025 and 2035
  • Figure 29: North America Market Y-o-Y Growth Comparison by Active Class, 2025-2035
  • Figure 30: North America Market Attractiveness Analysis by Active Class
  • Figure 31: North America Market Value Share and BPS Analysis by Function, 2025 and 2035
  • Figure 32: North America Market Y-o-Y Growth Comparison by Function, 2025-2035
  • Figure 33: North America Market Attractiveness Analysis by Function
  • Figure 34: North America Market Value Share and BPS Analysis by Product Type, 2025 and 2035
  • Figure 35: North America Market Y-o-Y Growth Comparison by Product Type, 2025-2035
  • Figure 36: North America Market Attractiveness Analysis by Product Type
  • Figure 37: North America Market Value Share and BPS Analysis by Channel, 2025 and 2035
  • Figure 38: North America Market Y-o-Y Growth Comparison by Channel, 2025-2035
  • Figure 39: North America Market Attractiveness Analysis by Channel
  • Figure 40: North America Market Value Share and BPS Analysis by Claim, 2025 and 2035
  • Figure 41: North America Market Y-o-Y Growth Comparison by Claim, 2025-2035
  • Figure 42: North America Market Attractiveness Analysis by Claim
  • Figure 43: Latin America Market Value Share and BPS Analysis by Country, 2025 and 2035
  • Figure 44: Latin America Market Value Share and BPS Analysis by Active Class, 2025 and 2035
  • Figure 45: Latin America Market Y-o-Y Growth Comparison by Active Class, 2025-2035
  • Figure 46: Latin America Market Attractiveness Analysis by Active Class
  • Figure 47: Latin America Market Value Share and BPS Analysis by Function, 2025 and 2035
  • Figure 48: Latin America Market Y-o-Y Growth Comparison by Function, 2025-2035
  • Figure 49: Latin America Market Attractiveness Analysis by Function
  • Figure 50: Latin America Market Value Share and BPS Analysis by Product Type, 2025 and 2035
  • Figure 51: Latin America Market Y-o-Y Growth Comparison by Product Type, 2025-2035
  • Figure 52: Latin America Market Attractiveness Analysis by Product Type
  • Figure 53: Latin America Market Value Share and BPS Analysis by Channel, 2025 and 2035
  • Figure 54: Latin America Market Y-o-Y Growth Comparison by Channel, 2025-2035
  • Figure 55: Latin America Market Attractiveness Analysis by Channel
  • Figure 56: Latin America Market Value Share and BPS Analysis by Claim, 2025 and 2035
  • Figure 57: Latin America Market Y-o-Y Growth Comparison by Claim, 2025-2035
  • Figure 58: Latin America Market Attractiveness Analysis by Claim
  • Figure 59: Europe Market Value Share and BPS Analysis by Country, 2025 and 2035
  • Figure 60: Europe Market Value Share and BPS Analysis by Active Class, 2025 and 2035
  • Figure 61: Europe Market Y-o-Y Growth Comparison by Active Class, 2025-2035
  • Figure 62: Europe Market Attractiveness Analysis by Active Class
  • Figure 63: Europe Market Value Share and BPS Analysis by Function, 2025 and 2035
  • Figure 64: Europe Market Y-o-Y Growth Comparison by Function, 2025-2035
  • Figure 65: Europe Market Attractiveness Analysis by Function
  • Figure 66: Europe Market Value Share and BPS Analysis by Product Type, 2025 and 2035
  • Figure 67: Europe Market Y-o-Y Growth Comparison by Product Type, 2025-2035
  • Figure 68: Europe Market Attractiveness Analysis by Product Type
  • Figure 69: Europe Market Value Share and BPS Analysis by Channel, 2025 and 2035
  • Figure 70: Europe Market Y-o-Y Growth Comparison by Channel, 2025-2035
  • Figure 71: Europe Market Attractiveness Analysis by Channel
  • Figure 72: Europe Market Value Share and BPS Analysis by Claim, 2025 and 2035
  • Figure 73: Europe Market Y-o-Y Growth Comparison by Claim, 2025-2035
  • Figure 74: Europe Market Attractiveness Analysis by Claim
  • Figure 75: East Asia Market Value Share and BPS Analysis by Country, 2025 and 2035
  • Figure 76: East Asia Market Value Share and BPS Analysis by Active Class, 2025 and 2035
  • Figure 77: East Asia Market Y-o-Y Growth Comparison by Active Class, 2025-2035
  • Figure 78: East Asia Market Attractiveness Analysis by Active Class
  • Figure 79: East Asia Market Value Share and BPS Analysis by Function, 2025 and 2035
  • Figure 80: East Asia Market Y-o-Y Growth Comparison by Function, 2025-2035
  • Figure 81: East Asia Market Attractiveness Analysis by Function
  • Figure 82: East Asia Market Value Share and BPS Analysis by Product Type, 2025 and 2035
  • Figure 83: East Asia Market Y-o-Y Growth Comparison by Product Type, 2025-2035
  • Figure 84: East Asia Market Attractiveness Analysis by Product Type
  • Figure 85: East Asia Market Value Share and BPS Analysis by Channel, 2025 and 2035
  • Figure 86: East Asia Market Y-o-Y Growth Comparison by Channel, 2025-2035
  • Figure 87: East Asia Market Attractiveness Analysis by Channel
  • Figure 88: East Asia Market Value Share and BPS Analysis by Claim, 2025 and 2035
  • Figure 89: East Asia Market Y-o-Y Growth Comparison by Claim, 2025-2035
  • Figure 90: East Asia Market Attractiveness Analysis by Claim
  • Figure 91: South Asia & Pacific Market Value Share and BPS Analysis by Country, 2025 and 2035
  • Figure 92: South Asia & Pacific Market Value Share and BPS Analysis by Active Class, 2025 and 2035
  • Figure 93: South Asia & Pacific Market Y-o-Y Growth Comparison by Active Class, 2025-2035
  • Figure 94: South Asia & Pacific Market Attractiveness Analysis by Active Class
  • Figure 95: South Asia & Pacific Market Value Share and BPS Analysis by Function, 2025 and 2035
  • Figure 96: South Asia & Pacific Market Y-o-Y Growth Comparison by Function, 2025-2035
  • Figure 97: South Asia & Pacific Market Attractiveness Analysis by Function
  • Figure 98: South Asia & Pacific Market Value Share and BPS Analysis by Product Type, 2025 and 2035
  • Figure 99: South Asia & Pacific Market Y-o-Y Growth Comparison by Product Type, 2025-2035
  • Figure 100: South Asia & Pacific Market Attractiveness Analysis by Product Type
  • Figure 101: South Asia & Pacific Market Value Share and BPS Analysis by Channel, 2025 and 2035
  • Figure 102: South Asia & Pacific Market Y-o-Y Growth Comparison by Channel, 2025-2035
  • Figure 103: South Asia & Pacific Market Attractiveness Analysis by Channel
  • Figure 104: South Asia & Pacific Market Value Share and BPS Analysis by Claim, 2025 and 2035
  • Figure 105: South Asia & Pacific Market Y-o-Y Growth Comparison by Claim, 2025-2035
  • Figure 106: South Asia & Pacific Market Attractiveness Analysis by Claim
  • Figure 107: Middle East and Africa Market Value Share and BPS Analysis by Country, 2025 and 2035
  • Figure 108: Middle East and Africa Market Value Share and BPS Analysis by Active Class, 2025 and 2035
  • Figure 109: Middle East and Africa Market Y-o-Y Growth Comparison by Active Class, 2025-2035
  • Figure 110: Middle East and Africa Market Attractiveness Analysis by Active Class
  • Figure 111: Middle East and Africa Market Value Share and BPS Analysis by Function, 2025 and 2035
  • Figure 112: Middle East and Africa Market Y-o-Y Growth Comparison by Function, 2025-2035
  • Figure 113: Middle East and Africa Market Attractiveness Analysis by Function
  • Figure 114: Middle East and Africa Market Value Share and BPS Analysis by Product Type, 2025 and 2035
  • Figure 115: Middle East and Africa Market Y-o-Y Growth Comparison by Product Type, 2025-2035
  • Figure 116: Middle East and Africa Market Attractiveness Analysis by Product Type
  • Figure 117: Middle East and Africa Market Value Share and BPS Analysis by Channel, 2025 and 2035
  • Figure 118: Middle East and Africa Market Y-o-Y Growth Comparison by Channel, 2025-2035
  • Figure 119: Middle East and Africa Market Attractiveness Analysis by Channel
  • Figure 120: Middle East and Africa Market Value Share and BPS Analysis by Claim, 2025 and 2035
  • Figure 121: Middle East and Africa Market Y-o-Y Growth Comparison by Claim, 2025-2035
  • Figure 122: Middle East and Africa Market Attractiveness Analysis by Claim
  • Figure 123: Global Market - Tier Structure Analysis
  • Figure 124: Global Market - Company Share Analysis

Frequently Asked Questions

How big is the Cellular Renewal Actives Market in 2025?

The Cellular Renewal Actives Market is estimated to be valued at USD 3,301.6 million in 2025.

What will be the size of the Cellular Renewal Actives Market in 2035?

The market size for the Cellular Renewal Actives Market is projected to reach USD 10,502.3 million by 2035.

How much will be the Cellular Renewal Actives Market growth between 2025 and 2035?

The Cellular Renewal Actives Market is expected to grow at a 12.3% CAGR between 2025 and 2035.

What are the key product types in the Cellular Renewal Actives Market?

The key product types in the Cellular Renewal Actives Market are serums, peeling solutions, creams/lotions, and masks/pads.

Which function segment will contribute significant share in the Cellular Renewal Actives Market in 2025?

In terms of function, the cell turnover/renewal segment will command a 54.5% share in the Cellular Renewal Actives Market in 2025.

Explore Similar Insights

Future Market Insights

Cellular Renewal Actives Market

Chat With

MaRIA

Hi There, I am MaRIA, Your Market Research Intelligence Assistant. How may I help you?