The Bone Health Supplement Market is estimated to be valued at USD 21.2 billion in 2025 and is projected to reach USD 43.5 billion by 2035, registering a compound annual growth rate (CAGR) of 7.5% over the forecast period.
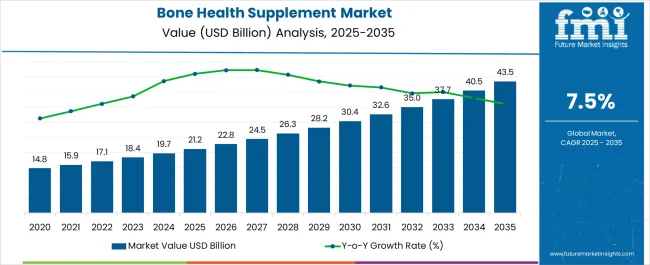
| Metric | Value |
|---|---|
| Bone Health Supplement Market Estimated Value in (2025 E) | USD 21.2 billion |
| Bone Health Supplement Market Forecast Value in (2035 F) | USD 43.5 billion |
| Forecast CAGR (2025 to 2035) | 7.5% |
The bone health supplement market is experiencing robust growth. Rising incidences of osteoporosis, increasing geriatric population, and greater awareness of preventive healthcare are driving demand. Current market conditions reflect a shift toward proactive wellness management and a focus on maintaining bone density through nutritional support.
Manufacturers are emphasizing scientifically validated formulations and clean-label positioning to strengthen consumer trust. Regulatory frameworks ensuring product safety and efficacy are further supporting adoption across global markets. The future outlook remains positive as expanding healthcare access in developing economies, combined with rising disposable incomes, fuels wider adoption of bone health supplements.
Technological improvements in ingredient delivery systems are enhancing bioavailability and consumer compliance Growth rationale is anchored on the rising acceptance of supplements as a preventive measure, expanding product portfolios targeting specific age groups, and strong retail penetration across offline and online channels Collectively, these dynamics are underpinning sustained revenue growth and long-term market resilience.
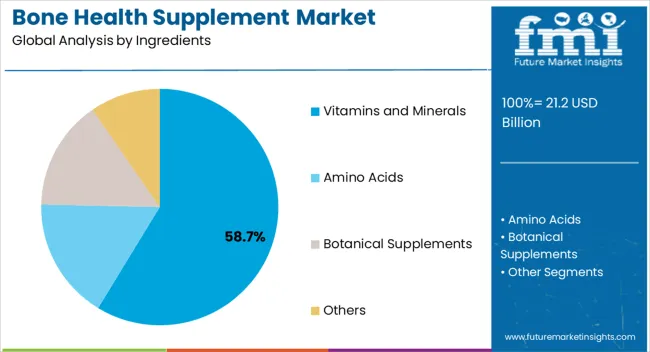
The vitamins and minerals segment, holding 58.70% of the ingredients category, dominates the market due to its critical role in bone strength and mineralization. Calcium and vitamin D formulations have been central to preventive healthcare, and consistent consumer reliance has ensured demand stability. The segment benefits from strong clinical validation, widespread physician recommendations, and favorable consumer perception of safety and efficacy.
Manufacturing capabilities have advanced to offer combination formulations that improve absorption and compliance. Price accessibility and regulatory approvals across multiple regions have further reinforced market penetration.
Rising awareness campaigns and government initiatives promoting nutritional sufficiency are expected to sustain segment leadership Expansion into functional blends combining vitamins, minerals, and supportive compounds is likely to strengthen the long-term competitive positioning of this segment.
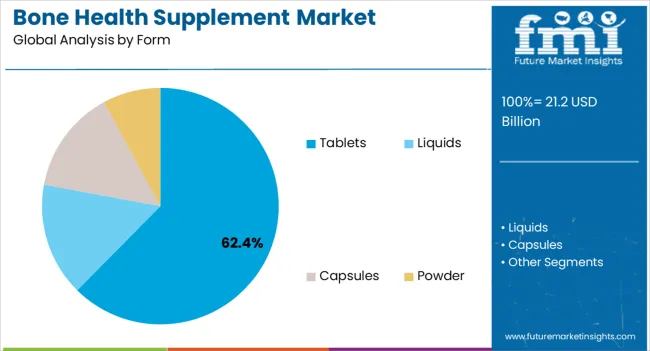
The tablets segment, accounting for 62.40% of the form category, has emerged as the most preferred delivery format due to convenience, stability, and cost efficiency. Its dominance is supported by ease of storage, standardized dosing, and broad consumer familiarity.
Tablets are widely distributed through both offline and online channels, benefiting from efficient packaging and long shelf life. Growth is being reinforced by innovation in tablet coatings and formulations designed to improve absorption and minimize gastrointestinal discomfort.
Consumer trust and physician preference for tablets over alternative forms such as powders or liquids have further supported sustained adoption Over the forecast period, continued demand from elderly populations and the introduction of customized multivitamin bone health tablets are expected to drive incremental growth, ensuring that this form maintains its leading market share.
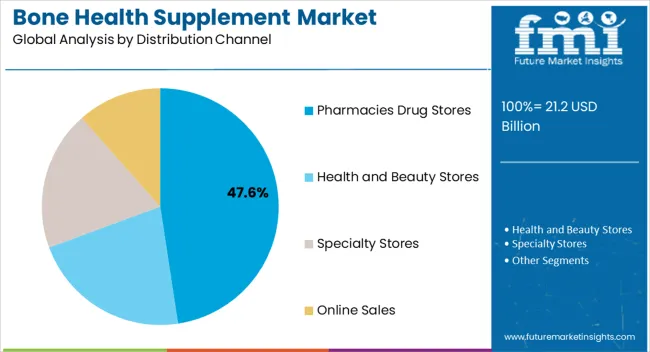
The pharmacies and drug stores segment, holding 47.60% of the distribution channel category, has secured leadership due to its accessibility, trust, and established presence in both urban and rural areas. These outlets play a pivotal role in enabling consumer education, as pharmacists often guide purchasing decisions and recommend appropriate supplements.
Reliable product availability, adherence to regulatory standards, and integration into established healthcare networks have further enhanced credibility. The segment benefits from consumer confidence in professional oversight, which has reinforced steady sales.
Increasing penetration of organized pharmacy chains in emerging economies is creating new growth opportunities Strategic in-store promotions and expansion of private-label offerings are expected to strengthen the position of pharmacies and drug stores, ensuring their continued dominance in the distribution of bone health supplements globally.
The global bone health supplement market expanded at a CAGR of 6.3% in the historical period between 2020 and 2025. The demand for bone health supplements has surged as people's understanding of the significance of bone health has grown. Customers are becoming more aware of the need for preventative healthcare, which includes keeping their bones strong and healthy.
One key reason fueling the market for supplements related to bone health is the aging population. Osteoporosis and other bone-related disorders are becoming common among older adults, which expands the market for supplements aimed at this population.
Customers are taking an active role in managing their health as a result of the move toward preventative healthcare. The growing popularity of bone health supplements can be attributed to their perception as a prophylactic against osteoporosis and other bone-related problems.
Supplement formulations have been innovative, with novel and more readily absorbed forms of calcium, vitamin D, magnesium, and other key elements for bone health introduced to the market. The purpose of these developments is to increase the supplements' efficacy.
Supplements for bone health are now easily accessible because of the expansion of e-commerce. These products are widely obtainable online, which expands their market penetration and increases consumer reach.
The market for supplements supporting bone health has been impacted by the trend toward tailored and individualized diets. Businesses are providing items that are customized according to customer preferences and health profiles. Owing to the aforementioned factors, the global bone health supplement market is expected to rise at a CAGR of 7.8% during the forecast period from 2025 to 2035.
| Attributes | Key Factors |
|---|---|
| Bone Health Supplement Market Trends |
|
| Growth Hindrances |
|
| Upcoming Opportunities |
|
In the table below, the CAGRs of the top countries are given for the review period 2025 to 2035. India is expected to remain dominant by exhibiting a CAGR of 8.0%. The United States and China are anticipated to follow with CAGRs of 7.2% and 6.5%, respectively.
| Countries | Value-based CAGR (2035) |
|---|---|
| United States | 7.2% |
| China | 6.5% |
| Germany | 5.5% |
| India | 8.0% |
| Japan | 6.1% |
The United States dominated North America’s bone health supplement market with a total share of about 89.4% in 2025. The country is expected to continue to experience the same growth rate throughout the forecast period.
One of the key factors propelling the market for bone health supplements in the United States is the aging population, with more people becoming seniors. The need for bone health products and those that help prevent diseases such as osteoporosis is growing as individuals get older.
The demand for bone health supplements is influenced by rising health consciousness and understanding of the value of preventative healthcare in the United States. Customers are actively looking for ways to preserve their health, especially the health of their bones.
Product innovation in the market is influenced by ongoing research and development into the composition of supplements for bone health, including novel components, enhanced absorption rates, and targeted solutions. Businesses will probably concentrate on creating goods with distinctive benefits.
India held around 25.5% share of South Asia’s market in 2025. The country is projected to display steady growth at a decent CAGR of 8.0% during the assessment period.
The supplement distribution industry has been greatly impacted by the rise of e-commerce platforms and online retail. India’s consumers are increasingly buying health and wellness products online, which gives businesses the chance to reach a larger market.
The market for bone health supplements in India can be impacted by the move toward an individualized diet. Businesses would look into creating goods that target particular lifestyle choices, health issues, or demographics.
Consumer trust in the country’s market for bone health supplements is significantly influenced by regulatory compliance and clear labeling policies. Businesses that follow quality guidelines and provide honest information about their goods could be at a competitive advantage.
Germany is set to exhibit a CAGR of 5.5% during the forecast period. The market for supplements supporting bone health can be impacted by laws as well as health and nutrition-related efforts from the government. Businesses operating in Germany are subject to regulatory standards. Market access and consumer trust can be impacted by a company's adherence to these standards.
Similar to other markets, customer behavior can be influenced by raising knowledge of the value of supplements and bone health through educational programs. Businesses can spend money on marketing plans that highlight the advantages of their goods.
Supplements are among the several things that Germany’s customers can easily obtain thanks to the expansion of e-commerce and online retail platforms. Businesses can use Internet platforms for distribution and marketing.
China is set to exhibit a CAGR of 6.5% during the forecast period. Market expansion can be impacted by clever marketing techniques that inform customers of the advantages of bone health supplements. Businesses can launch educational campaigns to increase public knowledge of the importance of supplements and bone health.
Customers in China are exhibiting a growing desire for sustainable and ecologically friendly products in line with worldwide trends. Businesses that use sustainable sourcing and clean label procedures can draw in eco-aware customers.
The legitimacy of bone health supplements can be increased by alliances and partnerships with medical specialists, such as physicians, nutritionists, and other healthcare practitioners. Healthcare experts' recommendations can affect the decisions made by consumers.
Supplements with additional advantages beyond bone health, such as immune system stimulation or joint support, can become more well-liked. Businesses could look at creating multipurpose supplements to cater to a range of customer demands.
Japan is set to exhibit a CAGR of 6.1% during the estimated period. Fish and soy products are two examples of foods high in minerals that are vital for bone health. These are a part of the traditional diet in Japan. To make up for any nutritional shortfalls, people are becoming more interested in supplements as dietary habits and lifestyles become more westernized.
In Japan, the prevention of osteoporosis is a key health issue, leading to the marketing and use of bone health supplements. Goods with calcium, vitamin D, and other minerals that support bone health can be in high demand.
Japan’s bone health supplement market is renowned for its appetite for cutting-edge, premium goods. To set themselves apart from competitors, businesses should concentrate on creating special formulations with cutting-edge components and innovative delivery methods.
The table below signifies leading sub-categories under ingredient type and form categories in the bone health supplement market. The vitamins and minerals segment is expected to dominate the market for bone health supplements by exhibiting a 7.5% CAGR in the evaluation period. Under the form category, the tablet segment is projected to lead the global market at an 8.4% CAGR.
| Category | Forecast CAGR (2025 to 2035) |
|---|---|
| Vitamins and Minerals (Ingredient Type) | 7.5% |
| Tablets (Forms) | 8.4% |
The vitamins and minerals segment under ingredient type is expected to present high growth at a CAGR of 7.5% through 2035. The segment is anticipated to generate a market share of about 61.2% in the global market in 2025.
Inadequate intake of bone-building nutrients increases the probability of bone density and later osteoporosis. Supplements for bone health are made with certain vitamins and minerals to help maintain and improve the health of the skeletal system. The development of new bones, mineralization, and general skeletal health depend heavily on these nutrients.
Consuming enough vitamins is essential for preserving bone mass and averting diseases such as osteoporosis. In order for the body to effectively use the calcium it gets, proper amounts of vitamin D are necessary supporting healthy bones and avoiding bone problems.
Tablets held a total bone health supplement market share of 51.3% in 2025 and are expected to display steady growth over the forecast period. The demand for tablets has been increasing among consumers. This is because of the ease of access to multiple dosage patterns, simple packing procedures, storage, and cost-effectiveness. People from all age groups and within all demographics have been boosting the segment’s growth worldwide.
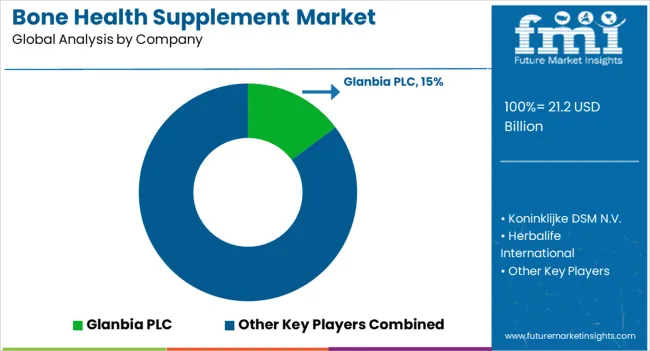
Key players are directed toward growth strategies, including mergers and acquisitions, partnerships and collaborations, and new product releases to fulfill consumer demand and increase their client base. Instances of key developmental strategies by industry players in the market are given below:
The global bone health supplement market is estimated to be valued at USD 21.2 billion in 2025.
The market size for the bone health supplement market is projected to reach USD 43.5 billion by 2035.
The bone health supplement market is expected to grow at a 7.5% CAGR between 2025 and 2035.
The key product types in bone health supplement market are vitamins and minerals, amino acids, botanical supplements and others.
In terms of form, tablets segment to command 62.4% share in the bone health supplement market in 2025.


Full Research Suite comprises of:
Market outlook & trends analysis
Interviews & case studies
Strategic recommendations
Vendor profiles & capabilities analysis
5-year forecasts
8 regions and 60+ country-level data splits
Market segment data splits
12 months of continuous data updates
DELIVERED AS:
PDF EXCEL ONLINE
Bone and Joint Health Supplement Market Analysis by Product Type, Form and Sale Channels Through 2035
Bone Morphogenetic Protein Market Size and Share Forecast Outlook 2025 to 2035
Bone Metabolism Test Market Size and Share Forecast Outlook 2025 to 2035
Bone Densitometer Devices Market Size and Share Forecast Outlook 2025 to 2035
Bone Densitometers Analysis by Product Type, by Technology and by End User through 2035
Bone Growth Stimulators Market is segmented by product type, application and end user from 2025 to 2035
Bone Graft Fixation System Market – Growth & Demand 2025 to 2035
Bone Regeneration Market Analysis - Size, Share & Forecast 2025 to 2035
Bone Fixation Plates Market Trends - Growth, Demand & Forecast 2025 to 2035
Bone Marrow Transplant Market is segmented by transplant type, disease indication, and end user from 2025 to 2035
Bone Grafts and Substitutes Market Overview - Size, Share & Forecast 2025 to 2035
Bone Cement Delivery System Market Trends – Growth & Forecast 2024-2034
Bone Screw System Market Growth – Demand, Trends & Industry Forecast 2024-2034
Bone Distractors Market
Bone Cement Mixers Market
Bone Conduction Hearing Devices Market
Bone and Teeth Supplements Market Size and Share Forecast Outlook 2025 to 2035
Fish Bone Minerals Market Analysis - Size, Share, and Forecast Outlook 2025 to 2035
Bioactive Bone Grafts Market Size and Share Forecast Outlook 2025 to 2035
Metastatic Bone Tumor Treatment Market

Thank you!
You will receive an email from our Business Development Manager. Please be sure to check your SPAM/JUNK folder too.
Chat With
MaRIA