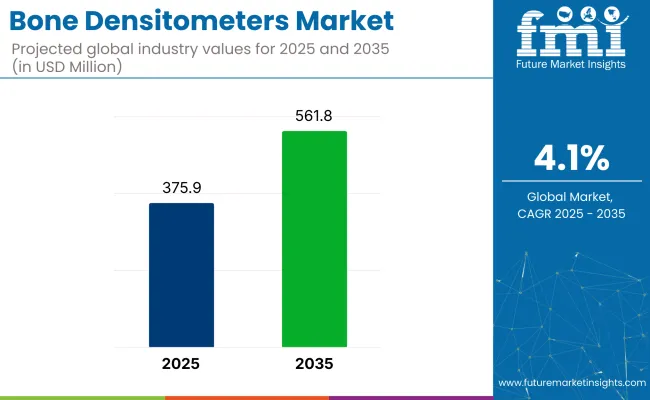
The global bone densitometers market is projected to be valued at USD 375.9 million in 2025 and is expected to reach USD 561.8 million by 2035, registering a CAGR of 4.1%. The Bone Densitometers market is driven by the expanding aging demographic and escalating osteoporosis prevalence, which is increasing demand for accurate and early diagnostic solutions.
DEXA-based systems remain the diagnostic gold standard, dominating market adoption owing to superior precision, while portable and point-of-care units are also gaining traction due to their convenience in primary care settings. Key growth enablers include increased healthcare spending on bone health diagnostics, and rising awareness campaigns targeting osteoporosis. Looking ahead, growth opportunities are concentrated in countries such as India, China and Brazil, where expanding infrastructure and patient pool present significant upside.
Leading manufacturers in the Bone Densitometers market include Hologic, Inc., GE Healthcare, FUJIFILM, FURUNO ELECTRIC CO.,LTD, DMS Group, OSTEOSYS Corp and Others. These companies are intensively investing in R&D, strategic alliances, and product enhancements. In 2024, FUJIFILM India, has announced the installation of its powerful Dual-Energy X-ray Absorptiometry (DEXA) machine “FDX Visionary-DR”.

| Metric | Value |
|---|---|
| Industry Size (2025E) | USD 375.9 million |
| Industry Value (2035F) | USD 561.8 million |
| CAGR (2025 to 2035) | 4.1% |
It features a breakthrough 3D-DXA technology that uses routine bone-mineral-density images to create 3D models of the femur, bringing in new information about bone structure for accurate diagnosis and adapted treatment procedures. In another development, OSTEOSYS CO., LTD is obtained CE marking for all DXA systems which is approved under approved under the European Union (EU) Medical Device Regulation 2017/745. “OsteoSys is very proud and pleased to have received MDR certification for DXA BMD systems” said Dr. Youngbok AHN, President of OsteoSys.
North America continues to lead the global Bone Densitometers market. The region's growth is propelled by robust Medicare reimbursement policies and growing prevalence of osteoporosis, especially in the U.S. Primary care providers and hospitals are increasingly incorporating portable densitometers to improve preventative screening extending outreach beyond traditional radiology departments.
In addition, proactive federal and state-level osteoporosis awareness campaigns have induced earlier adoption of screening technologies. These targeted efforts align with regional regulatory support and high patient compliance, making North America a dynamic proving ground for next‑gen bone density diagnostics.
Europe’s bone densitometer segment is expanding, particularly in Western Europe, where aging populations such as in Germany, Italy, and the U.K. create sustained demand for osteoporosis screening. Governments and public health systems' emphasis on preventive care, combined with central procurement by IDNs and hospital networks, are enabling wider access to DEXA and newer modalities.
Meanwhile, northern Europe’s increasing investment in radiation-free technologies like REMS reflects a strategic shift toward patient safety and more frequent monitoring. Recent reimbursement policy enhancements for outpatient bone scanning have encouraged clinics to adopt point-of-care densitometers, expanding access beyond hospitals.
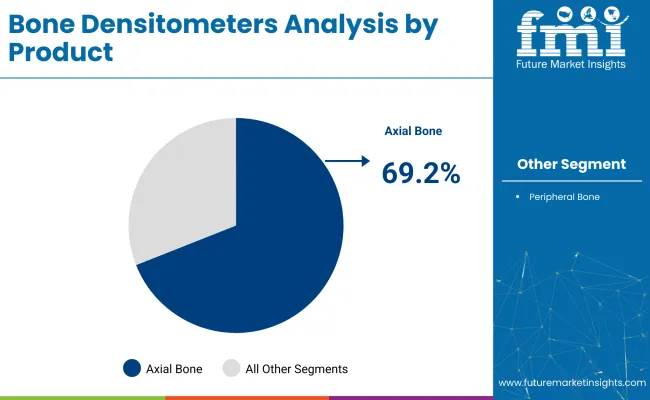
In 2025, the axial bone densitometers segment is projected to hold a commanding 69.2% revenue share, positioning it as the leading product category. This dominance has been attributed to its capability to provide high-resolution imaging of critical skeletal sites such as the hip and spine areas most vulnerable to osteoporotic fractures.

Their widespread adoption in hospitals and diagnostic imaging centers has been driven by clinical guidelines that recognize axial scans as the standard of care in osteoporosis detection. Technological advancements in DXA-based axial systems, such as AI integration and reduced scan times, have improved throughput and diagnostic precision. As a result, diagnostic workflows have been optimized, enhancing both patient outcomes and institutional efficiency.
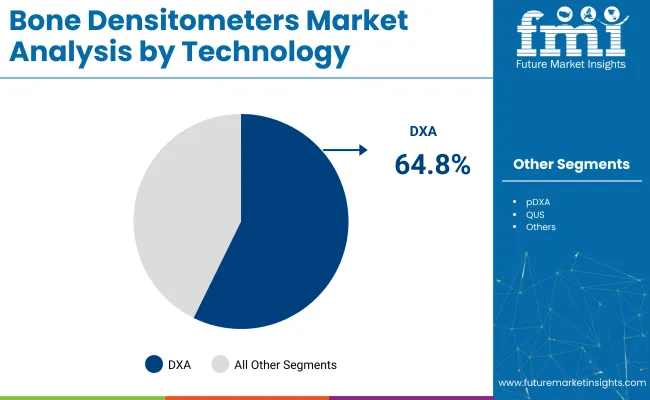
With a substantial 64.8% revenue share in 2025, DXA (Dual-Energy X-ray Absorptiometry) has emerged as the dominant technology segment in the Bone Densitometers Market. Its position as the clinical gold standard has been earned through decades of validation in assessing bone mineral density and fracture risk. This preference has been reinforced by endorsements from global health organizations and inclusion in national screening programs.

The precision and reproducibility offered by DXA imaging have been critical in long-term patient monitoring, especially in chronic osteoporosis management. Technological enhancements such as 3D-DXA and AI-assisted interpretation have improved diagnostic capabilities without extending scan durations or increasing radiation exposure.
Use in body composition analysis has expanded its utility beyond traditional bone health, increasing demand in sports medicine and geriatric care. Thus, DXA’s clinical reliability, technological adaptability, and multifunctional application have reinforced its leadership within the segment.
In 2025, hospitals are expected to account for 55.9% of total revenue in the Bone Densitometers Market, representing the largest end-user segment. This dominance has been shaped by the availability of comprehensive imaging infrastructure and institutional budgets that support high-cost, high-precision equipment. Hospitals have been more inclined to adopt axial DXA systems, given their ability to manage complex diagnostic workloads and deliver full-body scans with minimal patient movement.
Multidisciplinary collaboration within hospital environments has further enabled densitometry to be integrated into broader diagnostic protocols. The inclusion of densitometers in osteoporosis management, cancer therapy follow-ups, and bariatric assessments has diversified use cases, enhancing their clinical value. As patient preference trends lean toward one-stop care facilities, hospitals have been positioned as primary diagnostic hubs, driving the segment’s sustained growth.
Challenges
Lack of Standardization and Integration Limits Diagnostic Accuracy
One of the new challenges facing the bone densitometers market is non-standardization and interoperability among various diagnostic systems. Different imaging technologies such as DXA, QCT QUS are used in healthcare facilities with varying diagnostic protocols and calibration standards. Lacking cross-platform standards for universal comparison, clinicians are not able to routinely interpret results, potentially leading to inconsistencies in the diagnosis of osteoporosis and recommendations for treatment.
Besides this, the incorporation of bone densitometry results into EHRs and other computer aided diagnostic systems remains an onerous process. Older models densitometers are mostly not connected digitally in an integrated fashion, making it impossible to track long-term patient bone health trends.
As healthcare providers transition to evidence-based decision-making, manufacturers must develop standardized, interoperable, and easily integratable densitometry solutions. Without these developments, diagnostic precision and inconsistencies and limited data availability may hinder wide adoption and market expansion.
Opportunities
Expansion of Preventive Screening Programs
Governments and health organizations are increasingly placing emphasis on preventive osteoporosis screening, presenting a significant opportunity for the market for bone densitometers. Most countries are augmenting regular bone health tests in at-risk groups, including postmenopausal women and elderly people, in order to minimize the impacts of osteoporotic fractures. This trend is fueling the demand for densitometry systems in hospitals, diagnostic laboratories, and even primary care offices.
Also, corporate wellness programs and health check-ups initiated by insurance are incorporating bone density testing as a standard preventive care. Employers and insurers are becoming aware of the long-term cost savings from early detection of osteoporosis, further driving demand for portable and compact densitometers to be used outside of hospitals.
With the increasing prevalence of osteoporosis in developing countries, there is a chance for manufacturers to launch affordable and portable solutions that can address outpatient clinics and rural healthcare networks, opening up the market beyond conventional hospital-based installations.
The bone densitometer industry expanded gradually over the period between 2020 and 2024, owing to increasing prevalence of osteoporosis, rising geriatric population and also advances in imaging diagnostic technologies. The expanding fame of bone fitness awareness and pre-fracture detection served as a key drive towards greater uses of DEXA and Quantitative Ultrasound Systems scans.
Sustained costs of devices and restricted installations across small and middle income countries persisted as a bottleneck to industry development.
Moving into 2025-2035, the market will be impacted by other technological innovations like AI based diagnostic platforms, portable monitoring devices for bone health, and precision imaging technologies with sophisticated features. Regulatory standards will likely evolve to offer higher accuracy requirements. Growing telemedicine solutions and home-based monitoring platforms will also create value that will propel the market growth.
Comparison Table
| Market Shift | 2020 to 2024 Trends |
|---|---|
| Regulatory Landscape | Adherence to radiation safety and clinical accuracy standards |
| Technological Advancements | Implementation of DXA and QUS for non-invasive measurement of bone density |
| Consumer Demand | Growing awareness about osteoporosis prevention and early detection |
| Market Growth Drivers | Growing prevalence of osteoporosis, aging population, and enhanced diagnostic abilities |
| Sustainability | Limited emphasis on green manufacturing and energy-efficient imaging systems |
| Supply Chain Dynamics | Dependency on specialized components and high manufacturing costs. |
| Market Shift | 2025 to 2035 Projections |
|---|---|
| Regulatory Landscape | Tighter international regulations with a focus on precision, safety, and telehealth integration. |
| Technological Advancements | AI driven imaging, wearable diagnostic tools, and cloud-based data analytics. |
| Consumer Demand | Greater demand for customized bone health tracking and at-home screening |
| Market Growth Drivers | Increasing digital health solutions, AI driven diagnostics. |
| Sustainability | Increased focus on sustainable production, recyclable materials, and energy-efficient devices |
| Supply Chain Dynamics | Improved supply chain through localized production and cost-effective distribution models |
Market Outlook
The bone densitometer market in United States is experiencing a steady growth which is primarily driven by increase new cases of osteoporosis and osteoporotic fractures among the geriatric population. This significant rise in bone fracture cases due to reduced bone mineral density has raised an alarm over the potential risk of bone related trauma among old aged patients. Technological advancements in diagnostic equipment, such as DEXA, have improved efficiency and accuracy in measuring bone density.
The market is boosted by a very high adoption rate of advanced medical equipment and an extremely well-developed healthcare infrastructure. But cost of bone densitometers and reimbursement concerns may be market growth limiting factors.
Market Growth Factors
Market Forecast
| Country | CAGR (2025 to 2035) |
|---|---|
| United States | 3.5% |
Market Outlook
The market for bone densitometer in Germany is characterized by its dominance of a strong healthcare system and with the significant presence of medical devices leaders in the country. These companies have very strong innovative capability where research and development are being carried out to create an advanced version of radiation-free densitometers or portable devices make bone density assessments more accessible to patient and also provides accuracy in information.
With rising prevalence of osteoporosis, there is a significant demand for bone densitometry scans in healthcare setting. Clinicians also plays a pivotal role in prescribing bone density scans to diagnose osteoporosis, to calculate the bone mineral density and assess the risk of future fracture. The market is also supported by government programs that helps detect and prevent bone diseases at an early stage.
Market Growth Factors
Market Forecast
| Country | CAGR (2025 to 2035) |
|---|---|
| Germany | 3.1% |
Market Outlook
The Chinese market for bone densitometers is growing at a fast pace due to a growing awareness of bone health issues and an expanding re-occurrence of osteoporosis cases. Advancement in medical infrastructure allows for increased access to diagnostic scanning services. The market is also driven by significant government initiatives aimed at preventive healthcare as well as the early diseases detection.
Market Growth Factors
Market Forecast
| Country | CAGR (2025 to 2035) |
|---|---|
| China | 5.7% |
Market Outlook
The market for bone densitometers in Brazilian is growing and is driven by enhanced healthcare infrastructure towards facilitating medical imaging facilities and putting greater emphasis on preventive medicine. Osteoporosis and osteoporosis related fractures risk associated with old age are rising across Brazil to be able to require diagnostic procedures.
Increasing penetration in public and private healthcare facilities have increased the rate of bone densitometry screening across different healthcare settings. Regional and economic variations in access to healthcare could be market deterrents.
Market Growth Factors
The bone densitometer market is expanding due to the increasing prevalence of osteoporosis, improvement in imaging technologies, and increased awareness of bone health. Large medical device companies are investing in product development for increased accuracy, reduced radiation exposure, and patient comfort. The market is characterized by technology developments, collaborations, and regulatory approvals, which are driving competition among large competitors.
GE Healthcare (20-25%)
GE Healthcare is a dominant player in the bone densitometer market, offering a range of DXA scanners that integrate AI for improved diagnostic accuracy. The company continues to expand its product portfolio with a focus on user-friendly designs and precision imaging.
Hologic, Inc. (18-22%)
Hologic specializes in dual-energy X-ray absorptiometry (DXA) technology, delivering high-accuracy scanning solutions. Its commitment to research and innovation in women’s health further strengthens its market position.
Swissray International, Inc. (10-12%)
Swissray is recognized for developing cost-effective and portable bone densitometry systems, making osteoporosis screening more accessible across diverse healthcare settings.
DMS Imaging (6-8%)
DMS Imaging focuses on ergonomic and radiation-efficient DXA solutions, catering to hospitals and diagnostic centers looking for high-performance and user-friendly systems.
Other Key Players (33-46% Combined)
Several other companies contribute significantly to the bone densitometer market by offering specialized and cost-effective solutions. Notable players include:
As demand for bone densitometry continues to rise, companies are prioritizing innovation, regulatory compliance, and strategic partnerships to expand their market presence and improve diagnostic accuracy.
The market is segmented based on product, technology, end user, and region. By Product, the market is segmented into Axial Bone Densitometers and Peripheral Bone Densitometers.
the market is segmented into DXA, pDXA, QUS, and others.
the market is segmented into Hospitals, Diagnostic Imaging Centers, and Specialty Clinics.
Regionally, the bone densitometers market is analyzed across North America, Latin America, Western Europe, Eastern Europe, South Asia & Pacific, East Asia, and the Middle East & Africa.
The global bone densitometers industry is projected to witness CAGR of 4.1% between 2025 and 2035.
The global bone densitometers industry stood at USD 314.7 million in 2024.
The global bone densitometers industry is anticipated to reach USD 561.8 million by 2035 end.
China is expected to show a CAGR of 2.7% in the assessment period.
The key players operating in the global bone densitometers industry are GE Healthcare, Hologic, Inc., Swissray International, Inc., DMS Imaging, BeamMed Ltd, Osteosys Co. Ltd, Xingaoyi Medical Equipment Co. Ltd and others


Full Research Suite comprises of:
Market outlook & trends analysis
Interviews & case studies
Strategic recommendations
Vendor profiles & capabilities analysis
5-year forecasts
8 regions and 60+ country-level data splits
Market segment data splits
12 months of continuous data updates
DELIVERED AS:
PDF EXCEL ONLINE
Bone Morphogenetic Protein Market Size and Share Forecast Outlook 2025 to 2035
Bone Metabolism Test Market Size and Share Forecast Outlook 2025 to 2035
Bone Health Supplement Market Size and Share Forecast Outlook 2025 to 2035
Bone Densitometer Devices Market Size and Share Forecast Outlook 2025 to 2035
Bone and Teeth Supplements Market Size and Share Forecast Outlook 2025 to 2035
Bone Growth Stimulators Market is segmented by product type, application and end user from 2025 to 2035
Bone Graft Fixation System Market – Growth & Demand 2025 to 2035
Bone and Joint Health Supplement Market Analysis by Product Type, Form and Sale Channels Through 2035
Bone Regeneration Market Analysis - Size, Share & Forecast 2025 to 2035
Bone Fixation Plates Market Trends - Growth, Demand & Forecast 2025 to 2035
Bone Marrow Transplant Market is segmented by transplant type, disease indication, and end user from 2025 to 2035
Bone Grafts and Substitutes Market Overview - Size, Share & Forecast 2025 to 2035
Bone Cement Delivery System Market Trends – Growth & Forecast 2024-2034
Bone Screw System Market Growth – Demand, Trends & Industry Forecast 2024-2034
Bone Distractors Market
Bone Cement Mixers Market
Bone Conduction Hearing Devices Market
Fish Bone Minerals Market Analysis - Size, Share, and Forecast Outlook 2025 to 2035
Bioactive Bone Grafts Market Size and Share Forecast Outlook 2025 to 2035
Metastatic Bone Tumor Treatment Market

Thank you!
You will receive an email from our Business Development Manager. Please be sure to check your SPAM/JUNK folder too.
Chat With
MaRIA