Reports

- Global Locations -

Headquarters

Future Market Insights, Inc.

Christiana Corporate, 200
Continental Drive, Suite 401,
Newark, Delaware - 19713,
United States

T: +1-845-579-5705

Americas

Future Market Insights, Inc.

616 Corporate Way, Suite 2-9018,
Valley Cottage, NY 10989, United States

T: +1-347-918-3531

MEA

Future Market Insights

1602-6 Jumeirah Bay X2 Tower, Plot No: JLT-PH2-X2A,
Jumeirah Lakes Towers, Dubai,
United Arab Emirates

Europe

Future Market Insights

3rd Floor, 207 Regent Street,
W1B 3HH London
United Kingdom

T: + 44 (0) 20 8123 9659
D: +44 (0) 20 3287 4268

Asia Pacific

Future Market Insights

IndiaLand Global Tech Park, Unit UG-1, Behind Grand HighStreet, Phase 1, Hinjawadi, MH, Pune – 411057, India

Peptide Drug Conjugates Market Outlook (2023 to 2033)

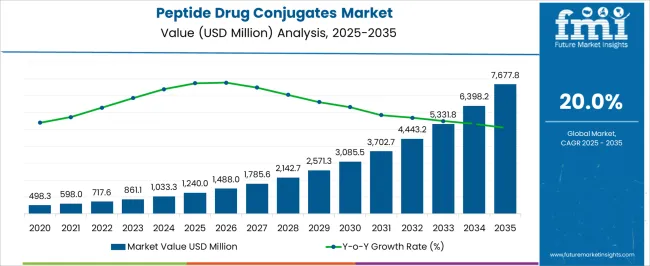
The global Peptide Drug Conjugates market is anticipated to hold a market value of US$ 861.12 Million in 2023 and US$ 5,331.83 Million by 2033. The projected growth rate is nearly 20% during the forecast period from 2023 to 2033.

The robust clinical trial pipeline with peptide drug conjugates (PDCs) coupled with an increase in Research and Development investments for developing PDCs and the rising disease burden across the globe are the factors expected to contribute to the market growth. For instance, in July 2021, Takeda Pharmaceutical Company Limited in collaboration with Peptide Dream announced investing USD 3.5 billion to develop peptide drugs for neuromuscular disease.

Report Attributes Details
Estimated Market Value in 2023 US$ 861.12 Million
Estimated Market Value in 2033 US$ 5,331.83 Million
Projected CAGR from 2023 to 2033 20%

Don't pay for what you don't need

Customize your report by selecting specific countries or regions and save 30%!

Revenue Analysis of Peptide Drug Conjugates Market 2018 to 2022 vs. Future Outlook 2023 to 2033

The global peptide drug conjugates market garnered US$ 717.6 Million in 2022, expanding at a historical CAGR of 16%. Pharmaceutical companies are developing PDCs for metabolic diseases and coronavirus diseases and cancer among others. Currently, the market has two FDA-approved drugs Pepaxto (Melflufen) and Lutathera (Lu 177 dotatate) for cancer treatment. Therefore, the rising prevalence of such diseases is driving the peptide drug conjugates market. According to the National Cancer Institute, in 2020, more than 1.8 million new cancer cases and more than 600,000 deaths occurred in the USA due to cancer.

Due to the increased number of cancer cases, the pharmaceutical industry has been pushed to investigate additional drug conjugates, resulting in the development and popularity of PDCs. The estimation reveals that the PDCs market is projected to secure a market value of US$ 5,331.83 Million by 2033.

What are the factors boosting the Global Peptide Drug Conjugates Market?

Growing Technological Advancements and Financial Investments to Aid Market Growth

The strong product pipeline and increasing financial investments in research and development are offering lucrative opportunities for the peptide drug conjugates market growth. For instance, AngioChem, Inc.’s product candidate- ANG1005 indicated for brain tumors is undergoing phase 3 clinical studies, and Bicycle Therapeutics pipeline products- BT5528&BT1718 indicated for non-small cell carcinoma, are under phase 2 clinical trials. Hence, the expected new PDC approval for the treatment of multiple types of cancer will boost the market growth in the near future.

According to the national cancer institute, there are more than 250 FDA-approved chemotherapeutic drugs used in the treatment of malignant tumors. However, the major drawback associated with such small molecules is uncontrolled toxicity resulting in severe side effects. Moreover, increasing drug resistance of tumor cells to such agents has led to demand for a better treatment approach like targeted PDCs and thereby, driving the peptide drug conjugates space.

Sabyasachi Ghosh
Sabyasachi Ghosh

Principal Consultant

Talk to Analyst

Find your sweet spots for generating winning opportunities in this market.

What are the Possible Challenges of the Market?

Increasing Costs to Hinder Market Growth

Low bioactivity, poor stability, long research and development time, and slow clinical development process as therapeutic agents of PDC are expected to restrain the segment, leading to an increase in overall time and cost incurred for the development.
Country-Wise Analysis

What is the Contribution of North America to Increasing Demand?

Presence of Key Players in the Region to Increase Consumer Demand

North America dominated the overall peptide drug conjugates (PDCs) market in terms of the revenue share of 45.6% in 2022, owing to the launch of Melflufen and the rapid uptake of PDC drugs in cancer therapy.

Increasing awareness about current treatment options, favorable reimbursement policies, and improved patient affordability are the factors expected to drive market growth. Furthermore, rising cases of cancer and related mortality are fueling the market growth in the region. For instance, NCI reported approximately 1,806,590 new cancer cases and 606,520 disease-related deaths in 2020.

What is the Growth Outlook for Peptide Drug Conjugates in the Asia Pacific?

Increasing Investments to Develop PDCs to Boost Regional Market

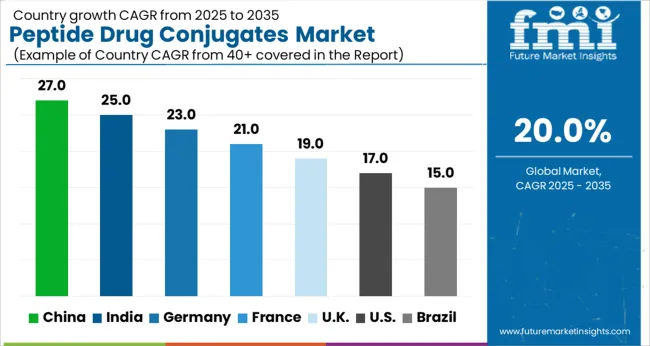
Asia Pacific is expected to witness a growth rate of 27.4% during the forecast period. The growth of the region is attributed to the upsurge in the number of cancer cases and strategic initiatives undertaken by the market players for regional expansion in such regions. Furthermore, rising research and development along with increasing investments to develop and commercialize such novel delivery systems is anticipated to boost the market growth in the region.

Get the data you need at a Fraction of the cost

Personalize your report by choosing insights you need
and save 40%!

Category-Wise Insights

Which Type of Product is Boosting the Growth of the Market?

Lutathera Product Segment to Dominate the Category

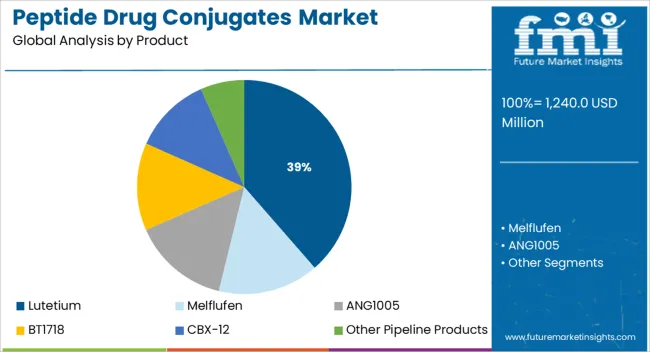
The Lutathera product segment dominated the peptide drug conjugates market with a revenue share of 80.5% in 2022. The first FDA-approved PDC is Novartis’s Lutathera (lutetium Lu 177), a radiolabeled somatostatin analog which is an advanced accelerator injection. The expected patent expiry date is 25th July 2038. It is indicated for the treatment of somatostatin receptor-positive gastroenteropancreatic neuroendocrine tumors including foregut, midgut, and hindgut neuroendocrine tumors in adults. Lutathera consists of an amide linkage between homing peptide somatostatin and cytotoxic radiotherapeutic agent 177Lu.

Oncopeptides AB received FDA approval for its first-in-class peptide-conjugated alkylator, Pepaxto (melflufen), in February 2021. The combination of Pepaxto (Melphalan flufenamide) with dexamethasone is indicated for multiple myeloma in adult patients. The drug has demonstrated anti-myeloma activity in myeloma tumor cells resistant to bortezomib and the alkylator melphalan. Melflufen patents cover major markets in the USA, Japan, Canada, and Europe. However, the drug has been withdrawn from the USA market in October 2021, based on overall survival data from its phase 3 study.

By Type, Which Segment is Propelling the Market Growth?

Therapeutic Segment Leads the Type Segment and is Projected to Dominate the Market

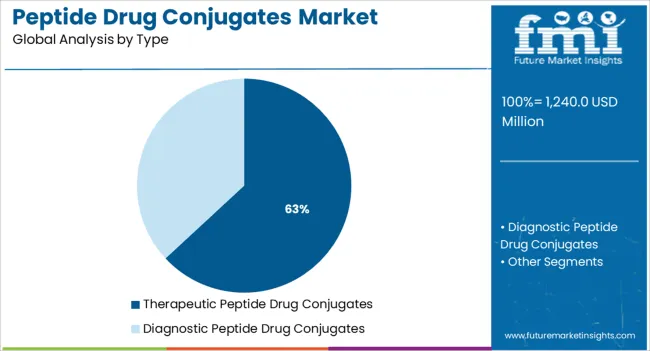
Therapeutic agents of PDC dominated the peptide drug conjugates market with a revenue share of 82.3% in 2022 and are anticipated to witness the fastest growth. The factors attributing to dominance is the presence of both approved PDCs, Lutathera and Pepaxtoas therapeutic agents targeting tumor cells. Moreover, the presence of targeting therapeutic drugs such as ANG1005,

BT5528 and BT1718 under clinical trials are expected to boost the market during the forecast period. Along with cancer, pharmaceutical companies are developing targeting therapeutic PDCs for metabolic diseases and coronavirus diseases due to the significant benefits of PDCs in the therapeutic segment.

PDCs coupled with radionuclides can also act as diagnostic agents. For example, Mallinckrodt Pharmaceuticals’ In-DTPA-octreotide (octreoscan) which contains radioactive nucleotides, is primarily used in the localization of neuroendocrine tumors. Furthermore, the development and applications of PDCs in diagnosis are anticipated to offer remunerative opportunities for segment growth.
Competitive Landscape

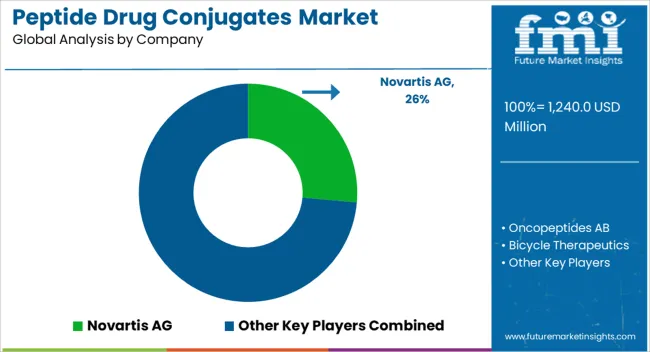
The players in the market are focusing to increase their global influence and adopt strategies such as; acquisition, collaboration, and partnerships. Key players in the market include Novartis AG; Bicycle Therapeutics; AstraZeneca; Cybrexa Therapeutics; Oncopeptides AB; Angiochem Inc.; Innovasium Soricimed Biopharma; and Theratechnologies. Some of the recent key developments among key players are:

  • In November 2022, Cybrexa Therapeutics and Exelixis, Inc. announced the collaboration agreement providing Exelixis the right to acquire, first-in-class peptide-drug conjugate (PDC), CBX-12. This initiative is expected to expand its clinical pipeline for targeted drug therapy.
  • In December 2021, Coherent Biopharma and WuXi STA announced the strategic partnership agreement to develop their current and future therapeutic drugs including peptide drug conjugates.

Peptide Drug Conjugates Market- Report Scope

Report Attributes Details
Market Value in 2023 US$ 861.12 Million
Market Value in 2033 US$ 5,331.83 Million
Forecast Period 2023 to 2033
Historical Data 2018 to 2022
Quantitative Units US$ Million for Value and CAGR from 2023 to 2033
Key Regions Covered
  • North America
  • Latin America
  • Europe
  • Asia Pacific
  • Middle East & Africa
Key Countries Covered
  • USA
  • Canada
  • Brazil
  • Mexico
  • Germany
  • United Kingdom
  • France
  • Spain
  • Italy
  • Singapore
  • Thailand
  • China
  • Japan
  • South Korea
  • Australia
  • New Zealand
  • GCC Countries
  • South Africa
  • Israel
Key Segments Covered
  • Type
  • Product
  • Region
Key Companies Profiled
  • Novartis AG
  • Oncopeptides AB
  • Bicycle Therapeutics
  • AstraZeneca
  • Cybrexa Therapeutics
  • Angiochem Inc.
  • Innovasium Soricimed Biopharma
  • Theratechnologies
  • Coherent Biopharma
  • WuXI STA
Pricing Available upon Request

Key Market Segments Covered in the Global Peptide Drug Conjugates Market

By Product:

  • Lutetium
  • Melflufen
  • ANG1005
  • BT1718
  • CBX-12
  • Other Pipeline Products

By Type:

  • Therapeutic Peptide Drug Conjugates
  • Diagnostic Peptide Drug Conjugates

By Region:

  • North America Peptide Drug Conjugates Market
  • Latin America Peptide Drug Conjugates Market
  • Europe Peptide Drug Conjugates Market
  • Asia Pacific Peptide Drug Conjugates Market
  • Middle East & Africa Peptide Drug Conjugates Market

Frequently Asked Questions

How opportunistic will the peptide drug conjugates market be in North America?

North America will account for a major share of global Peptide Drug Conjugates demand.

What is the predicted value CAR for the market from 2023 to 2033?

From 2023 to 2033, the market is projected to expand at a 20% value CAGR, as per FMI.

What is the projected market value for Peptide Drug Conjugates in 2033?

By 2033, Peptide Drug Conjugates market demand is expected to reach US$ 5,331.83 Million.

What is the anticipated market value for Peptide Drug Conjugates in 2023?

By 2023, demand for Peptide Drug Conjugates is forecast to be valued at US$ 861.12 Million

What was the market worth for Peptide Drug Conjugates in 2022?

As of 2022, the market for Peptide Drug Conjugates was valued at US$ 717.6 Million

Table of Content

1. Executive Summary | Peptide Drug Conjugates Market

    1.1. Global Market Outlook

    1.2. Demand-side Trends

    1.3. Supply-side Trends

    1.4. Technology Roadmap Analysis

    1.5. Analysis and Recommendations

2. Market Overview

    2.1. Market Coverage / Taxonomy

    2.2. Market Definition / Scope / Limitations

3. Market Background

    3.1. Market Dynamics

        3.1.1. Drivers

        3.1.2. Restraints

        3.1.3. Opportunity

        3.1.4. Trends

    3.2. Scenario Forecast

        3.2.1. Demand in Optimistic Scenario

        3.2.2. Demand in Likely Scenario

        3.2.3. Demand in Conservative Scenario

    3.3. Opportunity Map Analysis

    3.4. Investment Feasibility Matrix

    3.5. PESTLE and Porter’s Analysis

    3.6. Regulatory Landscape

        3.6.1. By Key Regions

        3.6.2. By Key Countries

    3.7. Regional Parent Market Outlook

4. Global Market Analysis 2018 to 2022 and Forecast, 2023 to 2033

    4.1. Historical Market Size Value (US$ Million) Analysis, 2018 to 2022

    4.2. Current and Future Market Size Value (US$ Million) Projections, 2023 to 2033

        4.2.1. Y-o-Y Growth Trend Analysis

        4.2.2. Absolute $ Opportunity Analysis

5. Global Market Analysis 2018 to 2022 and Forecast 2023 to 2033, By Product

    5.1. Introduction / Key Findings

    5.2. Historical Market Size Value (US$ Million) Analysis By Product, 2018 to 2022

    5.3. Current and Future Market Size Value (US$ Million) Analysis and Forecast By Product, 2023 to 2033

        5.3.1. Lutetium

        5.3.2. Melflufen

        5.3.3. ANG1005

        5.3.4. BT1718

        5.3.5. CBX-12

        5.3.6. Other Pipeline Products

    5.4. Y-o-Y Growth Trend Analysis By Product, 2018 to 2022

    5.5. Absolute $ Opportunity Analysis By Product, 2023 to 2033

6. Global Market Analysis 2018 to 2022 and Forecast 2023 to 2033, By Type

    6.1. Introduction / Key Findings

    6.2. Historical Market Size Value (US$ Million) Analysis By Type, 2018 to 2022

    6.3. Current and Future Market Size Value (US$ Million) Analysis and Forecast By Type, 2023 to 2033

        6.3.1. Therapeutic

        6.3.2. Diagnostic

    6.4. Y-o-Y Growth Trend Analysis By Type, 2018 to 2022

    6.5. Absolute $ Opportunity Analysis By Type, 2023 to 2033

7. Global Market Analysis 2018 to 2022 and Forecast 2023 to 2033, By Region

    7.1. Introduction

    7.2. Historical Market Size Value (US$ Million) Analysis By Region, 2018 to 2022

    7.3. Current Market Size Value (US$ Million) Analysis and Forecast By Region, 2023 to 2033

        7.3.1. North America

        7.3.2. Latin America

        7.3.3. Europe

        7.3.4. Asia Pacific

        7.3.5. Middle East and Africa(MEA)

    7.4. Market Attractiveness Analysis By Region

8. North America Market Analysis 2018 to 2022 and Forecast 2023 to 2033, By Country

    8.1. Historical Market Size Value (US$ Million) Trend Analysis By Market Taxonomy, 2018 to 2022

    8.2. Market Size Value (US$ Million) Forecast By Market Taxonomy, 2023 to 2033

        8.2.1. By Country

            8.2.1.1. USA

            8.2.1.2. Canada

        8.2.2. By Product

        8.2.3. By Type

    8.3. Market Attractiveness Analysis

        8.3.1. By Country

        8.3.2. By Product

        8.3.3. By Type

    8.4. Key Takeaways

9. Latin America Market Analysis 2018 to 2022 and Forecast 2023 to 2033, By Country

    9.1. Historical Market Size Value (US$ Million) Trend Analysis By Market Taxonomy, 2018 to 2022

    9.2. Market Size Value (US$ Million) Forecast By Market Taxonomy, 2023 to 2033

        9.2.1. By Country

            9.2.1.1. Brazil

            9.2.1.2. Mexico

            9.2.1.3. Rest of Latin America

        9.2.2. By Product

        9.2.3. By Type

    9.3. Market Attractiveness Analysis

        9.3.1. By Country

        9.3.2. By Product

        9.3.3. By Type

    9.4. Key Takeaways

10. Europe Market Analysis 2018 to 2022 and Forecast 2023 to 2033, By Country

    10.1. Historical Market Size Value (US$ Million) Trend Analysis By Market Taxonomy, 2018 to 2022

    10.2. Market Size Value (US$ Million) Forecast By Market Taxonomy, 2023 to 2033

        10.2.1. By Country

            10.2.1.1. Germany

            10.2.1.2. United Kingdom

            10.2.1.3. France

            10.2.1.4. Spain

            10.2.1.5. Italy

            10.2.1.6. Rest of Europe

        10.2.2. By Product

        10.2.3. By Type

    10.3. Market Attractiveness Analysis

        10.3.1. By Country

        10.3.2. By Product

        10.3.3. By Type

    10.4. Key Takeaways

11. Asia Pacific Market Analysis 2018 to 2022 and Forecast 2023 to 2033, By Country

    11.1. Historical Market Size Value (US$ Million) Trend Analysis By Market Taxonomy, 2018 to 2022

    11.2. Market Size Value (US$ Million) Forecast By Market Taxonomy, 2023 to 2033

        11.2.1. By Country

            11.2.1.1. China

            11.2.1.2. Japan

            11.2.1.3. South Korea

            11.2.1.4. Singapore

            11.2.1.5. Thailand

            11.2.1.6. Indonesia

            11.2.1.7. Australia

            11.2.1.8. New Zealand

            11.2.1.9. Rest of Asia Pacific

        11.2.2. By Product

        11.2.3. By Type

    11.3. Market Attractiveness Analysis

        11.3.1. By Country

        11.3.2. By Product

        11.3.3. By Type

    11.4. Key Takeaways

12. MEA Market Analysis 2018 to 2022 and Forecast 2023 to 2033, By Country

    12.1. Historical Market Size Value (US$ Million) Trend Analysis By Market Taxonomy, 2018 to 2022

    12.2. Market Size Value (US$ Million) Forecast By Market Taxonomy, 2023 to 2033

        12.2.1. By Country

            12.2.1.1. GCC Countries

            12.2.1.2. South Africa

            12.2.1.3. Israel

            12.2.1.4. Rest of Middle East and Africa(MEA)

        12.2.2. By Product

        12.2.3. By Type

    12.3. Market Attractiveness Analysis

        12.3.1. By Country

        12.3.2. By Product

        12.3.3. By Type

    12.4. Key Takeaways

13. Key Countries Market Analysis

    13.1. USA

        13.1.1. Pricing Analysis

        13.1.2. Market Share Analysis, 2022

            13.1.2.1. By Product

            13.1.2.2. By Type

    13.2. Canada

        13.2.1. Pricing Analysis

        13.2.2. Market Share Analysis, 2022

            13.2.2.1. By Product

            13.2.2.2. By Type

    13.3. Brazil

        13.3.1. Pricing Analysis

        13.3.2. Market Share Analysis, 2022

            13.3.2.1. By Product

            13.3.2.2. By Type

    13.4. Mexico

        13.4.1. Pricing Analysis

        13.4.2. Market Share Analysis, 2022

            13.4.2.1. By Product

            13.4.2.2. By Type

    13.5. Germany

        13.5.1. Pricing Analysis

        13.5.2. Market Share Analysis, 2022

            13.5.2.1. By Product

            13.5.2.2. By Type

    13.6. United Kingdom

        13.6.1. Pricing Analysis

        13.6.2. Market Share Analysis, 2022

            13.6.2.1. By Product

            13.6.2.2. By Type

    13.7. France

        13.7.1. Pricing Analysis

        13.7.2. Market Share Analysis, 2022

            13.7.2.1. By Product

            13.7.2.2. By Type

    13.8. Spain

        13.8.1. Pricing Analysis

        13.8.2. Market Share Analysis, 2022

            13.8.2.1. By Product

            13.8.2.2. By Type

    13.9. Italy

        13.9.1. Pricing Analysis

        13.9.2. Market Share Analysis, 2022

            13.9.2.1. By Product

            13.9.2.2. By Type

    13.10. China

        13.10.1. Pricing Analysis

        13.10.2. Market Share Analysis, 2022

            13.10.2.1. By Product

            13.10.2.2. By Type

    13.11. Japan

        13.11.1. Pricing Analysis

        13.11.2. Market Share Analysis, 2022

            13.11.2.1. By Product

            13.11.2.2. By Type

    13.12. South Korea

        13.12.1. Pricing Analysis

        13.12.2. Market Share Analysis, 2022

            13.12.2.1. By Product

            13.12.2.2. By Type

    13.13. Singapore

        13.13.1. Pricing Analysis

        13.13.2. Market Share Analysis, 2022

            13.13.2.1. By Product

            13.13.2.2. By Type

    13.14. Thailand

        13.14.1. Pricing Analysis

        13.14.2. Market Share Analysis, 2022

            13.14.2.1. By Product

            13.14.2.2. By Type

    13.15. Indonesia

        13.15.1. Pricing Analysis

        13.15.2. Market Share Analysis, 2022

            13.15.2.1. By Product

            13.15.2.2. By Type

    13.16. Australia

        13.16.1. Pricing Analysis

        13.16.2. Market Share Analysis, 2022

            13.16.2.1. By Product

            13.16.2.2. By Type

    13.17. New Zealand

        13.17.1. Pricing Analysis

        13.17.2. Market Share Analysis, 2022

            13.17.2.1. By Product

            13.17.2.2. By Type

    13.18. GCC Countries

        13.18.1. Pricing Analysis

        13.18.2. Market Share Analysis, 2022

            13.18.2.1. By Product

            13.18.2.2. By Type

    13.19. South Africa

        13.19.1. Pricing Analysis

        13.19.2. Market Share Analysis, 2022

            13.19.2.1. By Product

            13.19.2.2. By Type

    13.20. Israel

        13.20.1. Pricing Analysis

        13.20.2. Market Share Analysis, 2022

            13.20.2.1. By Product

            13.20.2.2. By Type

14. Market Structure Analysis

    14.1. Competition Dashboard

    14.2. Competition Benchmarking

    14.3. Market Share Analysis of Top Players

        14.3.1. By Regional

        14.3.2. By Product

        14.3.3. By Type

15. Competition Analysis

    15.1. Competition Deep Dive

        15.1.1. Novartis AG

            15.1.1.1. Overview

            15.1.1.2. Product Portfolio

            15.1.1.3. Profitability by Market Segments

            15.1.1.4. Sales Footprint

            15.1.1.5. Strategy Overview

                15.1.1.5.1. Marketing Strategy

        15.1.2. Oncopeptides AB

            15.1.2.1. Overview

            15.1.2.2. Product Portfolio

            15.1.2.3. Profitability by Market Segments

            15.1.2.4. Sales Footprint

            15.1.2.5. Strategy Overview

                15.1.2.5.1. Marketing Strategy

        15.1.3. Bicycle Therapeutics

            15.1.3.1. Overview

            15.1.3.2. Product Portfolio

            15.1.3.3. Profitability by Market Segments

            15.1.3.4. Sales Footprint

            15.1.3.5. Strategy Overview

                15.1.3.5.1. Marketing Strategy

        15.1.4. AstraZeneca

            15.1.4.1. Overview

            15.1.4.2. Product Portfolio

            15.1.4.3. Profitability by Market Segments

            15.1.4.4. Sales Footprint

            15.1.4.5. Strategy Overview

                15.1.4.5.1. Marketing Strategy

        15.1.5. Cybrexa Therapeutics

            15.1.5.1. Overview

            15.1.5.2. Product Portfolio

            15.1.5.3. Profitability by Market Segments

            15.1.5.4. Sales Footprint

            15.1.5.5. Strategy Overview

                15.1.5.5.1. Marketing Strategy

        15.1.6. Angiochem Inc.

            15.1.6.1. Overview

            15.1.6.2. Product Portfolio

            15.1.6.3. Profitability by Market Segments

            15.1.6.4. Sales Footprint

            15.1.6.5. Strategy Overview

                15.1.6.5.1. Marketing Strategy

        15.1.7. Innovasium Soricimed Biopharma

            15.1.7.1. Overview

            15.1.7.2. Product Portfolio

            15.1.7.3. Profitability by Market Segments

            15.1.7.4. Sales Footprint

            15.1.7.5. Strategy Overview

                15.1.7.5.1. Marketing Strategy

        15.1.8. Theratechnologies

            15.1.8.1. Overview

            15.1.8.2. Product Portfolio

            15.1.8.3. Profitability by Market Segments

            15.1.8.4. Sales Footprint

            15.1.8.5. Strategy Overview

                15.1.8.5.1. Marketing Strategy

        15.1.9. Coherent Biopharma

            15.1.9.1. Overview

            15.1.9.2. Product Portfolio

            15.1.9.3. Profitability by Market Segments

            15.1.9.4. Sales Footprint

            15.1.9.5. Strategy Overview

                15.1.9.5.1. Marketing Strategy

        15.1.10. WuXi STA

            15.1.10.1. Overview

            15.1.10.2. Product Portfolio

            15.1.10.3. Profitability by Market Segments

            15.1.10.4. Sales Footprint

            15.1.10.5. Strategy Overview

                15.1.10.5.1. Marketing Strategy

16. Assumptions & Acronyms Used

17. Research Methodology

List of Tables

Table 1: Global Market Value (US$ Million) Forecast by Region, 2018 to 2033

Table 2: Global Market Value (US$ Million) Forecast by Product, 2018 to 2033

Table 3: Global Market Value (US$ Million) Forecast by Type, 2018 to 2033

Table 4: North America Market Value (US$ Million) Forecast by Country, 2018 to 2033

Table 5: North America Market Value (US$ Million) Forecast by Product, 2018 to 2033

Table 6: North America Market Value (US$ Million) Forecast by Type, 2018 to 2033

Table 7: Latin America Market Value (US$ Million) Forecast by Country, 2018 to 2033

Table 8: Latin America Market Value (US$ Million) Forecast by Product, 2018 to 2033

Table 9: Latin America Market Value (US$ Million) Forecast by Type, 2018 to 2033

Table 10: Europe Market Value (US$ Million) Forecast by Country, 2018 to 2033

Table 11: Europe Market Value (US$ Million) Forecast by Product, 2018 to 2033

Table 12: Europe Market Value (US$ Million) Forecast by Type, 2018 to 2033

Table 13: Asia Pacific Market Value (US$ Million) Forecast by Country, 2018 to 2033

Table 14: Asia Pacific Market Value (US$ Million) Forecast by Product, 2018 to 2033

Table 15: Asia Pacific Market Value (US$ Million) Forecast by Type, 2018 to 2033

Table 16: MEA Market Value (US$ Million) Forecast by Country, 2018 to 2033

Table 17: MEA Market Value (US$ Million) Forecast by Product, 2018 to 2033

Table 18: MEA Market Value (US$ Million) Forecast by Type, 2018 to 2033

List of Charts

Figure 1: Global Market Value (US$ Million) by Product, 2023 to 2033

Figure 2: Global Market Value (US$ Million) by Type, 2023 to 2033

Figure 3: Global Market Value (US$ Million) by Region, 2023 to 2033

Figure 4: Global Market Value (US$ Million) Analysis by Region, 2018 to 2033

Figure 5: Global Market Value Share (%) and BPS Analysis by Region, 2023 to 2033

Figure 6: Global Market Y-o-Y Growth (%) Projections by Region, 2023 to 2033

Figure 7: Global Market Value (US$ Million) Analysis by Product, 2018 to 2033

Figure 8: Global Market Value Share (%) and BPS Analysis by Product, 2023 to 2033

Figure 9: Global Market Y-o-Y Growth (%) Projections by Product, 2023 to 2033

Figure 10: Global Market Value (US$ Million) Analysis by Type, 2018 to 2033

Figure 11: Global Market Value Share (%) and BPS Analysis by Type, 2023 to 2033

Figure 12: Global Market Y-o-Y Growth (%) Projections by Type, 2023 to 2033

Figure 13: Global Market Attractiveness by Product, 2023 to 2033

Figure 14: Global Market Attractiveness by Type, 2023 to 2033

Figure 15: Global Market Attractiveness by Region, 2023 to 2033

Figure 16: North America Market Value (US$ Million) by Product, 2023 to 2033

Figure 17: North America Market Value (US$ Million) by Type, 2023 to 2033

Figure 18: North America Market Value (US$ Million) by Country, 2023 to 2033

Figure 19: North America Market Value (US$ Million) Analysis by Country, 2018 to 2033

Figure 20: North America Market Value Share (%) and BPS Analysis by Country, 2023 to 2033

Figure 21: North America Market Y-o-Y Growth (%) Projections by Country, 2023 to 2033

Figure 22: North America Market Value (US$ Million) Analysis by Product, 2018 to 2033

Figure 23: North America Market Value Share (%) and BPS Analysis by Product, 2023 to 2033

Figure 24: North America Market Y-o-Y Growth (%) Projections by Product, 2023 to 2033

Figure 25: North America Market Value (US$ Million) Analysis by Type, 2018 to 2033

Figure 26: North America Market Value Share (%) and BPS Analysis by Type, 2023 to 2033

Figure 27: North America Market Y-o-Y Growth (%) Projections by Type, 2023 to 2033

Figure 28: North America Market Attractiveness by Product, 2023 to 2033

Figure 29: North America Market Attractiveness by Type, 2023 to 2033

Figure 30: North America Market Attractiveness by Country, 2023 to 2033

Figure 31: Latin America Market Value (US$ Million) by Product, 2023 to 2033

Figure 32: Latin America Market Value (US$ Million) by Type, 2023 to 2033

Figure 33: Latin America Market Value (US$ Million) by Country, 2023 to 2033

Figure 34: Latin America Market Value (US$ Million) Analysis by Country, 2018 to 2033

Figure 35: Latin America Market Value Share (%) and BPS Analysis by Country, 2023 to 2033

Figure 36: Latin America Market Y-o-Y Growth (%) Projections by Country, 2023 to 2033

Figure 37: Latin America Market Value (US$ Million) Analysis by Product, 2018 to 2033

Figure 38: Latin America Market Value Share (%) and BPS Analysis by Product, 2023 to 2033

Figure 39: Latin America Market Y-o-Y Growth (%) Projections by Product, 2023 to 2033

Figure 40: Latin America Market Value (US$ Million) Analysis by Type, 2018 to 2033

Figure 41: Latin America Market Value Share (%) and BPS Analysis by Type, 2023 to 2033

Figure 42: Latin America Market Y-o-Y Growth (%) Projections by Type, 2023 to 2033

Figure 43: Latin America Market Attractiveness by Product, 2023 to 2033

Figure 44: Latin America Market Attractiveness by Type, 2023 to 2033

Figure 45: Latin America Market Attractiveness by Country, 2023 to 2033

Figure 46: Europe Market Value (US$ Million) by Product, 2023 to 2033

Figure 47: Europe Market Value (US$ Million) by Type, 2023 to 2033

Figure 48: Europe Market Value (US$ Million) by Country, 2023 to 2033

Figure 49: Europe Market Value (US$ Million) Analysis by Country, 2018 to 2033

Figure 50: Europe Market Value Share (%) and BPS Analysis by Country, 2023 to 2033

Figure 51: Europe Market Y-o-Y Growth (%) Projections by Country, 2023 to 2033

Figure 52: Europe Market Value (US$ Million) Analysis by Product, 2018 to 2033

Figure 53: Europe Market Value Share (%) and BPS Analysis by Product, 2023 to 2033

Figure 54: Europe Market Y-o-Y Growth (%) Projections by Product, 2023 to 2033

Figure 55: Europe Market Value (US$ Million) Analysis by Type, 2018 to 2033

Figure 56: Europe Market Value Share (%) and BPS Analysis by Type, 2023 to 2033

Figure 57: Europe Market Y-o-Y Growth (%) Projections by Type, 2023 to 2033

Figure 58: Europe Market Attractiveness by Product, 2023 to 2033

Figure 59: Europe Market Attractiveness by Type, 2023 to 2033

Figure 60: Europe Market Attractiveness by Country, 2023 to 2033

Figure 61: Asia Pacific Market Value (US$ Million) by Product, 2023 to 2033

Figure 62: Asia Pacific Market Value (US$ Million) by Type, 2023 to 2033

Figure 63: Asia Pacific Market Value (US$ Million) by Country, 2023 to 2033

Figure 64: Asia Pacific Market Value (US$ Million) Analysis by Country, 2018 to 2033

Figure 65: Asia Pacific Market Value Share (%) and BPS Analysis by Country, 2023 to 2033

Figure 66: Asia Pacific Market Y-o-Y Growth (%) Projections by Country, 2023 to 2033

Figure 67: Asia Pacific Market Value (US$ Million) Analysis by Product, 2018 to 2033

Figure 68: Asia Pacific Market Value Share (%) and BPS Analysis by Product, 2023 to 2033

Figure 69: Asia Pacific Market Y-o-Y Growth (%) Projections by Product, 2023 to 2033

Figure 70: Asia Pacific Market Value (US$ Million) Analysis by Type, 2018 to 2033

Figure 71: Asia Pacific Market Value Share (%) and BPS Analysis by Type, 2023 to 2033

Figure 72: Asia Pacific Market Y-o-Y Growth (%) Projections by Type, 2023 to 2033

Figure 73: Asia Pacific Market Attractiveness by Product, 2023 to 2033

Figure 74: Asia Pacific Market Attractiveness by Type, 2023 to 2033

Figure 75: Asia Pacific Market Attractiveness by Country, 2023 to 2033

Figure 76: MEA Market Value (US$ Million) by Product, 2023 to 2033

Figure 77: MEA Market Value (US$ Million) by Type, 2023 to 2033

Figure 78: MEA Market Value (US$ Million) by Country, 2023 to 2033

Figure 79: MEA Market Value (US$ Million) Analysis by Country, 2018 to 2033

Figure 80: MEA Market Value Share (%) and BPS Analysis by Country, 2023 to 2033

Figure 81: MEA Market Y-o-Y Growth (%) Projections by Country, 2023 to 2033

Figure 82: MEA Market Value (US$ Million) Analysis by Product, 2018 to 2033

Figure 83: MEA Market Value Share (%) and BPS Analysis by Product, 2023 to 2033

Figure 84: MEA Market Y-o-Y Growth (%) Projections by Product, 2023 to 2033

Figure 85: MEA Market Value (US$ Million) Analysis by Type, 2018 to 2033

Figure 86: MEA Market Value Share (%) and BPS Analysis by Type, 2023 to 2033

Figure 87: MEA Market Y-o-Y Growth (%) Projections by Type, 2023 to 2033

Figure 88: MEA Market Attractiveness by Product, 2023 to 2033

Figure 89: MEA Market Attractiveness by Type, 2023 to 2033

Figure 90: MEA Market Attractiveness by Country, 2023 to 2033

Recommendations

Healthcare

Peptide Synthesis Market

Published : January 2023

Healthcare

Peptide Therapeutics Market

Published : January 2023

Healthcare

Peptide Antibiotics Market

Published : December 2022

Explore Healthcare Insights

View Reports

Peptide Drug Conjugates Market