Peptide-based Sweetener Size and Share Forecast Outlook 2025 to 2035

The peptide-based sweeteners market is expected to be valued at USD 935.6 million in 2025 and reach a valuation of USD 1,667.3 million by 2035. An absolute increase of USD 731.7 million is anticipated over the decade, representing a total growth of approximately 78.2%. This expansion reflects a compound annual growth rate (CAGR) of 5.9%, signaling steady yet resilient momentum across functional and clean-label ingredient categories.
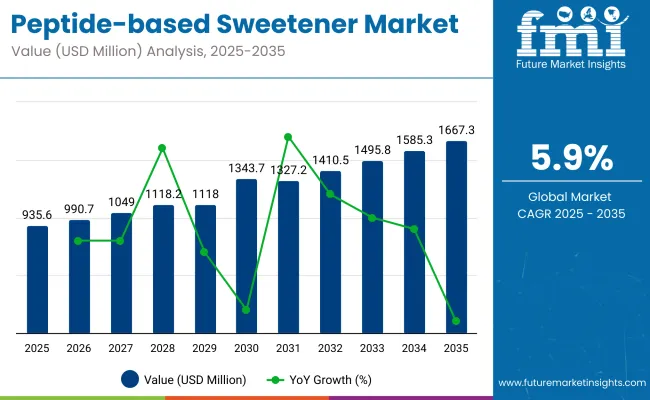
Quick Stats for Peptide-based Sweetener

  • Peptide-based Sweetener Value (2025): USD 935.6 million
  • Peptide-based Sweetener Forecast Value (2035): USD 1,667.3 million
  • Peptide-based Sweetener Forecast CAGR: 5.9%
  • Leading Segment in Peptide-based Sweetener in 2025, by Peptide Type: Sweet‑Tasting Peptides (25%)
  • Key Growth Regions in the Peptide-based Sweetener: North America, Asia-Pacific, Europe
  • Top Key Players in Peptide-based Sweetener: Blue California, Matsutani Chemical Industry Co., Ltd., Manus Bio, Neuland Laboratories Ltd., Bachem Holding AG, Nerudia, Zhongke New Life Biotechnology.

Peptide Based Sweeteners 1

Metric Value
Peptide-based Sweetener Estimated Value in (2025E) USD 935.6 million
Peptide-based Sweetener Forecast Value in (2035F) USD 1,667.3 million
Forecast CAGR (2025 to 2035) 5.9%

During the first half of the forecast period from 2025 to 2030 the market is projected to expand from USD 935.6 million to approximately USD 1,243.7 million, contributing nearly USD 308.1 million, or 42% of total decade growth. This phase is expected to be shaped by rising demand for plant-based and fermentation-derived peptides that align with metabolic health trends and sugar reduction mandates.

“Sweet-tasting peptides and natural peptide-based sweeteners are expected to gain traction in functional beverages and diabetic-friendly formulations, as evidenced by Sweegen’s 2024 launches in North America and Ajinomoto’s clinical trials in metabolic beverages (Company Reports, 2024).”

The second half of the decade from 2030 to 2035 is forecasted to add USD 423.6 million, accounting for the remaining 58% of decade growth, as the market is propelled by rapid advances in synthetic biology and precision peptide engineering. During this phase, synthetic and engineered Peptide-based Sweeteners are projected to witness broader regulatory clearance and commercialization. Enhanced solubility, thermal stability, and compatibility with reformulated consumer health products are expected to accelerate penetration across mainstream food and nutraceutical applications.

From 2020 to 2024, the peptide-based sweeteners market grew steadily from an emerging niche to a recognized functional ingredient category, supported by demand in beverages, nutraceuticals, and diabetic-friendly food applications. During this period, fermentation-derived peptide producers held a dominant position, accounting for over 35% of total volume share. Leading players such as Ajinomoto and Sweegen expanded their capabilities through partnerships and synthetic biology platforms to meet the rising demand for clean-label sweeteners.

By 2025, demand is expected to reach USD 935.6 million, with the market transitioning toward digital-first formulation platforms and AI-assisted peptide design. Recurring revenue streams from D2C formulations and ingredient licensing models are expected to surpass 20% share. Competitive advantage is projected to shift from volume-based supply chains toward regulatory flexibility and digital formulation tools, as seen in Conagen’s AI-based peptide screening and Blue California’s proprietary formulation platforms (Ingredient Insights, Q1 2025).

Why the Peptide-based Sweetener is growing?

Significant momentum within the peptide-based sweeteners market is being driven by a combination of high-growth peptide types, sustainable sourcing pathways, and functional end-use applications. Among peptide types, natural Peptide-based Sweeteners and sweet-tasting peptides are expected to lead, supported by CAGRs of 9.5% and 9.2% respectively. These segments are being increasingly preferred due to their clean-label appeal and regulatory compatibility in both food and health applications.

By source, microbial and fermentation-derived peptides are projected to dominate growth with a 9.6% CAGR, aided by precision fermentation advances and favorable consumer perception of “bio-native” ingredients. Plant-derived peptides, contributing 30% of 2025 value share, are also gaining ground owing to their sustainable sourcing and ease of formulation integration.

On the application front, beverages are forecasted to contribute the highest growth, driven by their 28% market share and 9.5% CAGR, as Peptide-based Sweeteners are being rapidly adopted in functional drinks and reformulated soft beverages. Tabletop sweeteners and confectionery segments are also emerging as high-opportunity areas due to shifting consumer preferences for low-calorie indulgence products.

Segmental Analysis

The peptide-based sweeteners market has been segmented across Peptide Type, Source, and Application to provide a comprehensive understanding of growth patterns and innovation pathways. Each segment has been defined based on its molecular profile, production origin, and use-case alignment, allowing targeted strategy development across stakeholders.

Peptide Type segmentation includes sweet-tasting peptides, taste-modulating peptides, sweetness enhancer peptides, natural Peptide-based Sweeteners, and synthetic Peptide-based Sweeteners. These classifications reflect how peptides interact with sweetness receptors and metabolic pathways, offering differentiated value propositions across applications.

Source segmentation spans plant-derived, animal-derived, microbial/fermentation-derived, and synthetic/engineered peptides. Source selection plays a key role in regulatory acceptance, scalability, and clean-label positioning.

Application segmentation includes beverages, confectionery & baked goods, dairy products, nutraceuticals, pharmaceuticals, and tabletop sweeteners. These categories are being shaped by shifting dietary patterns, functional product innovation, and sugar replacement mandates.
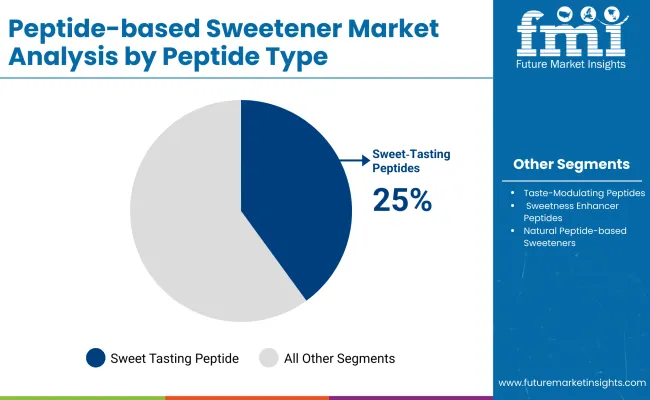
Insights into the Peptide Type Segment with Sweet Tasting Peptides Leading in Market Share

Peptide Based Sweeteners Analysis By Peptide Type

Peptide Type Segment Market Value Share, 2025
Sweet Tasting Peptides 25.0%
Taste Modulating Peptides 20.0%

The peptide type segment is expected to be led by natural Peptide-based Sweeteners and sweet-tasting peptides, each contributing 25% of market value in 2025. Demand for natural peptides has been reinforced by clean-label imperatives, while sweet-tasting peptides are being favored for their palatability and compatibility across categories.

Growth rates above 9% are forecasted across all types, signaling broad-based adoption. Formulation flexibility, regulatory clarity, and health-aligned marketing are expected to further strengthen these sub segments. Synthetic peptides, while contributing less, are anticipated to gain traction as bioengineering advances enable high-performance sweetness profiles.
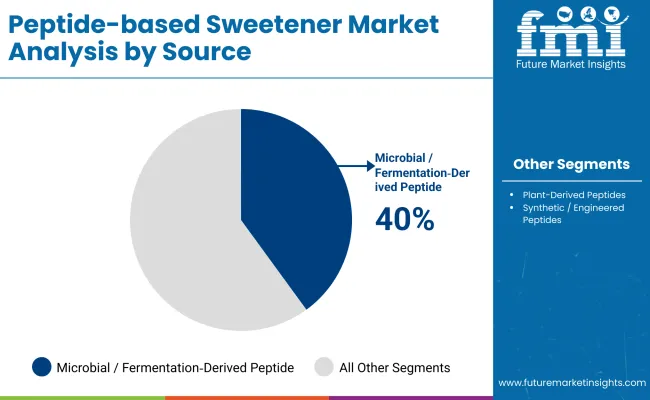
Insights into the Source Segment with Microbial/Fermentation Derived Peptides Dominating the Demand

Peptide Based Sweeteners Analysis By Source

Source 2025 Share%
Microbial / Fermentation Derived Peptides 40.0%
Plant Derived Peptides 30.0%
Animal Derived Peptides 15.0%

Microbial and fermentation-derived peptides are forecasted to contribute the largest share at 40% of the market in 2025, supported by strong CAGR of 9.6%. This dominance is being reinforced by scalability, sustainability, and strong consumer acceptance of fermentation-based “bio-native” solutions.

Plant-derived peptides, with a 30% share, are also gaining ground through alignment with vegan and allergen-free formulation needs. Synthetic/engineered peptides are expected to see innovation-led growth through synthetic biology platforms that enhance sweetness intensity and thermal stability. Animal-derived peptides remain niche but are being explored for pharmaceutical-grade applications.
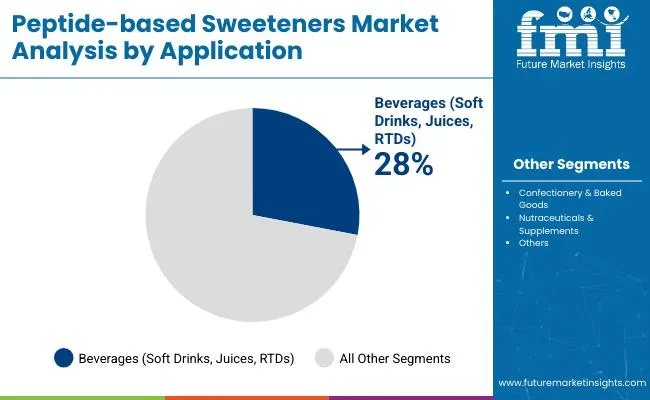
Insights into the Application Segment with Focus on Beverages (Soft Drinks, Juices, RTDs)

Peptide Based Sweeteners By Application

Application 2025 Share%
Beverages (Soft Drinks, Juices, RTDs) 28.0%
Confectionery & Baked Goods 20.0%
Nutraceuticals & Supplements 15.0%

The beverage segment is projected to account for 28% of market value in 2025, driven by the rapid adoption of peptide-based sweeteners in functional beverages, soft drinks, and reformulated juices. Peptides are being selected for their low glycemic impact and flavor-enhancing properties, making them ideal for health-oriented beverages.

Confectionery and baked goods, together with tabletop sweeteners, are also expected to record strong growth as sugar-reduction trends gain policy and consumer backing. Applications in nutraceuticals and pharmaceuticals are forecasted to expand, especially where peptides double as bioactive agents offering therapeutic value beyond sweetness.

What are the Drivers, Restraints, and Key Trends of the Peptide-based Sweetener?

Health-driven reformulations and regulatory sugar mandates, including the UK’s Soft Drinks Industry Levy and India’s FSSAI reformulation program, are accelerating the adoption of peptide-based sweeteners across mainstream beverage categories.

Regulatory Pressure for Sugar Reduction and Metabolic Health

The peptide-based sweeteners market is being significantly driven by escalating global regulatory mandates targeting sugar reduction in processed foods and beverages. Policies such as sugar taxes, front-of-pack labeling, and WHO dietary guidelines have reinforced the shift toward alternative sweetening solutions that offer both safety and efficacy.

Peptide-based sweeteners, especially those derived from natural or fermentation processes, have been increasingly favored due to their metabolic neutrality and minimal caloric impact. As non-communicable disease burdens intensify globally, particularly diabetes and obesity, public health agencies are expected to expand reformulation frameworks. In this context, peptide-based solutions are being positioned not only as sugar substitutes but as functional metabolic agents aligned with long-term health goals.

Precision Fermentation Unlocking Cost-Effective Sweetener Innovation

A pivotal trend reshaping the peptide-based sweeteners landscape is the advancement of precision fermentation technologies. These platforms are enabling cost-effective, scalable, and customizable production of sweet peptide molecules that were previously limited by extraction inefficiencies or high biosynthesis costs.

Through microbial chassis optimization and protein structure engineering, peptides can now be designed for targeted sensory profiles, improved solubility, and greater shelf stability. As bio foundry models and synthetic biology collaborations expand, the time-to-market for novel Peptide-based Sweeteners is expected to shrink considerably. This technological shift is positioning peptide-based sweeteners as commercially viable for mainstream CPG brands seeking clean-label, next-gen sweetening agents.
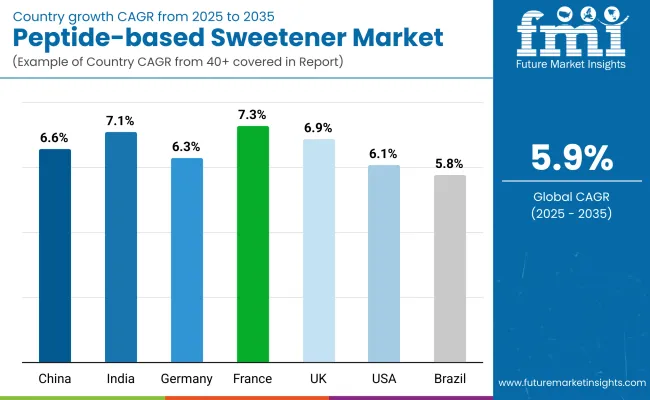
Analysis of Peptide-based Sweetener by Key Countries

Country Wise Analysis Of Peptide Based Sweeteners

Countries CAGR (2025 to 2035)
China 6.6%
India 7.1%
Germany 6.3%
France 7.3%
UK 6.9%
USA 6.1%
Brazil 5.8%

The global peptide-based sweeteners market is expected to experience uneven geographic expansion, shaped by regulatory intensity, food reformulation mandates, and biomanufacturing investments. Countries such as France, India, and the UK are forecasted to lead growth, with CAGRs of 7.3%, 7.1%, and 6.9%, respectively, as clean-label dietary frameworks and sugar reduction policies are being institutionalized. In France, peptide-based sweeteners are being increasingly incorporated into health-positioned beverages and functional dairy alternatives, supported by strong innovation ecosystems and EU health regulations.

In India, market acceleration is being driven by rising middle-class health awareness and government support for nutraceutical innovation. Local food and beverage manufacturers are expected to integrate fermentation-derived peptides into diabetic-friendly and sports nutrition formats. Meanwhile, China, at 6.6% CAGR, is projected to maintain steady adoption, bolstered by investments in synthetic biology platforms and precision fermentation hubs.

Germany and the USA, with CAGRs of 6.3% and 6.1% respectively, are witnessing moderate growth, where adoption is being led by institutional foodservice, pharmaceutical applications, and early integration of Peptide-based Sweeteners in clinical nutrition. In Brazil, although growth is slower at 5.8%, demand is expected to rise as health taxes on sugar are expanded and wellness-positioned product portfolios diversify across regional brands.

Sales Outlook for Peptide-based Sweetener in the United States

Year USA Peptide-based Sweetener(USD million)
2025 224.5
2026 237.9
2027 251.2
2028 265.3
2029 281.4
2030 295.6
2031 313.5
2032 329.5
2033 351.8
2034 373.0
2035 397.7

The peptide-based sweeteners market in the United States is projected to grow from USD 224.5 million in 2025 to USD 397.7 million by 2035, reflecting a compound annual growth rate (CAGR) of 5.8%. Growth is being propelled by aggressive reformulation initiatives among food and beverage manufacturers responding to FDA guidelines and evolving consumer expectations for low-glycemic, clean-label products.

Peptide-based Sweeteners have been increasingly adopted in functional beverages and sugar-free dairy alternatives, with preference being shown for fermentation-derived and plant-based peptide sources. Steady demand has also been observed in the nutraceuticals and dietary supplements segment, where sweeteners with metabolic neutrality are favored.

Digital retail platforms and D2C wellness brands have been instrumental in mainstreaming awareness around peptide-based alternatives. Software-led nutritional scoring tools and label transparency initiatives are creating favorable market conditions for peptides over artificial or synthetic counterparts.

  • Reformulated beverages and functional foods are key categories accelerating adoption in the USA
  • D2C supplement brands are deploying Peptide-based Sweeteners to align with sugar-free positioning and gut health claims.

Growth and Expansion Outlook for Peptide-based Sweetener in the United Kingdom

The peptide-based sweeteners market in the United Kingdom is forecasted to witness steady expansion through 2035, supported by a CAGR of 6.9%. Regulatory momentum under the UK Soft Drinks Industry Levy has been intensifying pressure on manufacturers to reduce added sugar, leading to increased adoption of peptide-based alternatives.

Health-oriented consumer preferences are being shaped by NHS-backed public health campaigns, further elevating demand for low-glycemic sweeteners in ready-to-drink products. Clean-label peptides derived from plant and fermentation sources are being prioritized in bakery, dairy, and adult nutrition categories. Regulatory clarity post-Brexit has allowed new ingredient approvals to be fast-tracked under UK-specific food safety policies.

  • Sugar reformulation frameworks are accelerating peptide usage.
  • Fermentation-derived peptides are favored in meal replacement drinks.
  • Functional bakery goods are integrating natural Peptide-based Sweeteners.
  • Post-Brexit regulatory autonomy is facilitating novel peptide approvals.

Growth and Expansion Outlook for Peptide-based Sweetener in India

In India, the peptide-based sweeteners market is projected to grow at a robust 7.1% CAGR through 2035, driven by heightened urban health consciousness and rising demand for diabetic-friendly food solutions. Government-led initiatives promoting sugar reduction, such as FSSAI's Eat Right India movement, have encouraged both domestic and multinational brands to invest in peptide-based alternatives.

Nutraceuticals and ayurvedic supplement sectors are witnessing peptide integration, particularly in herbal formulations requiring palatable sweetness without compromising efficacy. Demand is also being propelled by growing e-commerce penetration and startup-led innovation in functional beverages and snacks.

  • High prevalence of diabetes is encouraging peptide adoption.
  • Ayurvedic and herbal supplement formulations are integrating peptides.
  • E-commerce channels are accelerating D2C peptide product launches.
  • Sugar-reduction campaigns are improving public and industry alignment.

Sales Outlook for Peptide-based Sweetener in China

The peptide-based sweeteners market in China is expected to grow steadily at a 6.6% CAGR, supported by strong investments in synthetic biology and food innovation infrastructure. National sugar-reduction policies and alignment with global dietary guidelines have stimulated industry interest in fermentation-derived and engineered Peptide-based Sweeteners.

The beverage sector-particularly functional tea, yogurt drinks, and meal replacements is being prioritized for reformulation using heat-stable, high-intensity peptide options. Consumer acceptance has been facilitated by widespread health tracking apps and increased awareness of glycemic response in diet.

  • Functional beverages are a key driver of Peptide-based Sweetener use.
  • Synthetic biology investment is enabling custom peptide development.
  • Health monitoring apps are encouraging low-sugar purchasing decisions.
  • Government food safety frameworks are supporting peptide approval.

In-depth Analysis of Peptide-based Sweetener in Germany

Countries 2025
UK 20.4%
Germany 21.8%
Italy 9.0%
France 12.9%
Spain 11.4%
BENELUX 6.9%
Nordic 5.1%
Rest of Europe 12.4%
Countries 2035
UK 20.1%
Germany 21.3%
Italy 10.5%
France 13.6%
Spain 11.4%
BENELUX 5.5%
Nordic 5.9%
Rest of Europe 11.8%

Germany’s peptide-based sweeteners market is forecasted to expand at a 6.3% CAGR, fueled by its leadership in clean-label innovation and functional food engineering. Sugar taxes and EU labeling laws have prompted proactive reformulation strategies across the food and beverage value chain.

Peptide-based Sweeteners are being increasingly adopted in plant-based dairy alternatives, energy bars, and pharmaceutical syrups where low-glycemic performance and thermal resilience are critical. Sustainability narratives have favored fermentation- and plant-derived peptides over chemically synthesized sweeteners.

  • EU regulations are strengthening demand for compliant sweetener alternatives.
  • Peptides are being used in lactose-free and vegan dairy beverages.
  • Functional confectionery is integrating peptides for reduced sugar content.
  • Industrial R&D centers are investing in precision fermentation processes.

Growth Outlook for Peptide-based Sweetener in Japan

Peptide Type Market Value Share, 2025
Sweet Tasting Peptides 26.0%
Taste Modulating Peptides 21.0%
Sweetness Enhancer Peptides 14.0%
Natural Peptide-based Sweetener s 24.0%
Synthetic Peptide-based Sweetener s 15.0%

The peptide-based sweeteners market in Japan is projected to achieve steady growth through 2035, driven by heightened consumer health awareness and national policies targeting sugar intake reduction. In 2025, sweet-tasting peptides are expected to lead with 26% share, followed closely by natural Peptide-based Sweeteners at 24%, highlighting Japan’s strong preference for functional and clean-label food ingredients.

This distribution reflects a nuanced shift toward metabolically safe sweetness enhancers that align with the country's rising aging population and their dietary needs. Sweetness enhancer peptides, though contributing a smaller share of 14%, are forecasted to grow rapidly due to their integration in wellness-positioned beverages and low-calorie supplements.

Product innovation has been largely supported by Japanese manufacturers’ emphasis on bioactive functionality, precise flavor calibration, and synergy with traditional dietary formats. Regulatory approval processes have remained robust yet favorable, allowing rapid commercialization of fermentation-derived peptides.

  • Japan is expected to hold a significant regional share in the Asia-Pacific peptide-based sweeteners market by 2025.
  • Sweet-tasting and natural peptide segments together contribute 50% of the national market.
  • Growth is being driven by clean-label, senior-friendly functional foods.
  • Innovation is focused on low-dose, high-potency peptide formulations tailored for traditional diets.

Opportunity Analysis of South Korea Peptide-based Sweetener

Source Market Value Share, 2025
Plant Derived Peptides 31.0%
Animal Derived Peptides 14.0%
Microbial / Fermentation Derived Peptides 40.0%
Synthetic / Engineered Peptides 15.0%

The peptide-based sweeteners market in South Korea is projected to expand steadily through 2035, driven by a national emphasis on functional health foods and clean-label innovation. In 2025, microbial and fermentation-derived peptides are expected to dominate with a 40% market share, reflecting the country’s strategic investments in precision fermentation and bio manufacturing infrastructure.

Plant-derived peptides, contributing 31%, are being increasingly incorporated into low-glycemic traditional foods and K-beauty-inspired functional beverages. South Korea’s regulatory framework has enabled the early adoption of naturally sourced bioactive ingredients, which has favored both local R&D and global brand entry.

Synthetic/engineered and animal-derived peptides together make up 29%, with growth being seen in pharmaceutical and clinical nutrition channels. As urban consumers seek sugar alternatives that align with metabolic health, digestive wellness, and sustainability, the market is expected to continue evolving toward biologically derived solutions.
  • Fermentation-derived peptides are leading due to strong biomanufacturing capacity.
  • Clean-label preferences are reinforcing demand for plant-based Peptide-based Sweeteners.
  • K-wellness trends are integrating peptides into traditional and beauty-linked formats.
  • Regulatory agility has enabled rapid peptide commercialization for domestic and export markets.

Competitive Landscape of Peptide-based Sweetener

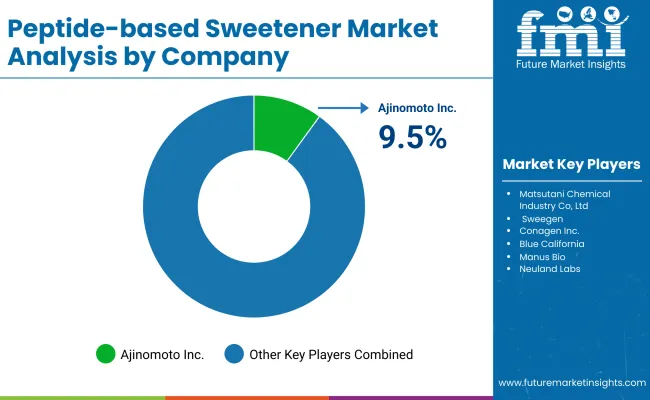
Peptide Based Sweeteners Analysis By Company

Company Global Value Share 2025
Ajinomoto, Inc. 9.5%
Others 90.5%

The peptide-based sweeteners market is moderately fragmented, with global leaders, mid-sized innovators, and bio-specialists competing across diverse formulation and application domains. Industry pioneers such as Ajinomoto Co., Inc., Matsutani Chemical Industry Co., Ltd., and Sweegen are recognized for their extensive R&D pipelines, large-scale fermentation infrastructure, and regulatory agility across major markets. These players have been prioritizing precision fermentation, IP-protected peptide variants, and strategic partnerships to accelerate global reach in the functional foods and nutraceutical space.

“Mid-sized innovators such as Blue California, Conagen Inc., and Manus Bio have focused on synthetic biology-driven customization, evidenced by their participation in the 2025 Clean Label Expo and patent filings related to enzyme-based peptide modification (USPTO, Jan 2025), enabling the production of high-intensity Peptide-based Sweeteners tailored to specific glycemic profiles and stability requirements. These firms are advancing adoption through D2C collaborations and ingredient-as-a-service models in the clean-label reformulation sector.

Specialist firms like Nerudia, Neuland Laboratories Ltd., and Zhongke New Life Biotechnology are being positioned for niche applications in pharmaceutical-grade formulations and traditional wellness formats. Custom peptide engineering and integration into therapeutic nutrition pipelines are being used as differentiation levers.

Competitive advantage is shifting from peptide origin alone to full-stack capabilities spanning metabolic pathway design, regulatory strategy, and taste optimization algorithms. Ecosystem integration, sustainability credentials, and digital formulation tools are expected to define leadership over the coming decade.

Key Developments in Peptide-based Sweetener

  • In February 2025, the TastePepAI artificial intelligence framework was introduced to enable de novo design of taste-tailored peptides, including sweet candidates, streamlining safety evaluation and accelerating novel eptide discovery for the food industry.
  • In January 2025, a patent application was filed for a novel process enabling the production of natural Peptide-based Sweeteners via fermentation, representing a key milestone in scalable, clean-label sweetener innovation and signaling growing interest in sustainable peptide synthesis pathways.

Scope of the Report

Item Value
Quantitative Units USD 935.6 million
Peptide Type Sweet-Tasting Peptides, Taste-Modulating Peptides, Sweetness Enhancer Peptides, Natural Peptide-based Sweeteners, Synthetic Peptide-based Sweeteners
Source Plant-Derived Peptides, Animal-Derived Peptides, Microbial / Fermentation-Derived Peptides, Synthetic / Engineered Peptides
Formulation Type Powder, Liquid, Tablets, Sachets
Application Beverages (Soft Drinks, Juices, RTDs), Confectionery & Baked Goods, Dairy Products, Nutraceuticals, Pharmaceuticals, Tabletop Sweeteners
End User Food & Beverage Ingredients, Animal Feed & Aquafeed, Nutraceuticals & Dietary Supplements, Cosmetics & Personal Care, Industrial Uses
Sales Channel Food & Beverage Manufacturers (B2B), Nutraceutical & Pharmaceutical Companies, Direct-to-Consumer (D2C), Online Retail
Regions Covered North America, Europe, Asia-Pacific, Latin America, Middle East & Africa
Country Covered United States, Canada, Germany, France, United Kingdom, China, Japan, India, Brazil, South Africa
Key Companies Profiled Ajinomoto Co., Inc., Matsutani Chemical Industry Co., Ltd., Sweegen, Conagen Inc., Blue California, Manus Bio, Neuland Labs, Bachem, Nerudia
Additional Attributes Dollar sales by peptide type and application, growth in natural and fermentation-derived peptides, integration into clean-label food and beverages, synthetic biology breakthroughs in peptide design, rising demand in diabetic and wellness segments, regional regulatory impact, and D2C expansion of peptide-based formulations.

Key Segmentation

By Peptide Type:

  • Sweet-Tasting Peptides
  • Taste-Modulating Peptides
  • Sweetness Enhancer Peptides
  • Natural Peptide Sweeteners
  • Synthetic Peptide Sweeteners

By Source:

  • Plant-Derived Peptides
  • Animal-Derived Peptides
  • Microbial/Fermentation-Derived Peptides
  • Synthetic/Engineered Peptides

By Application:

  • Beverages
  • Confectionery & Baked Goods
  • Dairy Products
  • Nutraceuticals & Supplements
  • Pharmaceuticals
  • Tabletop Sweeteners

By Formulation Type:

  • Powder
  • Liquid
  • Tablets
  • Sachets

By Sales Channel:

  • Food & Beverage Manufacturers (B2B)
  • Nutraceutical & Pharmaceutical Companies
  • Direct-to-Consumer (D2C)
  • Online Retail

By End User:

  • Food Industry
  • Beverage Industry
  • Nutraceutical Industry
  • Pharmaceutical Industry

By Region:

  • North America
  • Latin America
  • Europe
  • East Asia
  • South Asia & Pacific
  • Middle East and Africa

Table of Content

  1. Executive Summary
    • Global Market Outlook
    • Demand-side Trends
    • Supply-side Trends
    • Technology Roadmap Analysis
    • Analysis and Recommendations
  2. Market Overview
    • Market Coverage / Taxonomy
    • Market Definition / Scope / Limitations
  3. Market Background
    • Market Dynamics
      • Drivers
      • Restraints
      • Opportunity
      • Trends
    • Scenario Forecast
      • Demand in Optimistic Scenario
      • Demand in Likely Scenario
      • Demand in Conservative Scenario
    • Opportunity Map Analysis
    • Product Life Cycle Analysis
    • Supply Chain Analysis
    • Investment Feasibility Matrix
    • Value Chain Analysis
    • PESTLE and Porter’s Analysis
    • Regulatory Landscape
    • Regional Parent Market Outlook
    • Production and Consumption Statistics
    • Import and Export Statistics
  4. Global Market Analysis 2020 to 2024 and Forecast, 2025 to 2035
    • Historical Market Size Value (USD Million) & Volume (MT) Analysis, 2020 to 2024
    • Current and Future Market Size Value (USD Million) & Volume (MT) Projections, 2025 to 2035
      • Y-o-Y Growth Trend Analysis
      • Absolute $ Opportunity Analysis
  5. Global Market Pricing Analysis 2020 to 2024 and Forecast 2025 to 2035
  6. Global Market Analysis 2020 to 2024 and Forecast 2025 to 2035, By Peptide Type
    • Introduction / Key Findings
    • Historical Market Size Value (USD Million) & Volume (MT) Analysis By Peptide Type, 2020 to 2024
    • Current and Future Market Size Value (USD Million) & Volume (MT) Analysis and Forecast By Peptide Type, 2025 to 2035
      • Sweet-Tasting Peptides
      • Taste-Modulating Peptides
      • Sweetness Enhancer Peptides
      • Natural Peptide Sweeteners
      • Synthetic Peptide Sweeteners
    • Y-o-Y Growth Trend Analysis By Peptide Type, 2020 to 2024
    • Absolute $ Opportunity Analysis By Peptide Type, 2025 to 2035
  7. Global Market Analysis 2020 to 2024 and Forecast 2025 to 2035, By Source
    • Introduction / Key Findings
    • Historical Market Size Value (USD Million) & Volume (MT) Analysis By Source, 2020 to 2024
    • Current and Future Market Size Value (USD Million) & Volume (MT) Analysis and Forecast By Source, 2025 to 2035
      • Plant-Derived Peptides
      • Animal-Derived Peptides
      • Microbial/Fermentation-Derived Peptides
      • Synthetic/Engineered Peptides
    • Y-o-Y Growth Trend Analysis By Source, 2020 to 2024
    • Absolute $ Opportunity Analysis By Source, 2025 to 2035
  8. Global Market Analysis 2020 to 2024 and Forecast 2025 to 2035, By Application
    • Introduction / Key Findings
    • Historical Market Size Value (USD Million) & Volume (MT) Analysis By Application, 2020 to 2024
    • Current and Future Market Size Value (USD Million) & Volume (MT) Analysis and Forecast By Application, 2025 to 2035
      • Beverages
      • Confectionery & Baked Goods
      • Dairy Products
      • Nutraceuticals & Supplements
      • Pharmaceuticals
      • Tabletop Sweeteners
    • Y-o-Y Growth Trend Analysis By Application, 2020 to 2024
    • Absolute $ Opportunity Analysis By Application, 2025 to 2035
  9. Global Market Analysis 2020 to 2024 and Forecast 2025 to 2035, By Formulation Type
    • Introduction / Key Findings
    • Historical Market Size Value (USD Million) & Volume (MT) Analysis By Formulation Type, 2020 to 2024
    • Current and Future Market Size Value (USD Million) & Volume (MT) Analysis and Forecast By Formulation Type, 2025 to 2035
      • Powder
      • Liquid
      • Tablets
      • Sachets
    • Y-o-Y Growth Trend Analysis By Formulation Type, 2020 to 2024
    • Absolute $ Opportunity Analysis By Formulation Type, 2025 to 2035
  10. Global Market Analysis 2020 to 2024 and Forecast 2025 to 2035, By Sales Channel
    • Introduction / Key Findings
    • Historical Market Size Value (USD Million) & Volume (MT) Analysis By Sales Channel, 2020 to 2024
    • Current and Future Market Size Value (USD Million) & Volume (MT) Analysis and Forecast By Sales Channel, 2025 to 2035
      • Food & Beverage Manufacturers (B2B)
      • Nutraceutical & Pharmaceutical Companies
      • Direct-to-Consumer (D2C)
      • Online Retail
    • Y-o-Y Growth Trend Analysis By Sales Channel, 2020 to 2024
    • Absolute $ Opportunity Analysis By Sales Channel, 2025 to 2035
  11. Global Market Analysis 2020 to 2024 and Forecast 2025 to 2035, By End User
    • Introduction / Key Findings
    • Historical Market Size Value (USD Million) & Volume (MT) Analysis By End User, 2020 to 2024
    • Current and Future Market Size Value (USD Million) & Volume (MT) Analysis and Forecast By End User, 2025 to 2035
      • Food Industry
      • Beverage Industry
      • Nutraceutical Industry
      • Pharmaceutical Industry
    • Y-o-Y Growth Trend Analysis By End User, 2020 to 2024
    • Absolute $ Opportunity Analysis By End User, 2025 to 2035
  12. Global Market Analysis 2020 to 2024 and Forecast 2025 to 2035, By Region
    • Introduction
    • Historical Market Size Value (USD Million) & Volume (MT) Analysis By Region, 2020 to 2024
    • Current Market Size Value (USD Million) & Volume (MT) Analysis and Forecast By Region, 2025 to 2035
      • North America
      • Latin America
      • Europe
      • East Asia
      • South Asia & Pacific
      • Middle East and Africa
    • Market Attractiveness Analysis By Region
  13. North America Market Analysis 2020 to 2024 and Forecast 2025 to 2035, By Country
    • Historical Market Size Value (USD Million) & Volume (MT) Trend Analysis By Market Taxonomy, 2020 to 2024
    • Market Size Value (USD Million) & Volume (MT) Forecast By Market Taxonomy, 2025 to 2035
      • By Country
        • USA
        • Canada
      • By Peptide Type
      • By Source
      • By Application
      • By Formulation Type
      • By Sales Channel
      • By End User
    • Market Attractiveness Analysis
      • By Country
      • By Peptide Type
      • By Source
      • By Application
      • By Formulation Type
      • By Sales Channel
      • By End User
    • Key Takeaways
  14. Latin America Market Analysis 2020 to 2024 and Forecast 2025 to 2035, By Country
    • Historical Market Size Value (USD Million) & Volume (MT) Trend Analysis By Market Taxonomy, 2020 to 2024
    • Market Size Value (USD Million) & Volume (MT) Forecast By Market Taxonomy, 2025 to 2035
      • By Country
        • Brazil
        • Mexico
        • Colombia
        • Rest of Latin America
      • By Peptide Type
      • By Source
      • By Application
      • By Formulation Type
      • By Sales Channel
      • By End User
    • Market Attractiveness Analysis
      • By Country
      • By Peptide Type
      • By Source
      • By Application
      • By Formulation Type
      • By Sales Channel
      • By End User
    • Key Takeaways
  15. Europe Market Analysis 2020 to 2024 and Forecast 2025 to 2035, By Country
    • Historical Market Size Value (USD Million) & Volume (MT) Trend Analysis By Market Taxonomy, 2020 to 2024
    • Market Size Value (USD Million) & Volume (MT) Forecast By Market Taxonomy, 2025 to 2035
      • By Country
        • Germany
        • UK
        • France
        • Italy
        • Spain
        • Belgium
        • Netherlands
        • Nordic
        • Switzerland
        • Russia
        • Poland
        • Rest of Europe
      • By Peptide Type
      • By Source
      • By Application
      • By Formulation Type
      • By Sales Channel
      • By End User
    • Market Attractiveness Analysis
      • By Country
      • By Peptide Type
      • By Source
      • By Application
      • By Formulation Type
      • By Sales Channel
      • By End User
    • Key Takeaways
  16. East Asia Market Analysis 2020 to 2024 and Forecast 2025 to 2035, By Country
    • Historical Market Size Value (USD Million) & Volume (MT) Trend Analysis By Market Taxonomy, 2020 to 2024
    • Market Size Value (USD Million) & Volume (MT) Forecast By Market Taxonomy, 2025 to 2035
      • By Country
        • China
        • Japan
        • South Korea
      • By Peptide Type
      • By Source
      • By Application
      • By Formulation Type
      • By Sales Channel
      • By End User
    • Market Attractiveness Analysis
      • By Country
      • By Peptide Type
      • By Source
      • By Application
      • By Formulation Type
      • By Sales Channel
      • By End User
    • Key Takeaways
  17. South Asia & Pacific Market Analysis 2020 to 2024 and Forecast 2025 to 2035, By Country
    • Historical Market Size Value (USD Million) & Volume (MT) Trend Analysis By Market Taxonomy, 2020 to 2024
    • Market Size Value (USD Million) & Volume (MT) Forecast By Market Taxonomy, 2025 to 2035
      • By Country
        • India
        • Thailand
        • Malaysia
        • Indonesia
        • Singapore
        • Vietnam
        • Australia
        • New Zealand
        • Rest of South Asia & Pacific
      • By Peptide Type
      • By Source
      • By Application
      • By Formulation Type
      • By Sales Channel
      • By End User
    • Market Attractiveness Analysis
      • By Country
      • By Peptide Type
      • By Source
      • By Application
      • By Formulation Type
      • By Sales Channel
      • By End User
    • Key Takeaways
  18. Middle East and Africa Market Analysis 2020 to 2024 and Forecast 2025 to 2035, By Country
    • Historical Market Size Value (USD Million) & Volume (MT) Trend Analysis By Market Taxonomy, 2020 to 2024
    • Market Size Value (USD Million) & Volume (MT) Forecast By Market Taxonomy, 2025 to 2035
      • By Country
        • Turkey
        • UAE
        • Saudi Arabia
        • Israel
        • Other GCC Countries
        • North Africa
        • South Africa
      • By Peptide Type
      • By Source
      • By Application
      • By Formulation Type
      • By Sales Channel
      • By End User
    • Market Attractiveness Analysis
      • By Country
      • By Peptide Type
      • By Source
      • By Application
      • By Formulation Type
      • By Sales Channel
      • By End User
    • Key Takeaways
  19. Key Countries Market Analysis
    • USA
      • Pricing Analysis
      • Market Share Analysis, 2024
        • By Peptide Type
        • By Source
        • By Application
        • By Formulation Type
        • By Sales Channel
        • By End User
    • Canada
      • Pricing Analysis
      • Market Share Analysis, 2024
        • By Peptide Type
        • By Source
        • By Application
        • By Formulation Type
        • By Sales Channel
        • By End User
    • Brazil
      • Pricing Analysis
      • Market Share Analysis, 2024
        • By Peptide Type
        • By Source
        • By Application
        • By Formulation Type
        • By Sales Channel
        • By End User
    • Mexico
      • Pricing Analysis
      • Market Share Analysis, 2024
        • By Peptide Type
        • By Source
        • By Application
        • By Formulation Type
        • By Sales Channel
        • By End User
    • Germany
      • Pricing Analysis
      • Market Share Analysis, 2024
        • By Peptide Type
        • By Source
        • By Application
        • By Formulation Type
        • By Sales Channel
        • By End User
    • UK
      • Pricing Analysis
      • Market Share Analysis, 2024
        • By Peptide Type
        • By Source
        • By Application
        • By Formulation Type
        • By Sales Channel
        • By End User
    • France
      • Pricing Analysis
      • Market Share Analysis, 2024
        • By Peptide Type
        • By Source
        • By Application
        • By Formulation Type
        • By Sales Channel
        • By End User
    • Italy
      • Pricing Analysis
      • Market Share Analysis, 2024
        • By Peptide Type
        • By Source
        • By Application
        • By Formulation Type
        • By Sales Channel
        • By End User
    • Spain
      • Pricing Analysis
      • Market Share Analysis, 2024
        • By Peptide Type
        • By Source
        • By Application
        • By Formulation Type
        • By Sales Channel
        • By End User
    • Belgium
      • Pricing Analysis
      • Market Share Analysis, 2024
        • By Peptide Type
        • By Source
        • By Application
        • By Formulation Type
        • By Sales Channel
        • By End User
    • Netherlands
      • Pricing Analysis
      • Market Share Analysis, 2024
        • By Peptide Type
        • By Source
        • By Application
        • By Formulation Type
        • By Sales Channel
        • By End User
    • Nordic
      • Pricing Analysis
      • Market Share Analysis, 2024
        • By Peptide Type
        • By Source
        • By Application
        • By Formulation Type
        • By Sales Channel
        • By End User
    • Switzerland
      • Pricing Analysis
      • Market Share Analysis, 2024
        • By Peptide Type
        • By Source
        • By Application
        • By Formulation Type
        • By Sales Channel
        • By End User
    • Russia
      • Pricing Analysis
      • Market Share Analysis, 2024
        • By Peptide Type
        • By Source
        • By Application
        • By Formulation Type
        • By Sales Channel
        • By End User
    • Poland
      • Pricing Analysis
      • Market Share Analysis, 2024
        • By Peptide Type
        • By Source
        • By Application
        • By Formulation Type
        • By Sales Channel
        • By End User
    • China
      • Pricing Analysis
      • Market Share Analysis, 2024
        • By Peptide Type
        • By Source
        • By Application
        • By Formulation Type
        • By Sales Channel
        • By End User
    • Japan
      • Pricing Analysis
      • Market Share Analysis, 2024
        • By Peptide Type
        • By Source
        • By Application
        • By Formulation Type
        • By Sales Channel
        • By End User
    • South Korea
      • Pricing Analysis
      • Market Share Analysis, 2024
        • By Peptide Type
        • By Source
        • By Application
        • By Formulation Type
        • By Sales Channel
        • By End User
    • India
      • Pricing Analysis
      • Market Share Analysis, 2024
        • By Peptide Type
        • By Source
        • By Application
        • By Formulation Type
        • By Sales Channel
        • By End User
    • Thailand
      • Pricing Analysis
      • Market Share Analysis, 2024
        • By Peptide Type
        • By Source
        • By Application
        • By Formulation Type
        • By Sales Channel
        • By End User
    • Malaysia
      • Pricing Analysis
      • Market Share Analysis, 2024
        • By Peptide Type
        • By Source
        • By Application
        • By Formulation Type
        • By Sales Channel
        • By End User
    • Indonesia
      • Pricing Analysis
      • Market Share Analysis, 2024
        • By Peptide Type
        • By Source
        • By Application
        • By Formulation Type
        • By Sales Channel
        • By End User
    • Singapore
      • Pricing Analysis
      • Market Share Analysis, 2024
        • By Peptide Type
        • By Source
        • By Application
        • By Formulation Type
        • By Sales Channel
        • By End User
    • Vietnam
      • Pricing Analysis
      • Market Share Analysis, 2024
        • By Peptide Type
        • By Source
        • By Application
        • By Formulation Type
        • By Sales Channel
        • By End User
    • Australia
      • Pricing Analysis
      • Market Share Analysis, 2024
        • By Peptide Type
        • By Source
        • By Application
        • By Formulation Type
        • By Sales Channel
        • By End User
    • New Zealand
      • Pricing Analysis
      • Market Share Analysis, 2024
        • By Peptide Type
        • By Source
        • By Application
        • By Formulation Type
        • By Sales Channel
        • By End User
    • Turkey
      • Pricing Analysis
      • Market Share Analysis, 2024
        • By Peptide Type
        • By Source
        • By Application
        • By Formulation Type
        • By Sales Channel
        • By End User
    • UAE
      • Pricing Analysis
      • Market Share Analysis, 2024
        • By Peptide Type
        • By Source
        • By Application
        • By Formulation Type
        • By Sales Channel
        • By End User
    • Saudi Arabia
      • Pricing Analysis
      • Market Share Analysis, 2024
        • By Peptide Type
        • By Source
        • By Application
        • By Formulation Type
        • By Sales Channel
        • By End User
    • Israel
      • Pricing Analysis
      • Market Share Analysis, 2024
        • By Peptide Type
        • By Source
        • By Application
        • By Formulation Type
        • By Sales Channel
        • By End User
  20. Market Structure Analysis
    • Competition Dashboard
    • Competition Benchmarking
    • Market Share Analysis of Top Players
      • By Regional
      • By Peptide Type
      • By Source
      • By Application
      • By Formulation Type
      • By Sales Channel
      • By End User
  21. Competition Analysis
    • Competition Deep Dive
      • Ajinomoto Co., Inc.
        • Overview
        • Product Portfolio
        • Profitability by Market Segments (Product/Age /Sales Channel/Region)
        • Sales Footprint
        • Strategy Overview
        • Matsutani Chemical Industry Co., Ltd.
        • Nerudia (South Korea)
        • Neuland Laboratories Ltd.
        • Bachem Holding AG
        • Blue California
        • Manus Bio
        • Sweegen
        • Conagen Inc.
        • Zhongke New Life Biotechnology (China)
    • Assumptions & Acronyms Used
    • Research Methodology

List of Tables

  • Table 1: Global Market Value (USD Million) Forecast by Region, 2020-2035
  • Table 2: Global Market Volume (MT) Forecast by Region, 2020-2035
  • Table 3: Global Market Value (USD Million) Forecast by Peptide Type, 2020-2035
  • Table 4: Global Market Volume (MT) Forecast by Peptide Type, 2020-2035
  • Table 5: Global Market Value (USD Million) Forecast by Source, 2020-2035
  • Table 6: Global Market Volume (MT) Forecast by Source, 2020-2035
  • Table 7: Global Market Value (USD Million) Forecast by Application, 2020-2035
  • Table 8: Global Market Volume (MT) Forecast by Application, 2020-2035
  • Table 9: Global Market Value (USD Million) Forecast by Formulation Type, 2020-2035
  • Table 10: Global Market Volume (MT) Forecast by Formulation Type, 2020-2035
  • Table 11: Global Market Value (USD Million) Forecast by Sales Channel, 2020-2035
  • Table 12: Global Market Volume (MT) Forecast by Sales Channel, 2020-2035
  • Table 13: Global Market Value (USD Million) Forecast by End User, 2020-2035
  • Table 14: Global Market Volume (MT) Forecast by End User, 2020-2035
  • Table 15: North America Market Value (USD Million) Forecast by Country, 2020-2035
  • Table 16: North America Market Volume (MT) Forecast by Country, 2020-2035
  • Table 17: North America Market Value (USD Million) Forecast by Peptide Type, 2020-2035
  • Table 18: North America Market Volume (MT) Forecast by Peptide Type, 2020-2035
  • Table 19: North America Market Value (USD Million) Forecast by Source, 2020-2035
  • Table 20: North America Market Volume (MT) Forecast by Source, 2020-2035
  • Table 21: North America Market Value (USD Million) Forecast by Application, 2020-2035
  • Table 22: North America Market Volume (MT) Forecast by Application, 2020-2035
  • Table 23: North America Market Value (USD Million) Forecast by Formulation Type, 2020-2035
  • Table 24: North America Market Volume (MT) Forecast by Formulation Type, 2020-2035
  • Table 25: North America Market Value (USD Million) Forecast by Sales Channel, 2020-2035
  • Table 26: North America Market Volume (MT) Forecast by Sales Channel, 2020-2035
  • Table 27: North America Market Value (USD Million) Forecast by End User, 2020-2035
  • Table 28: North America Market Volume (MT) Forecast by End User, 2020-2035
  • Table 29: Latin America Market Value (USD Million) Forecast by Country, 2020-2035
  • Table 30: Latin America Market Volume (MT) Forecast by Country, 2020-2035
  • Table 31: Latin America Market Value (USD Million) Forecast by Peptide Type, 2020-2035
  • Table 32: Latin America Market Volume (MT) Forecast by Peptide Type, 2020-2035
  • Table 33: Latin America Market Value (USD Million) Forecast by Source, 2020-2035
  • Table 34: Latin America Market Volume (MT) Forecast by Source, 2020-2035
  • Table 35: Latin America Market Value (USD Million) Forecast by Application, 2020-2035
  • Table 36: Latin America Market Volume (MT) Forecast by Application, 2020-2035
  • Table 37: Latin America Market Value (USD Million) Forecast by Formulation Type, 2020-2035
  • Table 38: Latin America Market Volume (MT) Forecast by Formulation Type, 2020-2035
  • Table 39: Latin America Market Value (USD Million) Forecast by Sales Channel, 2020-2035
  • Table 40: Latin America Market Volume (MT) Forecast by Sales Channel, 2020-2035
  • Table 41: Latin America Market Value (USD Million) Forecast by End User, 2020-2035
  • Table 42: Latin America Market Volume (MT) Forecast by End User, 2020-2035
  • Table 43: Europe Market Value (USD Million) Forecast by Country, 2020-2035
  • Table 44: Europe Market Volume (MT) Forecast by Country, 2020-2035
  • Table 45: Europe Market Value (USD Million) Forecast by Peptide Type, 2020-2035
  • Table 46: Europe Market Volume (MT) Forecast by Peptide Type, 2020-2035
  • Table 47: Europe Market Value (USD Million) Forecast by Source, 2020-2035
  • Table 48: Europe Market Volume (MT) Forecast by Source, 2020-2035
  • Table 49: Europe Market Value (USD Million) Forecast by Application, 2020-2035
  • Table 50: Europe Market Volume (MT) Forecast by Application, 2020-2035
  • Table 51: Europe Market Value (USD Million) Forecast by Formulation Type, 2020-2035
  • Table 52: Europe Market Volume (MT) Forecast by Formulation Type, 2020-2035
  • Table 53: Europe Market Value (USD Million) Forecast by Sales Channel, 2020-2035
  • Table 54: Europe Market Volume (MT) Forecast by Sales Channel, 2020-2035
  • Table 55: Europe Market Value (USD Million) Forecast by End User, 2020-2035
  • Table 56: Europe Market Volume (MT) Forecast by End User, 2020-2035
  • Table 57: East Asia Market Value (USD Million) Forecast by Country, 2020-2035
  • Table 58: East Asia Market Volume (MT) Forecast by Country, 2020-2035
  • Table 59: East Asia Market Value (USD Million) Forecast by Peptide Type, 2020-2035
  • Table 60: East Asia Market Volume (MT) Forecast by Peptide Type, 2020-2035
  • Table 61: East Asia Market Value (USD Million) Forecast by Source, 2020-2035
  • Table 62: East Asia Market Volume (MT) Forecast by Source, 2020-2035
  • Table 63: East Asia Market Value (USD Million) Forecast by Application, 2020-2035
  • Table 64: East Asia Market Volume (MT) Forecast by Application, 2020-2035
  • Table 65: East Asia Market Value (USD Million) Forecast by Formulation Type, 2020-2035
  • Table 66: East Asia Market Volume (MT) Forecast by Formulation Type, 2020-2035
  • Table 67: East Asia Market Value (USD Million) Forecast by Sales Channel, 2020-2035
  • Table 68: East Asia Market Volume (MT) Forecast by Sales Channel, 2020-2035
  • Table 69: East Asia Market Value (USD Million) Forecast by End User, 2020-2035
  • Table 70: East Asia Market Volume (MT) Forecast by End User, 2020-2035
  • Table 71: South Asia & Pacific Market Value (USD Million) Forecast by Country, 2020-2035
  • Table 72: South Asia & Pacific Market Volume (MT) Forecast by Country, 2020-2035
  • Table 73: South Asia & Pacific Market Value (USD Million) Forecast by Peptide Type, 2020-2035
  • Table 74: South Asia & Pacific Market Volume (MT) Forecast by Peptide Type, 2020-2035
  • Table 75: South Asia & Pacific Market Value (USD Million) Forecast by Source, 2020-2035
  • Table 76: South Asia & Pacific Market Volume (MT) Forecast by Source, 2020-2035
  • Table 77: South Asia & Pacific Market Value (USD Million) Forecast by Application, 2020-2035
  • Table 78: South Asia & Pacific Market Volume (MT) Forecast by Application, 2020-2035
  • Table 79: South Asia & Pacific Market Value (USD Million) Forecast by Formulation Type, 2020-2035
  • Table 80: South Asia & Pacific Market Volume (MT) Forecast by Formulation Type, 2020-2035
  • Table 81: South Asia & Pacific Market Value (USD Million) Forecast by Sales Channel, 2020-2035
  • Table 82: South Asia & Pacific Market Volume (MT) Forecast by Sales Channel, 2020-2035
  • Table 83: South Asia & Pacific Market Value (USD Million) Forecast by End User, 2020-2035
  • Table 84: South Asia & Pacific Market Volume (MT) Forecast by End User, 2020-2035
  • Table 85: Middle East and Africa Market Value (USD Million) Forecast by Country, 2020-2035
  • Table 86: Middle East and Africa Market Volume (MT) Forecast by Country, 2020-2035
  • Table 87: Middle East and Africa Market Value (USD Million) Forecast by Peptide Type, 2020-2035
  • Table 88: Middle East and Africa Market Volume (MT) Forecast by Peptide Type, 2020-2035
  • Table 89: Middle East and Africa Market Value (USD Million) Forecast by Source, 2020-2035
  • Table 90: Middle East and Africa Market Volume (MT) Forecast by Source, 2020-2035
  • Table 91: Middle East and Africa Market Value (USD Million) Forecast by Application, 2020-2035
  • Table 92: Middle East and Africa Market Volume (MT) Forecast by Application, 2020-2035
  • Table 93: Middle East and Africa Market Value (USD Million) Forecast by Formulation Type, 2020-2035
  • Table 94: Middle East and Africa Market Volume (MT) Forecast by Formulation Type, 2020-2035
  • Table 95: Middle East and Africa Market Value (USD Million) Forecast by Sales Channel, 2020-2035
  • Table 96: Middle East and Africa Market Volume (MT) Forecast by Sales Channel, 2020-2035
  • Table 97: Middle East and Africa Market Value (USD Million) Forecast by End User, 2020-2035
  • Table 98: Middle East and Africa Market Volume (MT) Forecast by End User, 2020-2035

List of Figures

  • Figure 1: Global Market Volume (MT) Forecast 2020-2035
  • Figure 2: Global Market Pricing Analysis
  • Figure 3: Global Market Value (USD Million) Forecast 2020-2035
  • Figure 4: Global Market Value Share and BPS Analysis by Peptide Type, 2025 and 2035
  • Figure 5: Global Market Y-o-Y Growth Comparison by Peptide Type, 2025-2035
  • Figure 6: Global Market Attractiveness Analysis by Peptide Type
  • Figure 7: Global Market Value Share and BPS Analysis by Source, 2025 and 2035
  • Figure 8: Global Market Y-o-Y Growth Comparison by Source, 2025-2035
  • Figure 9: Global Market Attractiveness Analysis by Source
  • Figure 10: Global Market Value Share and BPS Analysis by Application, 2025 and 2035
  • Figure 11: Global Market Y-o-Y Growth Comparison by Application, 2025-2035
  • Figure 12: Global Market Attractiveness Analysis by Application
  • Figure 13: Global Market Value Share and BPS Analysis by Formulation Type, 2025 and 2035
  • Figure 14: Global Market Y-o-Y Growth Comparison by Formulation Type, 2025-2035
  • Figure 15: Global Market Attractiveness Analysis by Formulation Type
  • Figure 16: Global Market Value Share and BPS Analysis by Sales Channel, 2025 and 2035
  • Figure 17: Global Market Y-o-Y Growth Comparison by Sales Channel, 2025-2035
  • Figure 18: Global Market Attractiveness Analysis by Sales Channel
  • Figure 19: Global Market Value Share and BPS Analysis by End User, 2025 and 2035
  • Figure 20: Global Market Y-o-Y Growth Comparison by End User, 2025-2035
  • Figure 21: Global Market Attractiveness Analysis by End User
  • Figure 22: Global Market Value (USD Million) Share and BPS Analysis by Region, 2025 and 2035
  • Figure 23: Global Market Y-o-Y Growth Comparison by Region, 2025-2035
  • Figure 24: Global Market Attractiveness Analysis by Region
  • Figure 25: North America Market Incremental $ Opportunity, 2025-2035
  • Figure 26: Latin America Market Incremental $ Opportunity, 2025-2035
  • Figure 27: Europe Market Incremental $ Opportunity, 2025-2035
  • Figure 28: East Asia Market Incremental $ Opportunity, 2025-2035
  • Figure 29: South Asia & Pacific Market Incremental $ Opportunity, 2025-2035
  • Figure 30: Middle East and Africa Market Incremental $ Opportunity, 2025-2035
  • Figure 31: North America Market Value Share and BPS Analysis by Country, 2025 and 2035
  • Figure 32: North America Market Value Share and BPS Analysis by Peptide Type, 2025 and 2035
  • Figure 33: North America Market Y-o-Y Growth Comparison by Peptide Type, 2025-2035
  • Figure 34: North America Market Attractiveness Analysis by Peptide Type
  • Figure 35: North America Market Value Share and BPS Analysis by Source, 2025 and 2035
  • Figure 36: North America Market Y-o-Y Growth Comparison by Source, 2025-2035
  • Figure 37: North America Market Attractiveness Analysis by Source
  • Figure 38: North America Market Value Share and BPS Analysis by Application, 2025 and 2035
  • Figure 39: North America Market Y-o-Y Growth Comparison by Application, 2025-2035
  • Figure 40: North America Market Attractiveness Analysis by Application
  • Figure 41: North America Market Value Share and BPS Analysis by Formulation Type, 2025 and 2035
  • Figure 42: North America Market Y-o-Y Growth Comparison by Formulation Type, 2025-2035
  • Figure 43: North America Market Attractiveness Analysis by Formulation Type
  • Figure 44: North America Market Value Share and BPS Analysis by Sales Channel, 2025 and 2035
  • Figure 45: North America Market Y-o-Y Growth Comparison by Sales Channel, 2025-2035
  • Figure 46: North America Market Attractiveness Analysis by Sales Channel
  • Figure 47: North America Market Value Share and BPS Analysis by End User, 2025 and 2035
  • Figure 48: North America Market Y-o-Y Growth Comparison by End User, 2025-2035
  • Figure 49: North America Market Attractiveness Analysis by End User
  • Figure 50: Latin America Market Value Share and BPS Analysis by Country, 2025 and 2035
  • Figure 51: Latin America Market Value Share and BPS Analysis by Peptide Type, 2025 and 2035
  • Figure 52: Latin America Market Y-o-Y Growth Comparison by Peptide Type, 2025-2035
  • Figure 53: Latin America Market Attractiveness Analysis by Peptide Type
  • Figure 54: Latin America Market Value Share and BPS Analysis by Source, 2025 and 2035
  • Figure 55: Latin America Market Y-o-Y Growth Comparison by Source, 2025-2035
  • Figure 56: Latin America Market Attractiveness Analysis by Source
  • Figure 57: Latin America Market Value Share and BPS Analysis by Application, 2025 and 2035
  • Figure 58: Latin America Market Y-o-Y Growth Comparison by Application, 2025-2035
  • Figure 59: Latin America Market Attractiveness Analysis by Application
  • Figure 60: Latin America Market Value Share and BPS Analysis by Formulation Type, 2025 and 2035
  • Figure 61: Latin America Market Y-o-Y Growth Comparison by Formulation Type, 2025-2035
  • Figure 62: Latin America Market Attractiveness Analysis by Formulation Type
  • Figure 63: Latin America Market Value Share and BPS Analysis by Sales Channel, 2025 and 2035
  • Figure 64: Latin America Market Y-o-Y Growth Comparison by Sales Channel, 2025-2035
  • Figure 65: Latin America Market Attractiveness Analysis by Sales Channel
  • Figure 66: Latin America Market Value Share and BPS Analysis by End User, 2025 and 2035
  • Figure 67: Latin America Market Y-o-Y Growth Comparison by End User, 2025-2035
  • Figure 68: Latin America Market Attractiveness Analysis by End User
  • Figure 69: Europe Market Value Share and BPS Analysis by Country, 2025 and 2035
  • Figure 70: Europe Market Value Share and BPS Analysis by Peptide Type, 2025 and 2035
  • Figure 71: Europe Market Y-o-Y Growth Comparison by Peptide Type, 2025-2035
  • Figure 72: Europe Market Attractiveness Analysis by Peptide Type
  • Figure 73: Europe Market Value Share and BPS Analysis by Source, 2025 and 2035
  • Figure 74: Europe Market Y-o-Y Growth Comparison by Source, 2025-2035
  • Figure 75: Europe Market Attractiveness Analysis by Source
  • Figure 76: Europe Market Value Share and BPS Analysis by Application, 2025 and 2035
  • Figure 77: Europe Market Y-o-Y Growth Comparison by Application, 2025-2035
  • Figure 78: Europe Market Attractiveness Analysis by Application
  • Figure 79: Europe Market Value Share and BPS Analysis by Formulation Type, 2025 and 2035
  • Figure 80: Europe Market Y-o-Y Growth Comparison by Formulation Type, 2025-2035
  • Figure 81: Europe Market Attractiveness Analysis by Formulation Type
  • Figure 82: Europe Market Value Share and BPS Analysis by Sales Channel, 2025 and 2035
  • Figure 83: Europe Market Y-o-Y Growth Comparison by Sales Channel, 2025-2035
  • Figure 84: Europe Market Attractiveness Analysis by Sales Channel
  • Figure 85: Europe Market Value Share and BPS Analysis by End User, 2025 and 2035
  • Figure 86: Europe Market Y-o-Y Growth Comparison by End User, 2025-2035
  • Figure 87: Europe Market Attractiveness Analysis by End User
  • Figure 88: East Asia Market Value Share and BPS Analysis by Country, 2025 and 2035
  • Figure 89: East Asia Market Value Share and BPS Analysis by Peptide Type, 2025 and 2035
  • Figure 90: East Asia Market Y-o-Y Growth Comparison by Peptide Type, 2025-2035
  • Figure 91: East Asia Market Attractiveness Analysis by Peptide Type
  • Figure 92: East Asia Market Value Share and BPS Analysis by Source, 2025 and 2035
  • Figure 93: East Asia Market Y-o-Y Growth Comparison by Source, 2025-2035
  • Figure 94: East Asia Market Attractiveness Analysis by Source
  • Figure 95: East Asia Market Value Share and BPS Analysis by Application, 2025 and 2035
  • Figure 96: East Asia Market Y-o-Y Growth Comparison by Application, 2025-2035
  • Figure 97: East Asia Market Attractiveness Analysis by Application
  • Figure 98: East Asia Market Value Share and BPS Analysis by Formulation Type, 2025 and 2035
  • Figure 99: East Asia Market Y-o-Y Growth Comparison by Formulation Type, 2025-2035
  • Figure 100: East Asia Market Attractiveness Analysis by Formulation Type
  • Figure 101: East Asia Market Value Share and BPS Analysis by Sales Channel, 2025 and 2035
  • Figure 102: East Asia Market Y-o-Y Growth Comparison by Sales Channel, 2025-2035
  • Figure 103: East Asia Market Attractiveness Analysis by Sales Channel
  • Figure 104: East Asia Market Value Share and BPS Analysis by End User, 2025 and 2035
  • Figure 105: East Asia Market Y-o-Y Growth Comparison by End User, 2025-2035
  • Figure 106: East Asia Market Attractiveness Analysis by End User
  • Figure 107: South Asia & Pacific Market Value Share and BPS Analysis by Country, 2025 and 2035
  • Figure 108: South Asia & Pacific Market Value Share and BPS Analysis by Peptide Type, 2025 and 2035
  • Figure 109: South Asia & Pacific Market Y-o-Y Growth Comparison by Peptide Type, 2025-2035
  • Figure 110: South Asia & Pacific Market Attractiveness Analysis by Peptide Type
  • Figure 111: South Asia & Pacific Market Value Share and BPS Analysis by Source, 2025 and 2035
  • Figure 112: South Asia & Pacific Market Y-o-Y Growth Comparison by Source, 2025-2035
  • Figure 113: South Asia & Pacific Market Attractiveness Analysis by Source
  • Figure 114: South Asia & Pacific Market Value Share and BPS Analysis by Application, 2025 and 2035
  • Figure 115: South Asia & Pacific Market Y-o-Y Growth Comparison by Application, 2025-2035
  • Figure 116: South Asia & Pacific Market Attractiveness Analysis by Application
  • Figure 117: South Asia & Pacific Market Value Share and BPS Analysis by Formulation Type, 2025 and 2035
  • Figure 118: South Asia & Pacific Market Y-o-Y Growth Comparison by Formulation Type, 2025-2035
  • Figure 119: South Asia & Pacific Market Attractiveness Analysis by Formulation Type
  • Figure 120: South Asia & Pacific Market Value Share and BPS Analysis by Sales Channel, 2025 and 2035
  • Figure 121: South Asia & Pacific Market Y-o-Y Growth Comparison by Sales Channel, 2025-2035
  • Figure 122: South Asia & Pacific Market Attractiveness Analysis by Sales Channel
  • Figure 123: South Asia & Pacific Market Value Share and BPS Analysis by End User, 2025 and 2035
  • Figure 124: South Asia & Pacific Market Y-o-Y Growth Comparison by End User, 2025-2035
  • Figure 125: South Asia & Pacific Market Attractiveness Analysis by End User
  • Figure 126: Middle East and Africa Market Value Share and BPS Analysis by Country, 2025 and 2035
  • Figure 127: Middle East and Africa Market Value Share and BPS Analysis by Peptide Type, 2025 and 2035
  • Figure 128: Middle East and Africa Market Y-o-Y Growth Comparison by Peptide Type, 2025-2035
  • Figure 129: Middle East and Africa Market Attractiveness Analysis by Peptide Type
  • Figure 130: Middle East and Africa Market Value Share and BPS Analysis by Source, 2025 and 2035
  • Figure 131: Middle East and Africa Market Y-o-Y Growth Comparison by Source, 2025-2035
  • Figure 132: Middle East and Africa Market Attractiveness Analysis by Source
  • Figure 133: Middle East and Africa Market Value Share and BPS Analysis by Application, 2025 and 2035
  • Figure 134: Middle East and Africa Market Y-o-Y Growth Comparison by Application, 2025-2035
  • Figure 135: Middle East and Africa Market Attractiveness Analysis by Application
  • Figure 136: Middle East and Africa Market Value Share and BPS Analysis by Formulation Type, 2025 and 2035
  • Figure 137: Middle East and Africa Market Y-o-Y Growth Comparison by Formulation Type, 2025-2035
  • Figure 138: Middle East and Africa Market Attractiveness Analysis by Formulation Type
  • Figure 139: Middle East and Africa Market Value Share and BPS Analysis by Sales Channel, 2025 and 2035
  • Figure 140: Middle East and Africa Market Y-o-Y Growth Comparison by Sales Channel, 2025-2035
  • Figure 141: Middle East and Africa Market Attractiveness Analysis by Sales Channel
  • Figure 142: Middle East and Africa Market Value Share and BPS Analysis by End User, 2025 and 2035
  • Figure 143: Middle East and Africa Market Y-o-Y Growth Comparison by End User, 2025-2035
  • Figure 144: Middle East and Africa Market Attractiveness Analysis by End User
  • Figure 145: Global Market - Tier Structure Analysis
  • Figure 146: Global Market - Company Share Analysis

Frequently Asked Questions

How big is the Peptide-based Sweetener in 2025?

The global Peptide-based Sweetener is estimated to be valued at USD 935.6 million in 2025.

What will be the size of Peptide-based Sweetener in 2035?

The market size for the Peptide-based Sweetener is projected to reach USD 1,667.3 million by 2035.

How much will be the Peptide-based Sweetener growth between 2025 and 2035?

The Peptide-based Sweetener is expected to grow at a 5.9% CAGR between 2025 and 2035.

What are the key peptide type in the Peptide-based Sweetener?

The key peptide types in the market include sweet-tasting peptides, taste-modulating peptides, sweetness enhancer peptides, natural Peptide-based Sweeteners, and synthetic Peptide-based Sweeteners.

Which peptide sourcesegment to contribute significant share in the Peptide-based Sweetener in 2025?

In terms of peptide source, the “Microbial and fermentation-derived peptides are forecasted to contribute 40% of market share in 2025, driven by lower production cost, high purity, and strategic investments by firms like Conagen and Ajinomoto in Asia-Pacific biomanufacturing hubs (Sweegen 2024 Corporate Report).

Explore Similar Insights

Future Market Insights

Peptide-based Sweeteners Market