Low-Calorie Sweeteners Market Size and Share Forecast Outlook 2025 to 2035

The global low-calorie sweeteners market is expected to grow from USD 32.9 billion in 2025 to USD 52.1 billion by 2035, reflecting a CAGR of 4.7%. As rates of obesity, diabetes, hypertension, and metabolic disorders climb globally, consumers and manufacturers alike are seeking strategies to reduce sugar intake.
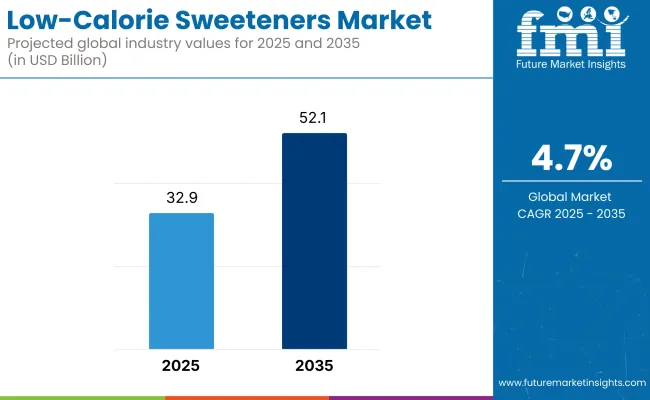
Quick Stats of Low-Calorie Sweeteners Market

  • Market Value (2025): USD 32.9 billion
  • Forecast Value (2035): USD 52.1 billion
  • Forecast CAGR: 4.7%
  • Type Leader in 2025: Stevia (38.5% market share)
  • Top Application Segment: Food & Beverages (52.7% share)
  • Key Growth Region: Asia Pacific (India fastest-growing market with a 5.9% CAGR)
Attributes Description
Estimated Global Low-Calorie Sweeteners Market Size (2025E) USD 32.9 billion
Projected Global Low-Calorie Sweeteners Market Value (2035F) USD 52.1 billion
Value-based CAGR (2025 to 2035) 4.7%

Low-calorie sweeteners provide sweetness with little to no caloric contribution, offering an appealing option. Research shows that replacing sugar with sweeteners like aspartame and sucralose can lower overall calorie intake and support weight management, making them a key tool for health-conscious consumers.

Governments around the world have imposed sugar taxes and set guidelines to lower added sugar in processed foods.This has created a strong incentive for food and beverage producers to reformulate their products using low-calorie alternatives. Manufacturers are integrating sweeteners into sodas, confectionery, bakery items, dairy products, and even oral care goods expanding their placement across categories.

Innovations in sweetener formulations have significantly improved taste profiles and stability. Blended sweeteners mimic sugar’s sensory characteristics more effectively, reducing bitter aftertastes associated with earlier-generation sweeteners. Heat-stable options like sucralose are now suitable for baked products, while naturally derived sweeteners like stevia and monk fruit continue gaining traction due to clean-label trends.

On the basis of type, the stevia segment holds 38.5% share. In terms of application, the food & beverages segment accounts for 52.7% share. The Indian low-calorie sweeteners market is set to grow at 5.9% CAGR during the study period.

Semi-Annual Market Update

Following graph illustrates comparative analysis of variation of CAGR from base year (2024) to current year (2025) in global low-calorie sweetener market. In this report, realization trends of revenues are compared, which help track variation in the performance of the market for stakeholders.

Particular Value CAGR
H1(2024 to 2034) 4.3%
H2(2024 to 2034) 4.5%
H1(2025 to 2035) 4.6%
H2(2025 to 2035) 4.7%

In H1 of the forecast period (2025 to 2035), the market will expand at a CAGR of 4.6%, and in H2 of the decade at a CAGR of 4.7%. The charts show consistent growth in the market through increasing industry adoption, and also rising R&D expenditure to create advanced low-calorie sweetener products.

Global Low-Calorie Sweetener Market will keep growing with expanding awareness towards wellness, government efforts to counter declining sugar intake, and expanding use in foods, beverages, and drugs. As consumers increasingly prefer plant-based sweeteners and clean labels, business operators will have to switch to new prospects in both as well as product reformulation.

Companies with emphasis on sustainable sourcing, flavor creation, and functional blending of ingredients will likely be best suited to capitalize on future market trends.

Analyzing Low-calorie Sweeteners Market by Top Investment Segments

The low-calorie sweeteners market is segmented by type into stevia, aspartame, neotame, advantame, sucralose, saccharin, and acesulfame potassium. By source, the market includes natural and artificial sweeteners. Based on application, it covers food and beverages, bakery products, oral care products, dairy products, sauces, soft drinks, and pharmaceuticals.

Regionally, the market is divided into North America, Latin America, Western Europe, Eastern Europe, East Asia, South Asia & Pacific, Central Asia, Russia and Belarus, Balkan & Baltic Countries, and Middle East and Africa.
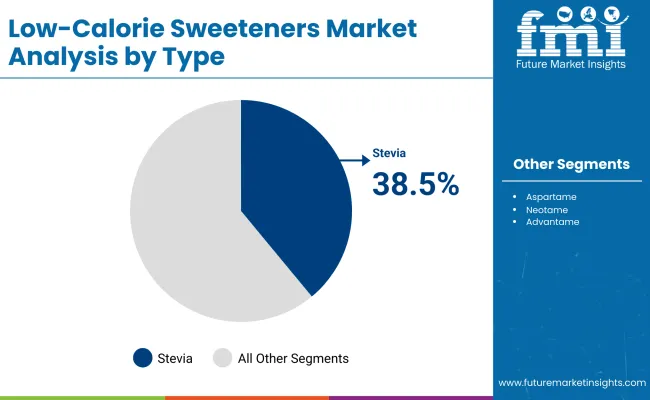
By Type, Stevia Segment Leads with 38.5% Share

In terms of type, the stevia segment accounts for 38.5% share. Stevia is widely sold due to its natural origin, zero-calorie content, and alignment with modern consumer preferences for clean-label, plant-based, and health-conscious products.

Derived from the leaves of the Stevia rebaudiana plant, it offers a sweet taste that is 200-300 times sweeter than sugar, allowing for minimal usage while delivering a comparable flavor profile. This makes it a preferred sugar substitute for those aiming to reduce calorie intake or manage conditions such as obesity, diabetes, or metabolic syndrome.
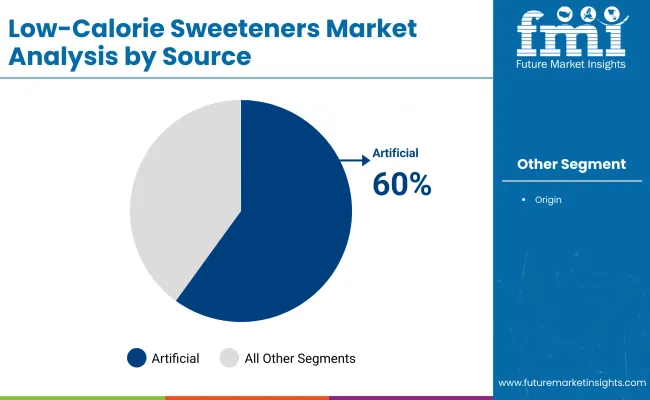
Based on Source, Artificial Segment Leads with 60% Share

The artificial segment occupies 60% share due to their low production costs, intense sweetness (requiring minimal quantities), and high heat stability. These attributes make them ideal for large-scale use in beverages, bakery products, processed foods, and pharmaceuticals where cost and performance are critical.

Artificial sweeteners have been widely approved and used for decades by regulatory bodies like the USA, FDA, EFSA, and WHO, which has led to strong market confidence among manufacturers. Their presence in diet sodas, sugar-free gum, protein powders, and diabetic formulations has established a deep-rooted supply chain advantage and brand familiarity.
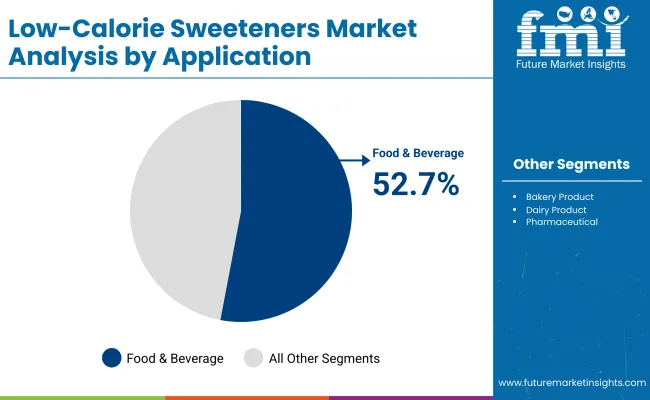
By Application, Food & Beverages Segment Registers 52.7% Share

The food & beverages segment accounts for 52.7% share. Low-calorie sweeteners are widely used in the food and beverages industry due to their ability to provide sweetness without the caloric load of traditional sugar. This makes them especially valuable in a time when consumers are increasingly conscious of their sugar intake, calorie consumption, and overall health.

Rising concerns about obesity, diabetes, and metabolic disorders have driven food and beverage manufacturers to reformulate products with reduced or zero added sugars, making low-calorie sweeteners a critical functional ingredient.

Market Concentration

The organised portion comprises of large global food ingredient companies and health and wellness brands, as well specialty chemicals-based companies that produce a wide range of low-calorie sweeteners (e.g., aspartame, stevia, sucralose, acesulfame K, and monk fruit).

Some of the major key players of this segment are Cargill, Tate & Lyle, Ingredion, PureCircle (a NBTY subsidiary), and DuPont. Due to their advancements in production technology, research and development, and distribution networks, these companies have the most powerful position on the market.

The organized players cater into sugar substitutes which are clean label, plant-based, non-genetically modified organism (non-GMO) and excludes artificial additives, capitalizing on heightened consumer consciousness around clean label and health products. They also devote resources to improving taste profile and mixing ratios of sweeteners to get them closer to sugar in terms of sweetness, texture and mouthfeel.

High demand for dietary, sugar-free, and low-calorie products due to the rising health concerns, such as diabetes, obesity, and cardiovascular diseases, in North America, Europe, and Asia-Pacific keeps the organised market robust in these regions.

The unorganised segment comprises of small-scale sweetener producers, regional and domestic suppliers and manufacturers of basic or traditional low-calorie sweeteners to local markets. Many of those companies focus on raw, unrefined or lower-cost sweetening agents, like honey, maple syrup and agave nectar, which less calories per serving than mainstream sugar but are not necessarily trump cards as low-calorie in relation to synthetic or heavily processed sweeteners.

Unorganised players have presence in developing regions, such as Asia, Latin America and parts of Africa, where price-sensitive consumers and small food manufacturers opt for attractive sweeteners. It is not without its challenges, though; producers must contend with constant growth, product consistency, regulatory compliance and more, yet many provide locally sourced and niche offerings that are appealing to the consumer on the lookout for a more natural or artisanal product.
Country-wise Insights

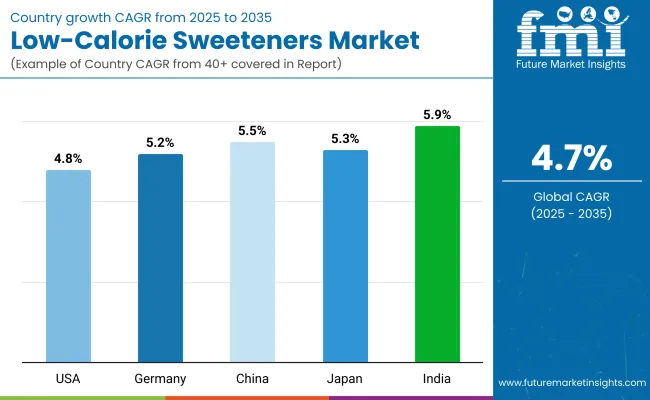
The low-calorie sweeteners market is projected to grow steadily from 2025 to 2035 across major countries. India leads with the highest CAGR of 5.9%, driven by increasing health awareness and demand for sugar alternatives. China follows closely with a CAGR of 5.5%, reflecting strong industrial and consumer adoption.

Germany and Japan show similar growth rates of 5.2% and 5.3% respectively, indicating stable market expansion in developed regions. The USA records a slightly lower CAGR of 4.8%, suggesting a more mature but still growing market. Overall, all countries demonstrate positive growth, with emerging markets showing slightly higher momentum.

Country CAGR 2025 to 2035
USA 4.8%
Germany 5.2%
China 5.5%
Japan 5.3%
India 5.9%

USA: Health-Conscious Consumers and Regulatory Approvals Driving Growth

Key driving factors for the USA low-calorie sweeteners market are increasing obesity rates, rising health consciousness, and stringent regulations by the FDA related to the sugar content in food products. Consumers are turning to stevia and monk fruit, natural alternatives, with a clean-label focus.

Longtime food and beverage brands, like Pepsi, have been reformulating their products to replace traditional sugar with sweeteners - including sucralose, aspartame and acesulfame potassium - to replicate the sweet taste while contributing far fewer calories. In addition, government efforts to encourage sugar-free products and impose sugar taxes have accelerated the adoption of artificial and natural sweeteners.

China: Curb your hunger: Rising cases of diabetes and fast urbanization boosts demand

They are also driving the demand for low-calorie sweeteners market in China due to increasing prevalence of obesity & diabetes, increasing income levels along with urbanization. Increasing demand for glucose alternatives in beverages, dairy, and baked goods is spurring preference for healthy dietary options.

To promote the healthy diet, the Chinese Government has released the dietary guidelines to suggest a reduction in sugar, thus boosting the usage of stevia, sucralose and saccharin in food formulations. Moreover, the increasing need for low-calorie sweeteners due to the rapid growth of the functional beverages and sports drink industry is further driving the market growth.

Regulatory backing and increased natural sweetener demand in Germany

Strong consumer inclination towards organic and natural ingredients is driving the low-calorie sweeteners market in Germany. With strict European Union regulations restricting artificial sweeteners, natural sugar alternatives including stevia and monk fruit are widely used.

The acceptance of diabetic-friendly and ketogenic diets in Germany has boosted the demand for low-calorie sweeteners with emphasis on baked items, beverages as well as dairy products. The market is also being shaped by heavy investments in innovative plant-based sweeteners and sustainable packaging.

India: The food Industry has a growing awareness and expansion

India's low-calorie sweeteners market is witnessing tremendous growth owing to increasing urbanization, growing disposable incomes, and rising awareness regarding health hazards linked with high sugar consumption. The high demand for low-calorie sweeteners is majorly in soft drinks, dairy products, and bakery items as consumers are inclining themselves towards healthy eating options.

Indian government promoting sugar reduction policies and leading food companies are actively launching stevia & sucralose based product range. Moreover, the increasing availability of low-calorie sweeteners in online and retail stores is enhancing reach and market penetration.

Leading Low-calorie Sweetener Suppliers

The low-calorie sweeteners market is moderately consolidated, dominated by a few global giants with substantial production and R&D capabilities. Companies like Tate and Lyle, Archer Daniels Midland, Cargill Inc., and Ingredion Inc. lead the market with a broad range of sweeteners, from stevia and sucralose to artificial sweeteners, targeting food, beverage, and dietary supplement industries.

Nestlé S.A. and Ajinomoto Co., Inc. leverage their strong consumer brands to integrate low-calorie sweeteners into a variety of products. I. du Pont de Nemours and Company, Celanese Corporation, and NutraSweet contribute specialized innovations, while Foodchem International focuses on supply chain and cost-effective solutions. The presence of a few major players alongside smaller innovators keeps the market competitive but not fully consolidated.

Leading Brands

  • Tate and Lyle
  • Archer Daniels Midland
  • I. du Pont de Nemours and Company
  • Cargill Inc.
  • Nestle S.A.
  • Ajinomoto Co., Inc.
  • Foodchem International Corporation
  • Ingredion Inc.
  • Celanese Corporation
  • NutraSweet
  • Sudzucker AG
  • Symrise AG
  • Mitsui Sugars Co., Ltd
  • Others (on additional request)

Key Segmentation

By Type:

The market includes various sweeteners such as Stevia, Aspartame, Neotame, Advantame, Sucralose, Saccharin, and Acesulfame Potassium, catering to different taste preferences and dietary needs.

By Source:

These sweeteners are classified as naturalor artificial, depending on their origin and processing methods.

By Application:

They are widely used in food and beverages, bakery products, oral care products, dairy products, sauces, soft drinks, and pharmaceuticals, serving as sugar substitutes for health-conscious consumers.

By Region:

The market is segmented as North America, Latin America, Western Europe, Eastern Europe, East Asia, South Asia & Pacific, Central Asia, Russia and Belarus, Balkan & Baltic Countries, Middle East and Africa.

Table of Content

  1. Executive Summary
  2. Industry Introduction, including Taxonomy and Market Definition
  3. Trends and Success Factors, including Macro-economic Factors, Market Dynamics, and Recent Industry Developments
  4. Global Market Demand Analysis 2020 to 2024 and Forecast 2025 to 2035, including Historical Analysis and Future Projections
  5. Pricing Analysis
  6. Global Market Analysis 2020 to 2024 and Forecast 2025 to 2035
    • Type
    • Source
    • Application
  7. By Type
    • Stevia
    • Aspartame
    • Neotame
    • Advantame
    • Sucralose
    • Saccharin
    • Acesulfame Potassium
  8. By Source
    • Natural
    • Artificial
  9. By Application
    • Food and Beverages
    • Bakery Products
    • Oral Care Products
    • Dairy Products
    • Sauces
    • Soft Drinks
    • Pharmaceuticals
  10. By Region
    • North America
    • Latin America
    • Western Europe
    • Eastern Europe
    • East Asia
    • South Asia & Pacific
    • Central Asia
    • Russia and Belarus
    • Balkan & Baltic Countries
    • Middle East and Africa
  11. North America Sales Analysis 2020 to 2024 and Forecast 2025 to 2035, by Key Segments and Countries
  12. Latin America Sales Analysis 2020 to 2024 and Forecast 2025 to 2035, by Key Segments and Countries
  13. Western Europe Sales Analysis 2020 to 2024 and Forecast 2025 to 2035, by Key Segments and Countries
  14. Eastern Europe Sales Analysis 2020 to 2024 and Forecast 2025 to 2035, by Key Segments and Countries
  15. East Asia Sales Analysis 2020 to 2024 and Forecast 2025 to 2035, by Key Segments and Countries
  16. South Asia & Pacific Sales Analysis 2020 to 2024 and Forecast 2025 to 2035, by Key Segments and Countries
  17. Central Asia Sales Analysis 2020 to 2024 and Forecast 2025 to 2035, by Key Segments and Countries
  18. Russia and Belarus Sales Analysis 2020 to 2024 and Forecast 2025 to 2035, by Key Segments and Countries
  19. 19 Balkan & Baltic Countries Sales Analysis 2020 to 2024 and Forecast 2025 to 2035, by Key Segments and Countries
  20. 20 Middle East and Africa Sales Analysis 2020 to 2024 and Forecast 2025 to 2035, by Key Segments and Countries
  21. Sales Forecast to 2035 by Type, Source, and Application for 30 Countries
  22. Competitive Assessment, Company Share Analysis by Key Players, and Competition Dashboard
  23. Company Profile
    • Tate and Lyle
    • Archer Daniels Midland
    • I. du Pont de Nemours and Company
    • Cargill Inc.
    • Nestle S.A.
    • Ajinomoto Co., Inc.
    • Foodchem International Corporation
    • Ingredion Inc.
    • Celanese Corporation
    • NutraSweet
    • Other Prominent Market Player

List of Tables

  • Table 1: Global Market Value (USD Million) Forecast by Region, 2020 to 2035
  • Table 2: Global Market Volume (MT) Forecast by Region, 2020 to 2035
  • Table 3: Global Market Value (USD Million) Forecast by Type, 2020 to 2035
  • Table 4: Global Market Volume (MT) Forecast by Type, 2020 to 2035
  • Table 5: Global Market Value (USD Million) Forecast by Source, 2020 to 2035
  • Table 6: Global Market Volume (MT) Forecast by Source, 2020 to 2035
  • Table 7: Global Market Value (USD Million) Forecast by Application, 2020 to 2035
  • Table 8: Global Market Volume (MT) Forecast by Application, 2020 to 2035
  • Table 9: North America Market Value (USD Million) Forecast by Country, 2020 to 2035
  • Table 10: North America Market Volume (MT) Forecast by Country, 2020 to 2035
  • Table 11: North America Market Value (USD Million) Forecast by Type, 2020 to 2035
  • Table 12: North America Market Volume (MT) Forecast by Type, 2020 to 2035
  • Table 13: North America Market Value (USD Million) Forecast by Source, 2020 to 2035
  • Table 14: North America Market Volume (MT) Forecast by Source, 2020 to 2035
  • Table 15: North America Market Value (USD Million) Forecast by Application, 2020 to 2035
  • Table 16: North America Market Volume (MT) Forecast by Application, 2020 to 2035
  • Table 17: Latin America Market Value (USD Million) Forecast by Country, 2020 to 2035
  • Table 18: Latin America Market Volume (MT) Forecast by Country, 2020 to 2035
  • Table 19: Latin America Market Value (USD Million) Forecast by Type, 2020 to 2035
  • Table 20: Latin America Market Volume (MT) Forecast by Type, 2020 to 2035
  • Table 21: Latin America Market Value (USD Million) Forecast by Source, 2020 to 2035
  • Table 22: Latin America Market Volume (MT) Forecast by Source, 2020 to 2035
  • Table 23: Latin America Market Value (USD Million) Forecast by Application, 2020 to 2035
  • Table 24: Latin America Market Volume (MT) Forecast by Application, 2020 to 2035
  • Table 25: Europe Market Value (USD Million) Forecast by Country, 2020 to 2035
  • Table 26: Europe Market Volume (MT) Forecast by Country, 2020 to 2035
  • Table 27: Europe Market Value (USD Million) Forecast by Type, 2020 to 2035
  • Table 28: Europe Market Volume (MT) Forecast by Type, 2020 to 2035
  • Table 29: Europe Market Value (USD Million) Forecast by Source, 2020 to 2035
  • Table 30: Europe Market Volume (MT) Forecast by Source, 2020 to 2035
  • Table 31: Europe Market Value (USD Million) Forecast by Application, 2020 to 2035
  • Table 32: Europe Market Volume (MT) Forecast by Application, 2020 to 2035
  • Table 33: East Asia Market Value (USD Million) Forecast by Country, 2020 to 2035
  • Table 34: East Asia Market Volume (MT) Forecast by Country, 2020 to 2035
  • Table 35: East Asia Market Value (USD Million) Forecast by Type, 2020 to 2035
  • Table 36: East Asia Market Volume (MT) Forecast by Type, 2020 to 2035
  • Table 37: East Asia Market Value (USD Million) Forecast by Source, 2020 to 2035
  • Table 38: East Asia Market Volume (MT) Forecast by Source, 2020 to 2035
  • Table 39: East Asia Market Value (USD Million) Forecast by Application, 2020 to 2035
  • Table 40: East Asia Market Volume (MT) Forecast by Application, 2020 to 2035
  • Table 41: South Asia Market Value (USD Million) Forecast by Country, 2020 to 2035
  • Table 42: South Asia Market Volume (MT) Forecast by Country, 2020 to 2035
  • Table 43: South Asia Market Value (USD Million) Forecast by Type, 2020 to 2035
  • Table 44: South Asia Market Volume (MT) Forecast by Type, 2020 to 2035
  • Table 45: South Asia Market Value (USD Million) Forecast by Source, 2020 to 2035
  • Table 46: South Asia Market Volume (MT) Forecast by Source, 2020 to 2035
  • Table 47: South Asia Market Value (USD Million) Forecast by Application, 2020 to 2035
  • Table 48: South Asia Market Volume (MT) Forecast by Application, 2020 to 2035
  • Table 49: Oceania Market Value (USD Million) Forecast by Country, 2020 to 2035
  • Table 50: Oceania Market Volume (MT) Forecast by Country, 2020 to 2035
  • Table 51: Oceania Market Value (USD Million) Forecast by Type, 2020 to 2035
  • Table 52: Oceania Market Volume (MT) Forecast by Type, 2020 to 2035
  • Table 53: Oceania Market Value (USD Million) Forecast by Source, 2020 to 2035
  • Table 54: Oceania Market Volume (MT) Forecast by Source, 2020 to 2035
  • Table 55: Oceania Market Value (USD Million) Forecast by Application, 2020 to 2035
  • Table 56: Oceania Market Volume (MT) Forecast by Application, 2020 to 2035
  • Table 57: MEA Market Value (USD Million) Forecast by Country, 2020 to 2035
  • Table 58: MEA Market Volume (MT) Forecast by Country, 2020 to 2035
  • Table 59: MEA Market Value (USD Million) Forecast by Type, 2020 to 2035
  • Table 60: MEA Market Volume (MT) Forecast by Type, 2020 to 2035
  • Table 61: MEA Market Value (USD Million) Forecast by Source, 2020 to 2035
  • Table 62: MEA Market Volume (MT) Forecast by Source, 2020 to 2035
  • Table 63: MEA Market Value (USD Million) Forecast by Application, 2020 to 2035
  • Table 64: MEA Market Volume (MT) Forecast by Application, 2020 to 2035

List of Figures

  • Figure 1: Global Market Value (USD Million) by Type, 2025 to 2035
  • Figure 2: Global Market Value (USD Million) by Source, 2025 to 2035
  • Figure 3: Global Market Value (USD Million) by Application, 2025 to 2035
  • Figure 5: Global Market Value (USD Million) by Region, 2025 to 2035
  • Figure 6: Global Market Value (USD Million) Analysis by Region, 2020 to 2035
  • Figure 7: Global Market Volume (MT) Analysis by Region, 2020 to 2035
  • Figure 8: Global Market Value Share (%) and BPS Analysis by Region, 2025 to 2035
  • Figure 9: Global Market Y-o-Y Growth (%) Projections by Region, 2025 to 2035
  • Figure 10: Global Market Value (USD Million) Analysis by Type, 2020 to 2035
  • Figure 11: Global Market Volume (MT) Analysis by Type, 2020 to 2035
  • Figure 12: Global Market Value Share (%) and BPS Analysis by Type, 2025 to 2035
  • Figure 13: Global Market Y-o-Y Growth (%) Projections by Type, 2025 to 2035
  • Figure 14: Global Market Value (USD Million) Analysis by Source, 2020 to 2035
  • Figure 15: Global Market Volume (MT) Analysis by Source, 2020 to 2035
  • Figure 16: Global Market Value Share (%) and BPS Analysis by Source, 2025 to 2035
  • Figure 17: Global Market Y-o-Y Growth (%) Projections by Source, 2025 to 2035
  • Figure 18: Global Market Value (USD Million) Analysis by Application, 2020 to 2035
  • Figure 19: Global Market Volume (MT) Analysis by Application, 2020 to 2035
  • Figure 20: Global Market Value Share (%) and BPS Analysis by Application, 2025 to 2035
  • Figure 21: Global Market Y-o-Y Growth (%) Projections by Application, 2025 to 2035
  • Figure 22: Global Market Attractiveness by Type, 2025 to 2035
  • Figure 23: Global Market Attractiveness by Source, 2025 to 2035
  • Figure 24: Global Market Attractiveness by Application, 2025 to 2035
  • Figure 25: Global Market Attractiveness by Region, 2025 to 2035
  • Figure 26: North America Market Value (USD Million) by Type, 2025 to 2035
  • Figure 27: North America Market Value (USD Million) by Source, 2025 to 2035
  • Figure 28: North America Market Value (USD Million) by Application, 2025 to 2035
  • Figure 29: North America Market Value (USD Million) by Country, 2025 to 2035
  • Figure 30: North America Market Value (USD Million) Analysis by Country, 2020 to 2035
  • Figure 31: North America Market Volume (MT) Analysis by Country, 2020 to 2035
  • Figure 32: North America Market Value Share (%) and BPS Analysis by Country, 2025 to 2035
  • Figure 33: North America Market Y-o-Y Growth (%) Projections by Country, 2025 to 2035
  • Figure 34: North America Market Value (USD Million) Analysis by Type, 2020 to 2035
  • Figure 35: North America Market Volume (MT) Analysis by Type, 2020 to 2035
  • Figure 36: North America Market Value Share (%) and BPS Analysis by Type, 2025 to 2035
  • Figure 37: North America Market Y-o-Y Growth (%) Projections by Type, 2025 to 2035
  • Figure 38: North America Market Value (USD Million) Analysis by Source, 2020 to 2035
  • Figure 39: North America Market Volume (MT) Analysis by Source, 2020 to 2035
  • Figure 40: North America Market Value Share (%) and BPS Analysis by Source, 2025 to 2035
  • Figure 41: North America Market Y-o-Y Growth (%) Projections by Source, 2025 to 2035
  • Figure 42: North America Market Value (USD Million) Analysis by Application, 2020 to 2035
  • Figure 43: North America Market Volume (MT) Analysis by Application, 2020 to 2035
  • Figure 44: North America Market Value Share (%) and BPS Analysis by Application, 2025 to 2035
  • Figure 45: North America Market Y-o-Y Growth (%) Projections by Application, 2025 to 2035
  • Figure 46: North America Market Attractiveness by Type, 2025 to 2035
  • Figure 47: North America Market Attractiveness by Source, 2025 to 2035
  • Figure 48: North America Market Attractiveness by Application, 2025 to 2035
  • Figure 49: North America Market Attractiveness by Country, 2025 to 2035
  • Figure 50: Latin America Market Value (USD Million) by Type, 2025 to 2035
  • Figure 51: Latin America Market Value (USD Million) by Source, 2025 to 2035
  • Figure 52: Latin America Market Value (USD Million) by Application, 2025 to 2035
  • Figure 53: Latin America Market Value (USD Million) by Country, 2025 to 2035
  • Figure 54: Latin America Market Value (USD Million) Analysis by Country, 2020 to 2035
  • Figure 55: Latin America Market Volume (MT) Analysis by Country, 2020 to 2035
  • Figure 56: Latin America Market Value Share (%) and BPS Analysis by Country, 2025 to 2035
  • Figure 57: Latin America Market Y-o-Y Growth (%) Projections by Country, 2025 to 2035
  • Figure 58: Latin America Market Value (USD Million) Analysis by Type, 2020 to 2035
  • Figure 59: Latin America Market Volume (MT) Analysis by Type, 2020 to 2035
  • Figure 60: Latin America Market Value Share (%) and BPS Analysis by Type, 2025 to 2035
  • Figure 61: Latin America Market Y-o-Y Growth (%) Projections by Type, 2025 to 2035
  • Figure 62: Latin America Market Value (USD Million) Analysis by Source, 2020 to 2035
  • Figure 63: Latin America Market Volume (MT) Analysis by Source, 2020 to 2035
  • Figure 64: Latin America Market Value Share (%) and BPS Analysis by Source, 2025 to 2035
  • Figure 65: Latin America Market Y-o-Y Growth (%) Projections by Source, 2025 to 2035
  • Figure 66: Latin America Market Value (USD Million) Analysis by Application, 2020 to 2035
  • Figure 67: Latin America Market Volume (MT) Analysis by Application, 2020 to 2035
  • Figure 68: Latin America Market Value Share (%) and BPS Analysis by Application, 2025 to 2035
  • Figure 69: Latin America Market Y-o-Y Growth (%) Projections by Application, 2025 to 2035
  • Figure 70: Latin America Market Attractiveness by Type, 2025 to 2035
  • Figure 71: Latin America Market Attractiveness by Source, 2025 to 2035
  • Figure 72: Latin America Market Attractiveness by Application, 2025 to 2035
  • Figure 73: Latin America Market Attractiveness by Country, 2025 to 2035
  • Figure 74: Europe Market Value (USD Million) by Type, 2025 to 2035
  • Figure 75: Europe Market Value (USD Million) by Source, 2025 to 2035
  • Figure 76: Europe Market Value (USD Million) by Application, 2025 to 2035
  • Figure 77: Europe Market Value (USD Million) by Country, 2025 to 2035
  • Figure 78: Europe Market Value (USD Million) Analysis by Country, 2020 to 2035
  • Figure 79: Europe Market Volume (MT) Analysis by Country, 2020 to 2035
  • Figure 80: Europe Market Value Share (%) and BPS Analysis by Country, 2025 to 2035
  • Figure 81: Europe Market Y-o-Y Growth (%) Projections by Country, 2025 to 2035
  • Figure 82: Europe Market Value (USD Million) Analysis by Type, 2020 to 2035
  • Figure 83: Europe Market Volume (MT) Analysis by Type, 2020 to 2035
  • Figure 84: Europe Market Value Share (%) and BPS Analysis by Type, 2025 to 2035
  • Figure 85: Europe Market Y-o-Y Growth (%) Projections by Type, 2025 to 2035
  • Figure 86: Europe Market Value (USD Million) Analysis by Source, 2020 to 2035
  • Figure 87: Europe Market Volume (MT) Analysis by Source, 2020 to 2035
  • Figure 88: Europe Market Value Share (%) and BPS Analysis by Source, 2025 to 2035
  • Figure 89: Europe Market Y-o-Y Growth (%) Projections by Source, 2025 to 2035
  • Figure 90: Europe Market Value (USD Million) Analysis by Application, 2020 to 2035
  • Figure 91: Europe Market Volume (MT) Analysis by Application, 2020 to 2035
  • Figure 92: Europe Market Value Share (%) and BPS Analysis by Application, 2025 to 2035
  • Figure 93: Europe Market Y-o-Y Growth (%) Projections by Application, 2025 to 2035
  • Figure 94: Europe Market Attractiveness by Type, 2025 to 2035
  • Figure 95: Europe Market Attractiveness by Source, 2025 to 2035
  • Figure 96: Europe Market Attractiveness by Application, 2025 to 2035
  • Figure 97: Europe Market Attractiveness by Country, 2025 to 2035
  • Figure 98: East Asia Market Value (USD Million) by Type, 2025 to 2035
  • Figure 99: East Asia Market Value (USD Million) by Source, 2025 to 2035
  • Figure 100: East Asia Market Value (USD Million) by Application, 2025 to 2035
  • Figure 101: East Asia Market Value (USD Million) by Country, 2025 to 2035
  • Figure 102: East Asia Market Value (USD Million) Analysis by Country, 2020 to 2035
  • Figure 103: East Asia Market Volume (MT) Analysis by Country, 2020 to 2035
  • Figure 104: East Asia Market Value Share (%) and BPS Analysis by Country, 2025 to 2035
  • Figure 105: East Asia Market Y-o-Y Growth (%) Projections by Country, 2025 to 2035
  • Figure 106: East Asia Market Value (USD Million) Analysis by Type, 2020 to 2035
  • Figure 107: East Asia Market Volume (MT) Analysis by Type, 2020 to 2035
  • Figure 108: East Asia Market Value Share (%) and BPS Analysis by Type, 2025 to 2035
  • Figure 109: East Asia Market Y-o-Y Growth (%) Projections by Type, 2025 to 2035
  • Figure 110: East Asia Market Value (USD Million) Analysis by Source, 2020 to 2035
  • Figure 111: East Asia Market Volume (MT) Analysis by Source, 2020 to 2035
  • Figure 112: East Asia Market Value Share (%) and BPS Analysis by Source, 2025 to 2035
  • Figure 113: East Asia Market Y-o-Y Growth (%) Projections by Source, 2025 to 2035
  • Figure 114: East Asia Market Value (USD Million) Analysis by Application, 2020 to 2035
  • Figure 115: East Asia Market Volume (MT) Analysis by Application, 2020 to 2035
  • Figure 116: East Asia Market Value Share (%) and BPS Analysis by Application, 2025 to 2035
  • Figure 117: East Asia Market Y-o-Y Growth (%) Projections by Application, 2025 to 2035
  • Figure 118: East Asia Market Volume (MT) Analysis by , 2020 to 2035
  • Figure 119: East Asia Market Attractiveness by Type, 2025 to 2035
  • Figure 120: East Asia Market Attractiveness by Source, 2025 to 2035
  • Figure 121: East Asia Market Attractiveness by Application, 2025 to 2035
  • Figure 122: East Asia Market Attractiveness by Country, 2025 to 2035
  • Figure 123: South Asia Market Value (USD Million) by Type, 2025 to 2035
  • Figure 124: South Asia Market Value (USD Million) by Source, 2025 to 2035
  • Figure 125: South Asia Market Value (USD Million) by Application, 2025 to 2035
  • Figure 126: South Asia Market Value (USD Million) by Country, 2025 to 2035
  • Figure 127: South Asia Market Value (USD Million) Analysis by Country, 2020 to 2035
  • Figure 128: South Asia Market Volume (MT) Analysis by Country, 2020 to 2035
  • Figure 129: South Asia Market Value Share (%) and BPS Analysis by Country, 2025 to 2035
  • Figure 130: South Asia Market Y-o-Y Growth (%) Projections by Country, 2025 to 2035
  • Figure 131: South Asia Market Value (USD Million) Analysis by Type, 2020 to 2035
  • Figure 132: South Asia Market Volume (MT) Analysis by Type, 2020 to 2035
  • Figure 133: South Asia Market Value Share (%) and BPS Analysis by Type, 2025 to 2035
  • Figure 134: South Asia Market Y-o-Y Growth (%) Projections by Type, 2025 to 2035
  • Figure 135: South Asia Market Value (USD Million) Analysis by Source, 2020 to 2035
  • Figure 136: South Asia Market Volume (MT) Analysis by Source, 2020 to 2035
  • Figure 137: South Asia Market Value Share (%) and BPS Analysis by Source, 2025 to 2035
  • Figure 138: South Asia Market Y-o-Y Growth (%) Projections by Source, 2025 to 2035
  • Figure 139: South Asia Market Value (USD Million) Analysis by Application, 2020 to 2035
  • Figure 140: South Asia Market Volume (MT) Analysis by Application, 2020 to 2035
  • Figure 141: South Asia Market Value Share (%) and BPS Analysis by Application, 2025 to 2035
  • Figure 142: South Asia Market Y-o-Y Growth (%) Projections by Application, 2025 to 2035
  • Figure 143: South Asia Market Attractiveness by Type, 2025 to 2035
  • Figure 144: South Asia Market Attractiveness by Source, 2025 to 2035
  • Figure 145: South Asia Market Attractiveness by Application, 2025 to 2035
  • Figure 146: South Asia Market Attractiveness by Country, 2025 to 2035
  • Figure 147: Oceania Market Value (USD Million) by Type, 2025 to 2035
  • Figure 148: Oceania Market Value (USD Million) by Source, 2025 to 2035
  • Figure 149: Oceania Market Value (USD Million) by Application, 2025 to 2035
  • Figure 150: Oceania Market Value (USD Million) by Country, 2025 to 2035
  • Figure 151: Oceania Market Value (USD Million) Analysis by Country, 2020 to 2035
  • Figure 152: Oceania Market Volume (MT) Analysis by Country, 2020 to 2035
  • Figure 153: Oceania Market Value Share (%) and BPS Analysis by Country, 2025 to 2035
  • Figure 154: Oceania Market Y-o-Y Growth (%) Projections by Country, 2025 to 2035
  • Figure 155: Oceania Market Value (USD Million) Analysis by Type, 2020 to 2035
  • Figure 156: Oceania Market Volume (MT) Analysis by Type, 2020 to 2035
  • Figure 157: Oceania Market Value Share (%) and BPS Analysis by Type, 2025 to 2035
  • Figure 158: Oceania Market Y-o-Y Growth (%) Projections by Type, 2025 to 2035
  • Figure 159: Oceania Market Value (USD Million) Analysis by Source, 2020 to 2035
  • Figure 160: Oceania Market Volume (MT) Analysis by Source, 2020 to 2035
  • Figure 161: Oceania Market Value Share (%) and BPS Analysis by Source, 2025 to 2035
  • Figure 162: Oceania Market Y-o-Y Growth (%) Projections by Source, 2025 to 2035
  • Figure 163: Oceania Market Value (USD Million) Analysis by Application, 2020 to 2035
  • Figure 164: Oceania Market Volume (MT) Analysis by Application, 2020 to 2035
  • Figure 165: Oceania Market Value Share (%) and BPS Analysis by Application, 2025 to 2035
  • Figure 166: Oceania Market Y-o-Y Growth (%) Projections by Application, 2025 to 2035
  • Figure 167: Oceania Market Attractiveness by Type, 2025 to 2035
  • Figure 168: Oceania Market Attractiveness by Source, 2025 to 2035
  • Figure 169: Oceania Market Attractiveness by Application, 2025 to 2035
  • Figure 170: Oceania Market Attractiveness by Country, 2025 to 2035
  • Figure 171: MEA Market Value (USD Million) by Type, 2025 to 2035
  • Figure 172: MEA Market Value (USD Million) by Source, 2025 to 2035
  • Figure 173: MEA Market Value (USD Million) by Application, 2025 to 2035
  • Figure 174: MEA Market Value (USD Million) by Country, 2025 to 2035
  • Figure 175: MEA Market Value (USD Million) Analysis by Country, 2020 to 2035
  • Figure 176: MEA Market Volume (MT) Analysis by Country, 2020 to 2035
  • Figure 177: MEA Market Value Share (%) and BPS Analysis by Country, 2025 to 2035
  • Figure 178: MEA Market Y-o-Y Growth (%) Projections by Country, 2025 to 2035
  • Figure 179: MEA Market Value (USD Million) Analysis by Type, 2020 to 2035
  • Figure 180: MEA Market Volume (MT) Analysis by Type, 2020 to 2035
  • Figure 181: MEA Market Value Share (%) and BPS Analysis by Type, 2025 to 2035
  • Figure 182: MEA Market Y-o-Y Growth (%) Projections by Type, 2025 to 2035
  • Figure 183: MEA Market Value (USD Million) Analysis by Source, 2020 to 2035
  • Figure 184: MEA Market Volume (MT) Analysis by Source, 2020 to 2035
  • Figure 185: MEA Market Value Share (%) and BPS Analysis by Source, 2025 to 2035
  • Figure 186: MEA Market Y-o-Y Growth (%) Projections by Source, 2025 to 2035
  • Figure 187: MEA Market Value (USD Million) Analysis by Application, 2020 to 2035
  • Figure 188: MEA Market Volume (MT) Analysis by Application, 2020 to 2035
  • Figure 189: MEA Market Value Share (%) and BPS Analysis by Application, 2025 to 2035
  • Figure 190: MEA Market Y-o-Y Growth (%) Projections by Application, 2025 to 2035
  • Figure 191: MEA Market Volume (MT) Analysis by, 2020 to 2035
  • Figure 192: MEA Market Attractiveness by Type, 2025 to 2035
  • Figure 193: MEA Market Attractiveness by Source, 2025 to 2035
  • Figure 194: MEA Market Attractiveness by Application, 2025 to 2035
  • Figure 195: MEA Market Attractiveness by Country, 2025 to 2035

Frequently Asked Questions

What is the projected Compound Annual Growth Rate (CAGR) for the global low-calorie sweeteners market?

The global low-calorie sweeteners market is projected to grow at a CAGR of approximately 4.7% from 2025 to 2035.

What is the expected market value of low-calorie sweeteners by 2035?

The market is estimated to reach approximately USD 52.1 billion by 2035.

Which segment is expected to grow the fastest in the low-calorie sweeteners market?

The high-intensity sweeteners segment is projected to exhibit a significant CAGR of 6.4% from 2025 to 2035, indicating rapid growth within the market.

What factors are driving growth in the global low-calorie sweeteners market?

Key growth drivers include increasing health consciousness among consumers, rising prevalence of lifestyle diseases like obesity and diabetes, and a growing preference for natural sweeteners.

Who are the key companies in the global low-calorie sweeteners market?

Leading companies in the market include Cargill, Incorporated; Archer Daniels Midland Company; Ingredion Incorporated; Tate & Lyle PLC; and Ajinomoto Co., Inc.

Explore Similar Insights

Future Market Insights

Low-Calorie Sweeteners Market