The L-Carnitine Market is estimated to be valued at USD 227.1 million in 2025 and is projected to reach USD 369.9 million by 2035, registering a compound annual growth rate (CAGR) of 5.0% over the forecast period.
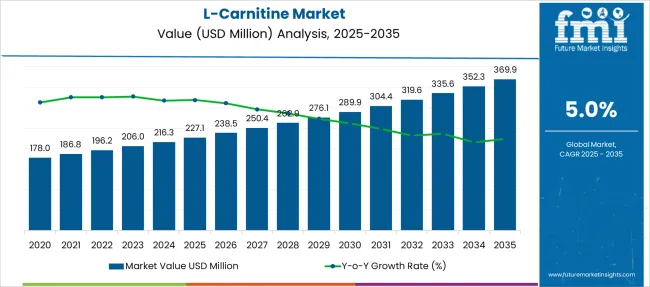
| Metric | Value |
|---|---|
| L-Carnitine Market Estimated Value in (2025 E) | USD 227.1 million |
| L-Carnitine Market Forecast Value in (2035 F) | USD 369.9 million |
| Forecast CAGR (2025 to 2035) | 5.0% |
The L-Carnitine market is experiencing steady growth, supported by rising health awareness, increased focus on weight management, and growing applications across pharmaceuticals, nutraceuticals, and functional food sectors. As consumers actively seek performance-enhancing and energy-boosting supplements, L-Carnitine has gained prominence for its role in fat metabolism and cellular energy production.
The market is also influenced by the rising prevalence of cardiovascular and metabolic disorders, prompting higher adoption of L-Carnitine in therapeutic and dietary formulations. Favorable regulatory recognition and a growing aging population further amplify demand.
The outlook remains strong, with continued expansion expected as clinical validation and health claims solidify consumer trust. Innovations in ingredient delivery formats and sustained R&D activities are anticipated to fuel product diversification and broader market reach globally.
The l-carnitine market is segmented by process, product (grade), product (application), and geographic regions. The l-carnitine market is divided into Chemical Synthesis and Bioprocess. In terms of product (grade), the l-carnitine market is classified into Food & Pharmaceutical Grade and Feed Grade. The l-carnitine market is segmented into Healthcare products, Animal Feed, Functional Drinks, and Others. Regionally, the l-carnitine industry is classified into North America, Latin America, Western Europe, Eastern Europe, Balkan & Baltic Countries, Russia & Belarus, Central Asia, East Asia, South Asia & Pacific, and the Middle East & Africa.
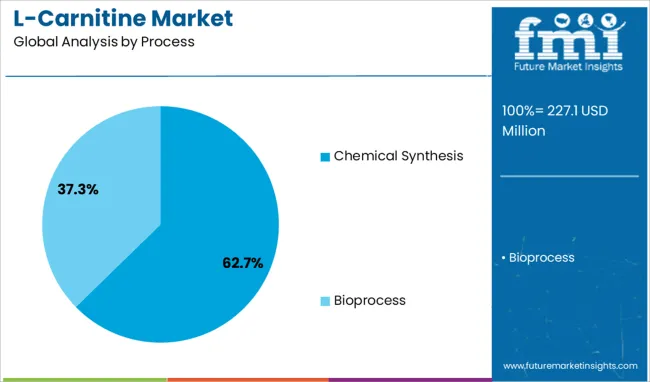
The chemical synthesis segment dominates the process category with a 62.7% market share, owing to its cost-effectiveness, scalability, and established manufacturing protocols. This method allows for consistent production of high-purity L-Carnitine at commercial volumes, making it the preferred choice for large-scale suppliers serving pharmaceutical and nutritional markets.
Despite emerging interest in bio-based synthesis, chemical synthesis remains widely used due to its efficiency and regulatory acceptance. Manufacturers continue to optimize reaction processes and reduce environmental impact, ensuring the segment's competitiveness.
The predictable yield and purity associated with this process have positioned it as the backbone of industrial L-Carnitine supply chains. Continued demand from global nutraceutical brands and pharmaceutical companies reinforces the dominance of the chemical synthesis method in the market’s production landscape.
.webp)
The food & pharmaceutical grade segment holds a commanding 70.3% share in the product grade category, driven by stringent safety standards and expanding usage in regulated health products. This grade of L-Carnitine is preferred for its purity, bioavailability, and compliance with global food and drug regulations, making it suitable for dietary supplements, functional foods, and clinical nutrition.
The rise in consumer preference for clean-label and clinically supported ingredients has further fueled demand for high-quality L-Carnitine. Pharmaceutical applications, particularly in cardiac and metabolic therapies, continue to support segment growth.
Leading manufacturers are investing in advanced purification technologies and certifications to meet evolving industry standards. As consumer trust in scientifically-backed health products strengthens, the food & pharmaceutical grade segment is expected to maintain its market leadership.
.webp)
The healthcare products segment accounts for 38.5% of the market under product application, reflecting robust consumer demand for supplements that support energy metabolism, athletic performance, and overall wellness. L-Carnitine’s established benefits in fat oxidation and endurance enhancement have made it a staple in sports nutrition and weight management formulations.
Healthcare brands have increasingly integrated L-Carnitine into capsules, tablets, and functional beverages, catering to both fitness-oriented and general health consumers. The segment’s growth is also driven by awareness campaigns and digital health trends promoting active lifestyles.
With clinical research continually reinforcing L-Carnitine’s safety and efficacy, demand from wellness-focused consumers is projected to remain strong. Product innovations aimed at improved absorption and palatability are expected to further accelerate segment expansion.
The L-carnitine market is expanding through diverse applications in sports nutrition, functional foods, and clinical care, supported by rising consumer awareness and product innovation. Strategic partnerships, e-commerce growth, and advanced manufacturing are driving competitive advantage globally.
The L-Carnitine market is experiencing strong demand from the sports nutrition industry as athletes and fitness enthusiasts seek enhanced endurance and recovery solutions. L-Carnitine plays a critical role in fat metabolism and energy production, making it popular in pre-workout and post-workout supplements. Its incorporation in protein shakes, energy drinks, and capsules is expanding rapidly, especially in markets with a high concentration of gyms and health clubs. Consumers increasingly prefer scientifically backed ingredients that deliver measurable benefits, driving manufacturers to promote clinical research supporting performance enhancement. This growing acceptance of L-Carnitine in active lifestyle products underlines its rising prominence in the broader performance nutrition segment worldwide.
The inclusion of L-Carnitine in functional food and beverage formulations is gaining momentum as brands aim to differentiate products with energy-boosting properties. Popular applications include fortified waters, ready-to-drink beverages, and health bars targeting consumers with busy lifestyles. This integration responds to rising awareness about weight management and metabolic health, further reinforced by marketing campaigns emphasizing convenience and wellness. Manufacturers are focusing on taste optimization and stability of L-Carnitine in various matrices to ensure consumer acceptance. As functional nutrition becomes mainstream, its role in driving beverage innovation and improving consumer engagement remains pivotal across multiple regional markets.
Clinical applications of L-Carnitine are increasing as hospitals and healthcare providers recognize its benefits in metabolic disorders, cardiovascular health, and recovery therapies. Its use in infant formulas to support energy metabolism and brain development also continues to rise, especially in regulated markets like North America and Europe. Manufacturers are complying with stringent quality and safety standards while developing formulations for sensitive patient groups. Partnerships with healthcare institutions are strengthening its medical positioning, driving greater trust and adoption in specialized nutrition categories. These developments highlight the compound’s importance beyond sports and lifestyle segments, positioning it as a key ingredient in clinical care solutions globally.
The L-Carnitine market is defined by aggressive strategies from leading players focused on innovation, pricing, and supply chain resilience. Companies are investing in fermentation-based production for consistent quality and scalability, addressing increasing demand in dietary supplements and fortified foods. Strategic collaborations with fitness brands, wellness retailers, and healthcare organizations are expanding distribution networks. E-commerce platforms are emerging as critical sales channels, supported by influencer marketing and digital campaigns targeting younger demographics. Competitive differentiation is also being driven by claims of purity, bioavailability, and scientifically proven benefits, allowing brands to capture loyal consumer bases and strengthen their global footprint in the L-Carnitine market.
| Country | CAGR |
|---|---|
| China | 6.8% |
| India | 6.3% |
| Germany | 5.8% |
| France | 5.3% |
| UK | 4.8% |
| USA | 4.3% |
| Brazil | 3.8% |
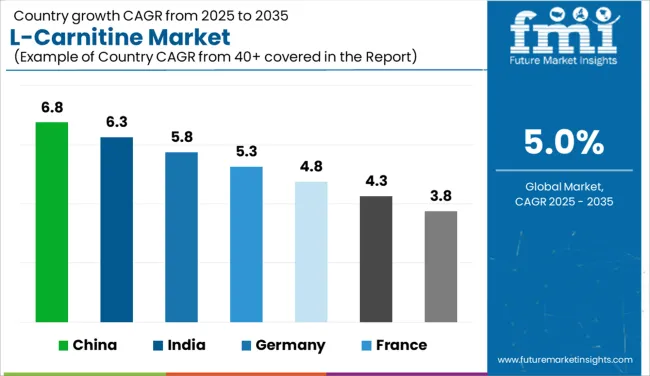
The L-carnitine industry, projected to expand at a global CAGR of 5.0% between 2025 and 2035, shows varied growth patterns across leading countries. China leads with an expected 6.8% CAGR, supported by its expanding nutraceutical manufacturing base and demand in functional foods and sports supplements. India follows at 6.3%, driven by the rapid growth of dietary supplement adoption and expansion in fitness and wellness industries. France is positioned at 5.3%, reflecting consistent integration in functional beverages and clinical nutrition segments across Europe. The United Kingdom is forecast to grow at 4.8%, benefitting from strong consumer awareness and demand for energy-boosting supplements, while the United States records a steady 4.3% CAGR as established players expand e-commerce distribution and clinical applications. High-growth opportunities exist in Asian economies due to rising lifestyle-driven health concerns, whereas Western markets remain steady, focusing on premiumization and personalized nutrition offerings. The report includes in-depth insights into more than 40 countries, with detailed analysis of the top five shared here for reference.
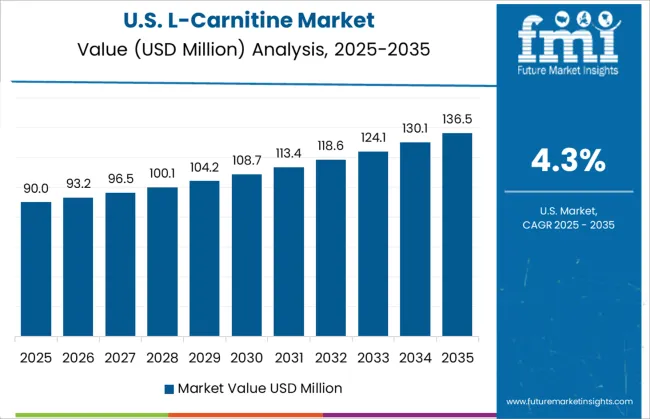
The CAGR of the L-Carnitine market in the United States grew from an estimated 3.7% in 2020–2024 to 4.3% for 2025–2035, driven by rising demand for sports nutrition and therapeutic applications. Consumers increasingly prefer scientifically validated supplements to support weight management, energy enhancement, and cardiovascular health. The growing popularity of functional beverages enriched with L-Carnitine, particularly in ready-to-drink formats, has strengthened retail sales. Partnerships with healthcare institutions have also increased confidence in medical-grade formulations for clinical uses, such as metabolic disorder management and recovery programs. Moreover, e-commerce platforms and subscription-based services have expanded accessibility, making premium L-Carnitine products available to a broader demographic. The integration of L-Carnitine in protein shakes and fortified drinks underscores its versatility and relevance to the evolving health-conscious lifestyle in the USA.
The CAGR in the United Kingdom moved from approximately 4.1% in 2020–2024 to 4.8% for 2025–2035, supported by rising health awareness and increased adoption of fortified foods. Weight management and energy-boosting solutions have become top consumer priorities, leading to higher inclusion of L-Carnitine in beverages, dietary bars, and clinical-grade supplements. Partnerships between brands and pharmacy networks have accelerated the distribution of medical-grade products, while wellness applications and digital platforms have promoted fitness-based formulations to active consumers. Personalized subscription services focused on sports and lifestyle nutrition have created a new demand base for L-Carnitine. Additionally, the integration of the ingredient into infant nutrition and healthcare programs has broadened its scope beyond fitness, ensuring long-term market stability. Marketing strategies emphasizing scientifically proven benefits have been instrumental in increasing adoption across the UK.
China registered an impressive rise in CAGR from 6.0% in 2020–2024 to 6.8% during 2025–2035, making it one of the leading growth markets worldwide. The surge is fueled by consumer preference for fitness supplements and government initiatives promoting preventive healthcare. Ready-to-drink L-Carnitine beverages and fortified foods dominate demand, while online platforms and cross-border e-commerce have significantly boosted distribution efficiency. Domestic manufacturing clusters in key provinces such as Guangdong and Jiangsu have scaled up capacity to cater to both local and international markets. Strategic partnerships with global nutraceutical brands and aggressive marketing via social media influencers have increased awareness among younger demographics. With rising disposable incomes and fitness culture expansion, China represents a major hub for premium sports nutrition and wellness-driven L-Carnitine applications.
India’s CAGR surged from 5.4% during 2020–2024 to 6.3% for the 2025–2035 forecast period, underpinned by growing health awareness and rapid expansion of the sports nutrition market. A surge in gym memberships and home fitness programs has driven demand for L-Carnitine in pre- and post-workout formulations. Furthermore, fortified energy drinks and health bars have gained strong traction among working professionals and millennials, creating new opportunities for beverage manufacturers. The inclusion of L-Carnitine in pharmaceutical products for metabolic health disorders, coupled with infant nutrition formulations, has widened its application base. E-commerce platforms and wellness apps have significantly improved accessibility across Tier 2 and Tier 3 cities, strengthening domestic market penetration. Government-backed health campaigns and investment in nutraceutical hubs across states like Gujarat and Telangana continue to enhance production capabilities.
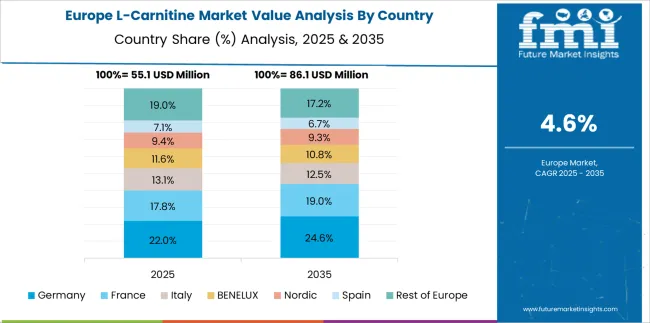
The CAGR in France increased from approximately 4.6% during 2020–2024 to 5.3% in the 2025–2035 period, supported by the rising adoption of functional nutrition and fortified beverages across the country. French consumers are showing strong interest in products promoting energy metabolism and weight management, making L-Carnitine an essential ingredient in dietary supplements and energy drinks. Additionally, clinical nutrition applications are growing due to the inclusion of L-Carnitine in therapies for cardiovascular health and metabolic disorders. Pharmacies and health retail chains have enhanced their offerings, while e-commerce has expanded accessibility through direct-to-consumer wellness subscriptions. Local brands are also introducing L-Carnitine-enriched formulations in functional snacks and fortified waters, aiming to attract health-conscious consumers seeking convenience and efficacy.
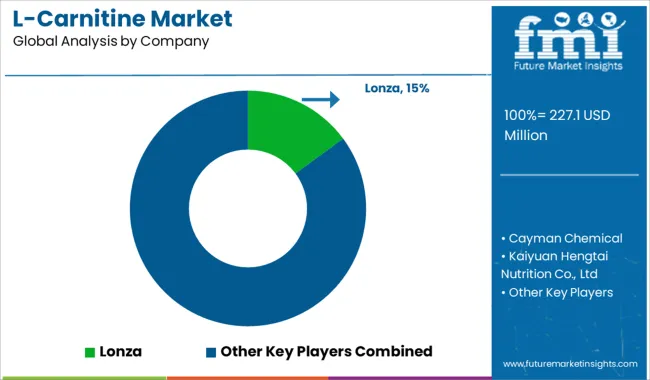
In the global L-Carnitine market, prominent players are focusing on high-quality ingredient manufacturing, clinical validation, and diversified application strategies to address increasing demand across nutrition, healthcare, and pharmaceutical sectors. Companies like Lonza and Merck KGaA dominate premium-grade L-Carnitine production with advanced fermentation technologies and robust compliance standards for clinical and infant nutrition applications. Cayman Chemical and Biosint S.p.A are strengthening their positions by offering research-driven formulations catering to metabolic health and sports nutrition.
Asian manufacturers such as Kaiyuan Hengtai Nutrition Co., Ltd, HuBeiYuancheng Saichuang Technology Co. Ltd, and Shanghai Danfan Network Science & Technology Co., Ltd are scaling up production capacity to serve cost-sensitive markets with bulk-grade ingredients. Tokyo Chemical Industry Co., Ltd and its subsidiaries continue to innovate in specialty chemical integration for pharmaceutical-grade uses. Meanwhile, Northeast Medicines Group Co., Ltd. (NEPG) and ChengDa Pharmaceuticals Co., Ltd are leveraging regional distribution networks to supply clinical and dietary segments.
Companies like Ceva, Huanggang Huayang Medicines Co. Ltd, and Xinxiang Kangjian Chemical Co., Ltd are expanding partnerships with healthcare institutions to penetrate therapeutic nutrition categories. Strategic collaborations, regulatory compliance, and investment in R&D for bioavailable L-Carnitine formulations remain the core growth strategies for these manufacturers, ensuring their competitive edge in both developed and emerging markets globally.
The L-Carnitine market in 2024 and 2025 is driven by rising demand in sports nutrition, functional beverages, and clinical nutrition applications. Increasing consumer awareness of weight management and energy metabolism benefits is encouraging adoption across supplements and fortified foods. Regulatory approvals for medical use in cardiovascular and metabolic disorders further enhance market growth.
Manufacturers are focusing on fermentation-based production for cost efficiency, expanding e-commerce channels, and forming strategic alliances with fitness and wellness brands to strengthen distribution networks. These strategies ensure greater market penetration and improved accessibility across both developed and emerging regions.
| Item | Value |
|---|---|
| Quantitative Units | USD 227.1 Million |
| Process | Chemical Synthesis and Bioprocess |
| Product (Grade) | Food & Pharmaceutical Grade and Feed Grade |
| Product (Application) | Healthcare products, Animal Feed, Functional Drinks, and Others |
| Regions Covered | North America, Europe, Asia-Pacific, Latin America, Middle East & Africa |
| Country Covered | United States, Canada, Germany, France, United Kingdom, China, Japan, India, Brazil, South Africa |
| Key Companies Profiled | Lonza, Cayman Chemical, Kaiyuan Hengtai Nutrition Co., Ltd, Tokyo Chemical Industry Co., Ltd, Biosint S.p.A, Northeast Medicines Group Co., Ltd. (NEPG), Merck KGaA, Ceva, Huanggang Huayang Medicines Co. Ltd, Xinxiang Kangjian Chemical Co., Ltd, ChengDa PharmaCeuticals Co., Ltd, HuBeiYuancheng Saichuang Technology Co. Ltd, China Qingdao Hongjin Chemical Co., Ltd, Shanghai Danfan Network Science & Technology Co., Ltd, and Tokyo Chemical Industry |
| Additional Attributes | Dollar sales by region, share by application segments (sports nutrition, functional foods, clinical use), pricing trends, raw material cost impact, regulatory updates, competitive landscape, growth projections, demand by delivery formats, key consumer trends. |
The global l-carnitine market is estimated to be valued at USD 227.1 million in 2025.
The market size for the l-carnitine market is projected to reach USD 369.9 million by 2035.
The l-carnitine market is expected to grow at a 5.0% CAGR between 2025 and 2035.
The key product types in l-carnitine market are chemical synthesis and bioprocess.
In terms of product (grade), food & pharmaceutical grade segment to command 70.3% share in the l-carnitine market in 2025.


Our Research Products

The "Full Research Suite" delivers actionable market intel, deep dives on markets or technologies, so clients act faster, cut risk, and unlock growth.

The Leaderboard benchmarks and ranks top vendors, classifying them as Established Leaders, Leading Challengers, or Disruptors & Challengers.

Locates where complements amplify value and substitutes erode it, forecasting net impact by horizon

We deliver granular, decision-grade intel: market sizing, 5-year forecasts, pricing, adoption, usage, revenue, and operational KPIs—plus competitor tracking, regulation, and value chains—across 60 countries broadly.

Spot the shifts before they hit your P&L. We track inflection points, adoption curves, pricing moves, and ecosystem plays to show where demand is heading, why it is changing, and what to do next across high-growth markets and disruptive tech

Real-time reads of user behavior. We track shifting priorities, perceptions of today’s and next-gen services, and provider experience, then pace how fast tech moves from trial to adoption, blending buyer, consumer, and channel inputs with social signals (#WhySwitch, #UX).

Partner with our analyst team to build a custom report designed around your business priorities. From analysing market trends to assessing competitors or crafting bespoke datasets, we tailor insights to your needs.
Supplier Intelligence
Discovery & Profiling
Capacity & Footprint
Performance & Risk
Compliance & Governance
Commercial Readiness
Who Supplies Whom
Scorecards & Shortlists
Playbooks & Docs
Category Intelligence
Definition & Scope
Demand & Use Cases
Cost Drivers
Market Structure
Supply Chain Map
Trade & Policy
Operating Norms
Deliverables
Buyer Intelligence
Account Basics
Spend & Scope
Procurement Model
Vendor Requirements
Terms & Policies
Entry Strategy
Pain Points & Triggers
Outputs
Pricing Analysis
Benchmarks
Trends
Should-Cost
Indexation
Landed Cost
Commercial Terms
Deliverables
Brand Analysis
Positioning & Value Prop
Share & Presence
Customer Evidence
Go-to-Market
Digital & Reputation
Compliance & Trust
KPIs & Gaps
Outputs
Full Research Suite comprises of:
Market outlook & trends analysis
Interviews & case studies
Strategic recommendations
Vendor profiles & capabilities analysis
5-year forecasts
8 regions and 60+ country-level data splits
Market segment data splits
12 months of continuous data updates
DELIVERED AS:
PDF EXCEL ONLINE

Thank you!
You will receive an email from our Business Development Manager. Please be sure to check your SPAM/JUNK folder too.
Chat With
MaRIA