L-Carnitine Supplements Market Size and Share Forecast Outlook 2025 to 2035

The global L-carnitine supplements market is estimated at USD 242.7 million in 2025 and is projected to reach USD 434.6 million by 2035, recording a CAGR of 6% during the forecast period. Market expansion is driven by increasing use of L-carnitine for weight management, post-exercise recovery, and healthy aging, alongside its application in pharmaceutical nutritional interventions. Over the forecast horizon, an absolute dollar opportunity of USD 143.3 million is anticipated.
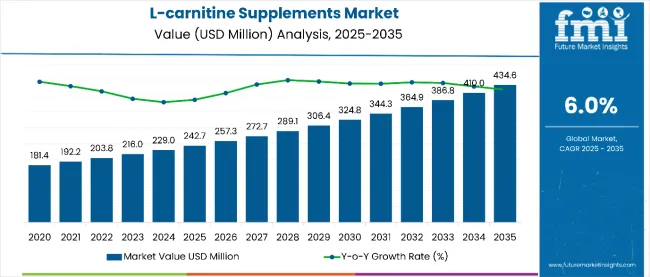
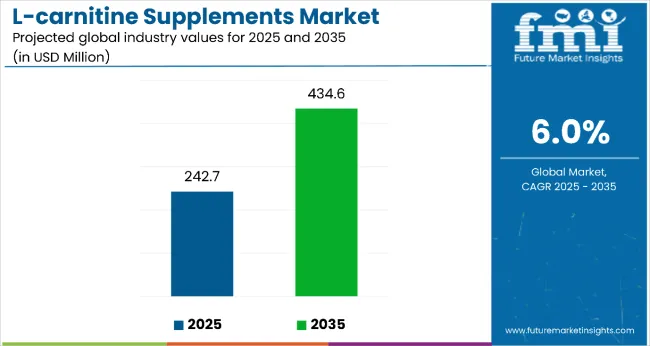
L Carnitine Supplements Market Value Analysis

Quick Stats for L-carnitine Supplements Market

  • L-Carnitine Supplements Market Value (2025): USD 242.7 million
  • L-Carnitine Supplements Market Forecast Value (2035): USD 434.6 million
  • L-Carnitine Supplements Market Forecast CAGR: 6%
  • Leading Segment in L-Carnitine Supplements Market in 2025: Food Grade (55% market share)
  • Key Growth Regions in L-Carnitine Supplements Market: North America, Western Europe, East Asia
  • Top Key Players in L-Carnitine Supplements Market: Lonza Group Ltd., Northeast Pharmaceutical Group Co., Ltd., Ceva Santé Animale S.A., KaiyuanHengtai Chemical Co., Ltd., ChengDa Pharmaceuticals Co., Ltd.

L Carnitine Supplements Market

By 2030, the market is forecasted to reach USD 289.06 million, contributing USD 46.36 million during the first half of the decade. The remaining USD 96.94 million is expected in the latter half, indicating a moderately back-loaded growth pattern.

Leading players such as Lonza Group Ltd. and Northeast Pharmaceutical Group Co., Ltd. are enhancing competitiveness through process innovation and portfolio expansion. A key strategic shift involves the introduction of vegan L-carnitine supplements to meet rising demand among health-conscious and fitness-focused consumers. Advancements in formulation efficiency and diversified product offerings are expected to strengthen market positioning over the next decade.

The L-carnitine supplements market accounts for notable shares across several parent industries. Within the food and beverage sector, its share is around 1.5%, reflecting growing incorporation into functional foods and drinks. In the pharmaceutical segment, the market represents approximately 2.3%, primarily for clinical nutrition and therapeutic interventions. The dietary supplements category contributes 5.0% to the market, as consumer interest in performance and metabolic health supplements rises. Additionally, animal feed supplements account for 4.8%, driven by the expanding use of L-carnitine in livestock and pet nutrition for improved growth and energy metabolism.

Increasing adoption of L-carnitine in functional drinks and energy beverages has strengthened market momentum. Brands such as Lonza Group Ltd. have broadened their portfolios to include L-carnitine-based supplements formulated for enhanced athletic recovery and weight management. Vegan L-carnitine variants are gaining popularity, supported by the clean-label movement and plant-based nutrition trends. Growing consumer awareness of L-carnitine’s benefits in fat metabolism, cardiovascular health, and energy production further supports its integration into sports nutrition and medical nutrition products, particularly in high-demand markets such as North America and Asia-Pacific.

Why is the L-Carnitine Supplements Market Growing?

L-carnitine supplements are gaining traction due to clinically validated benefits in fat metabolism, post-exercise recovery, and healthy aging. These attributes have made L-carnitine a preferred ingredient for fitness enthusiasts, aging consumers, and individuals focused on metabolic health. Increased awareness of preventive healthcare and lifestyle-driven wellness has further accelerated adoption across multiple consumer segments.

The rising prevalence of obesity and cardiovascular disorders has reinforced the role of L-carnitine in weight management and energy production. Growing integration of this ingredient in functional foods, beverages, and sports nutrition products highlights its expanding application base. Manufacturers are introducing plant-based and vegan L-carnitine formulations, aligning with consumer demand for clean-label, non-animal-sourced supplements.

Innovation in delivery systems, such as gummies, ready-to-drink (RTD) beverages, and sustained-release capsules, has enhanced convenience and absorption rates, driving differentiation in competitive markets. With ongoing developments in clinical nutrition and nutraceutical formulations, the market outlook remains strong, positioning L-carnitine supplements as a core component in performance enhancement, wellness maintenance, and therapeutic nutrition.

Segment Analysis

The market is segmented by grade, application, end-use, and region. By grade, the market includes food grade, pharmaceutical grade, and feed grade. Based on application, it is categorized into functional drinks, medicine, healthcare products, and animal food. The end-use segment encompasses fat loss, improved heart conditions, kidney & liver treatment, boosting immunity, improving male infertility, brain function, bone mass, infant nutrition, anti-aging, skin care, metabolism, and pain relief. Regionally, the market spans North America, Latin America, Europe, East Asia, South Asia, Oceania, and the Middle East & Africa.
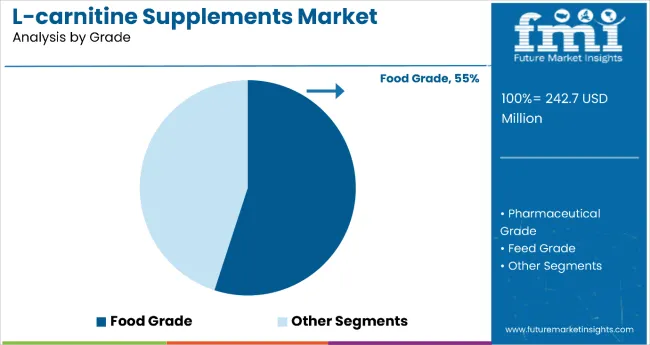
By Grade, Food Grade Accounts for 55% of the Market Share in 2025

L Carnitine Supplements Market By Grade

The food-grade category dominates with a 55% share, supported by increasing incorporation of L-carnitine in functional foods and beverages. Consumers seeking weight management and energy enhancement have driven demand for fortified food-grade ingredients. This segment benefits from its compatibility with various formulations and strong acceptance in both retail and foodservice channels.
  • Supported by rising interest in health-conscious diets
  • Increased use in fortified beverages and snacks
  • Strong demand from dietary supplements sector

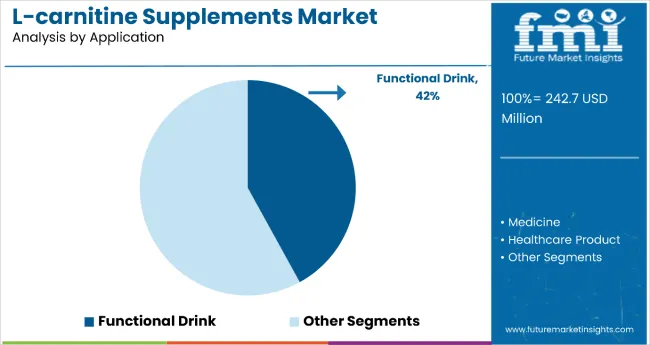
By Application, Functional Drinks Account for 42% of the Market Share

L Carnitine Supplements Market By Application

The functional drinks category leads with a 42% share, attributed to expanding demand for energy beverages, sports recovery drinks, and weight-loss solutions. L-carnitine’s compatibility with liquid formulations and synergistic potential with other bioactive compounds has made it essential in performance-focused beverages. The segment continues to gain traction due to on-the-go consumption trends.
  • Popular in sports and recovery beverages
  • Integrated into weight-loss and energy drink formulations
  • Strong adoption in low-calorie, clean-label drinks

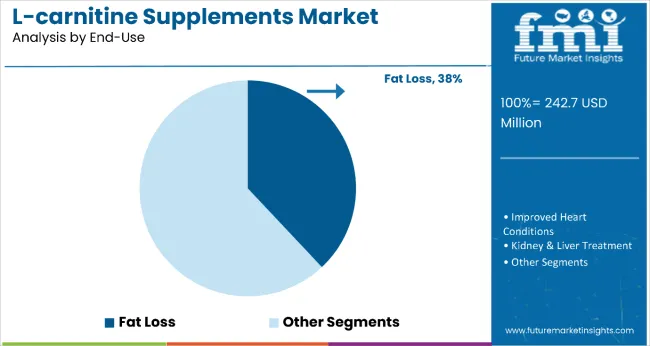
By End-Use Segment, Fat Loss Accounts for 38% of the Market Share

L Carnitine Supplements Market By End Use

Fat loss remains the most prominent end-use category with a 38% market share. L-carnitine’s proven ability to facilitate fatty acid oxidation has driven its use in weight management and metabolism-boosting supplements. The segment is further supported by global obesity concerns and the growing fitness culture.

  • Driven by rising global obesity prevalence
  • Increased use in fat-burning and metabolism-boosting supplements
  • Expanding product launches targeting active lifestyle consumers

What are the Drivers, Restraints, and Key Trends of the L-Carnitine Supplements Market?

In 2024, global L-carnitine supplement consumption rose by 15% year-on-year, with North America and Asia-Pacific contributing over 60% of total demand. Expansion is primarily driven by heightened awareness of metabolic health, growing fitness culture, and the inclusion of L-carnitine in functional food and beverage categories.

However, the market faces headwinds from ingredient cost fluctuations, inconsistent regulatory guidelines, and skepticism among certain consumer segments regarding efficacy. Emerging trends such as plant-based formulations, clean-label certifications, and RTD functional drinks are strengthening product visibility and relevance across diverse applications.

Key Drivers Fueling L-Carnitine Supplement Market Expansion

Market growth is anchored in rising demand for weight management solutions, performance enhancement, and overall wellness. L-carnitine’s role in fatty acid oxidation and energy metabolism has made it a critical ingredient in sports nutrition and clinical formulations. Its proven benefits in cardiovascular health, diabetes management, and male fertility have broadened its clinical relevance.

Consumer demand for multi-functional supplements has led to L-carnitine’s integration into capsules, gummies, and beverages. The growing availability of vegan and bioavailable formats has further reinforced adoption among ethically conscious consumers, while innovations in sustained-release technology and enhanced absorption methods have improved efficacy and differentiation.

Major Restraints Challenging L-Carnitine Supplement Market Development

Despite robust potential, high raw material costs, regional disparities in awareness, and regulatory complexities create obstacles for manufacturers. L-carnitine synthesis via fermentation or chemical processes is cost-intensive, impacting pricing strategies. Regulatory restrictions on dosage limits and health claims vary across jurisdictions, complicating global market alignment.

Consumer misconceptions around synthetic formulations and safety concerns also dampen penetration in conservative markets. Additionally, limited supply of pharma-grade and plant-based variants has caused distribution challenges, requiring advanced supply chain management and capacity expansion strategies.

Emerging Key Trends Influencing L-Carnitine Supplement Market Direction

The market is undergoing structural transformation as brands pivot toward vegan, clean-label, and multifunctional formulations. Plant-based L-carnitine is gaining prominence due to ethical sourcing trends and transparency-focused consumers. Combination products featuring L-carnitine with CoQ10, green tea extract, and electrolytes are emerging as premium offerings for performance enhancement and energy metabolism.

RTD beverages infused with L-carnitine dominate convenience-driven formats, while nutraceutical brands are adopting bioavailability-enhancing technologies for product differentiation. Regionally, Asia-Pacific is emerging as a key growth hub driven by urban fitness adoption and preventive health priorities, while North America maintains dominance through high product innovation and premiumization.
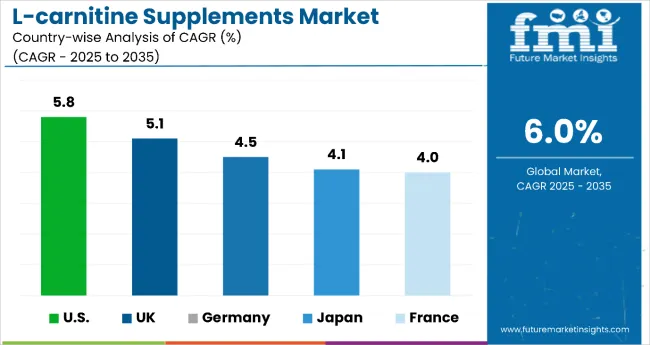
Analysis of L-Carnitine Supplements Market By Key Countries

Country Wise Analysis Of L Carnitine Supplements Market

Country CAGR (2025 to 2035)
United States 5.8%
United Kingdom 5.1%
Germany 4.5%
France 4.0%
Japan 4.1%

The L-carnitine supplements market across leading countries displays diverse growth dynamics from 2025 to 2035. The United States is projected to lead with a CAGR of 5.8%, supported by strong demand for performance and weight-management products.

The United Kingdom follows at 5.1%, driven by rising adoption of fat-burning and plant-based formulations. Germany and France demonstrate moderate growth rates of 4.5% and 4.0%, respectively, due to increased demand for cardiovascular and metabolic health products. Japan records a steady CAGR of 4.1%, reflecting consistent demand for sports recovery and energy metabolism products.

The report covers an in depth analysis of 40+ countries; five top performing OECD countries are highlighted below.

Production Capacity Trends in the L-Carnitine Supplements Market in the United States

The USA L-carnitine supplemented market is forecasted to expand at a CAGR of 5.8% during 2025 to 2035, driven by obesity management initiatives and active lifestyle adoption. High penetration of functional drinks and performance supplements has reinforced demand, while energy drink manufacturers continue to integrate L-carnitine into product portfolios. The USA also leads in innovative delivery formats, such as RTD beverages and gummies.

  • 5.8% CAGR projected for the USA through 2035
  • USD 136.8 million estimated USA market size by 2035
  • 40% of consumption driven by functional beverages and energy drinks

Output Expansion in the L-Carnitine Supplements Market in the United Kingdom

The L-carnitine supplements market in UK is expected to grow at 5.1% CAGR through 2035, fueled by expanding demand for vegan L-carnitine formulations and functional beverage adoption. A strong retail presence and innovation in sports nutrition products have supported steady growth. Plant-based L-carnitine supplements dominate premium segments.

  • 5.1% CAGR anticipated for the UK through 2035
  • USD 16.2 million projected market size by 2035
  • 45% of L-carnitine product launches in plant-based formats

Market Integration in the L-Carnitine Supplements Market in Germany

L-carnitine supplements market in Germany is projected to register a CAGR of 4.5% from 2025 to 2035, underpinned by growing awareness of cardiovascular health and clinical nutrition. Functional beverages and capsule-based supplements are widely adopted for energy metabolism and fitness applications.

  • 4.5% CAGR forecast for Germany through 2035
  • USD 27.7 million projected market size by 2035
  • 30% of demand driven by cardiovascular and weight-management products

Expansion of the L-Carnitine Supplements Market in France

The French L-carnitine supplements market is expected to grow at a CAGR of 4.0% during the forecast period, supported by increasing consumer interest in weight-loss supplements and natural health products. Functional food applications featuring L-carnitine have expanded significantly in premium grocery channels.

  • 4.0% CAGR projected for France through 2035
  • USD 18 million anticipated market size by 2035
  • 25% increase in demand for L-carnitine in functional food products

Growth Prospects in the L-Carnitine Supplements Market in Japan

Demand for L-carnitine supplements market in Japan is forecasted to achieve a CAGR of 4.1% between 2025 and 2035, driven by its aging population and preference for health-centric products targeting energy and recovery. L-carnitine’s integration into sports and RTD functional beverages remains a key growth driver.

  • 4.1% CAGR expected for Japan through 2035
  • USD 22.6 million projected market size by 2035
  • 38% of consumption concentrated in sports nutrition applications

Competitive Landscape of the L-Carnitine Supplements Market

The global L-carnitine supplements market is moderately fragmented, comprising multinational corporations and specialized regional players competing for market share. Leading companies are implementing strategies such as product diversification, technological advancements in synthesis, and expansion of distribution networks to strengthen their positions.

Lonza Group Ltd. dominates the market through its premium Carnipure® L-carnitine, widely recognized for efficacy in sports nutrition, energy metabolism, and weight management. Northeast Pharmaceutical Group Co., Ltd. maintains strong regional dominance with a comprehensive product portfolio and efficient production capabilities. KaiyuanHengtai Chemical Co., Ltd. focuses on certified food-grade and feed-grade formulations, while ChengDa Pharmaceuticals Co., Ltd. has built a competitive edge in animal nutrition solutions.

Smaller and emerging players are targeting niche categories such as vegan formulations and cost-effective solutions for price-sensitive markets. Their strategies include clean-label claims, plant-based sourcing, and functional beverage integration. Despite strong growth potential, challenges such as raw material price fluctuations, regulatory complexities, and the need for continuous innovation remain critical for long-term competitiveness.

Key Developments

Lonza announced its “One Lonza” restructuring strategy, consolidating its operations into three CDMO platforms: Integrated Biologics, Advanced Synthesis, and Specialized Modalities. The plan includes exiting the CHI business and targeting approximately 20% CER sales growth in 2025. This structural shift aims to enhance scalability, execution speed, and focus on high-value service models.

Scope of the Report

Item Value
Quantitative Units USD 242.7 Million
Grade Food Grade, Pharmaceutical Grade, and Feed Grade
Application Functional Drink, Medicine, Healthcare Product, Animal Food
End-use Fat Loss, Improved Heart Conditions, Kidney & Liver Treatment, Boosting Immunity, Improving Male Infertility, Brain Function, Bone Mass, Infant Nutrition, Anti-aging, Skin Care, Metabolism, Pain Relief
Regions Covered North America, Latin America, Europe, East Asia, South Asia, Oceania, the Middle East and Africa
Country Covered United States, Canada, United Kingdom, Germany, France, China, Japan, South Korea, Brazil, Australia , and 40+ countries
Key Companies Profiled Northeast Pharmaceutical Group Co., Ltd., Huanggang Huayang Pharmaceutical Co. , Ltd, Lonza Group Ltd., Ceva Santé Animale S.A., Tokyo Chemical Industry Co., Ltd., Kaiyuan Hengtai Chemical Co., Ltd, ChengDa Pharmaceuticals Co., Ltd., Huanggang Huayang Pharmaceutical Co. , Ltd., HuBeiYuancheng Saichuang Technology Co., Ltd., Cayman Chemical
Additional Attributes Dollar sales by product type and end-use sector, strong demand in weight management and fitness industries, increasing use in functional beverages and nutraceuticals, innovations in vegan and natural formulations, expanding presence in animal feed and pharmaceuticals for global markets

Key Segmentation

By Grade:

  • Food Grade
  • Pharmaceutical Grade
  • Feed Grade

By Application:

  • Functional Drink
  • Medicine
  • Healthcare Product
  • Animal Food

By End-use:

  • Fat Loss
  • Improved Heart Conditions
  • Kidney & Liver Treatment
  • Boosting Immunity
  • Improving Male Infertility
  • Brain Function
  • Bone Mass
  • Infant Nutrition
  • Anti-aging
  • Skin Care
  • Metabolism
  • Pain Relief

By Region:

  • North America
  • Latin America
  • Europe
  • East Asia
  • South Asia
  • Oceania
  • Middle East and Africa

Table of Content

  1. Executive Summary
    • Global Market Outlook
    • Demand-side Trends
    • Supply-side Trends
    • Technology Roadmap Analysis
    • Analysis and Recommendations
  2. Market Overview
    • Market Coverage / Taxonomy
    • Market Definition / Scope / Limitations
  3. Market Background
    • Market Dynamics
      • Drivers
      • Restraints
      • Opportunity
      • Trends
    • Scenario Forecast
      • Demand in Optimistic Scenario
      • Demand in Likely Scenario
      • Demand in Conservative Scenario
    • Opportunity Map Analysis
    • Product Life Cycle Analysis
    • Supply Chain Analysis
      • Supply Side Participants and their Roles
        • Producers
        • Mid-Level Participants (Traders/ Agents/ Brokers)
        • Wholesalers and Distributors
      • Value Added and Value Created at Node in the Supply Chain
      • List of Raw Material Suppliers
      • List of Existing and Potential Buyer’s
    • Investment Feasibility Matrix
    • Value Chain Analysis
      • Profit Margin Analysis
      • Wholesalers and Distributors
      • Retailers
    • PESTLE and Porter’s Analysis
    • Regulatory Landscape
      • By Key Regions
      • By Key Countries
    • Regional Parent Market Outlook
    • Production and Consumption Statistics
    • Import and Export Statistics
  4. Global Market Analysis 2020 to 2024 and Forecast, 2025 to 2035
    • Historical Market Size Value (USD Million) & Volume (Metric Tons) Analysis, 2020 to 2024
    • Current and Future Market Size Value (USD Million) & Volume (Metric Tons) Projections, 2025 to 2035
      • Y-o-Y Growth Trend Analysis
      • Absolute $ Opportunity Analysis
  5. Global Market Pricing Analysis 2020 to 2024 and Forecast 2025 to 2035
  6. Global Market Analysis 2020 to 2024 and Forecast 2025 to 2035, By Grade
    • Introduction / Key Findings
    • Historical Market Size Value (USD Million) & Volume (Metric Tons) Analysis By Grade, 2020 to 2024
    • Current and Future Market Size Value (USD Million) & Volume (Metric Tons) Analysis and Forecast By Grade, 2025 to 2035
      • Food Grade
      • Pharmaceutical Grade
      • Feed Grade
    • Y-o-Y Growth Trend Analysis By Grade, 2020 to 2024
    • Absolute $ Opportunity Analysis By Grade, 2025 to 2035
  7. Global Market Analysis 2020 to 2024 and Forecast 2025 to 2035, By Application
    • Introduction / Key Findings
    • Historical Market Size Value (USD Million) & Volume (Metric Tons) Analysis By Application, 2020 to 2024
    • Current and Future Market Size Value (USD Million) & Volume (Metric Tons) Analysis and Forecast By Application, 2025 to 2035
      • Functional Drink
      • Medicine
      • Healthcare Product
      • Animal Food
    • Y-o-Y Growth Trend Analysis By Application, 2020 to 2024
    • Absolute $ Opportunity Analysis By Application, 2025 to 2035
  8. Global Market Analysis 2020 to 2024 and Forecast 2025 to 2035, By End-use
    • Introduction / Key Findings
    • Historical Market Size Value (USD Million) & Volume (Metric Tons) Analysis By End-use, 2020 to 2024
    • Current and Future Market Size Value (USD Million) & Volume (Metric Tons) Analysis and Forecast By End-use, 2025 to 2035
      • Fat Loss
      • Improved Heart Conditions
      • Kedney & Liver Treatment
      • Boosting Immunity
      • Improving Male Infertility
      • Brain Fumction
      • Bone Mass
      • Infant Nutrition
      • Anti-aging
      • Skin Care
      • Metabolism
      • Pain Relief
    • Y-o-Y Growth Trend Analysis By End-use, 2020 to 2024
    • Absolute $ Opportunity Analysis By End-use, 2025 to 2035
  9. Global Market Analysis 2020 to 2024 and Forecast 2025 to 2035, By Region
    • Introduction
    • Historical Market Size Value (USD Million) & Volume (Metric Tons) Analysis By Region, 2020 to 2024
    • Current Market Size Value (USD Million) & Volume (Metric Tons) Analysis and Forecast By Region, 2025 to 2035
      • North America
      • Latin America
      • Western Europe
      • Eastern Europe
      • East Asia
      • South Asia & Pacific
      • Middle East and Africa
    • Market Attractiveness Analysis By Region
  10. North America Market Analysis 2020 to 2024 and Forecast 2025 to 2035, By Country
    • Historical Market Size Value (USD Million) & Volume (Metric Tons) Trend Analysis By Market Taxonomy, 2020 to 2024
    • Market Size Value (USD Million) & Volume (Metric Tons) Forecast By Market Taxonomy, 2025 to 2035
      • By Country
        • USA
        • Canada
        • Mexico
      • By Grade
      • By Application
      • By End-use
    • Market Attractiveness Analysis
      • By Country
      • By Grade
      • By Application
      • By End-use
    • Key Takeaways
  11. Latin America Market Analysis 2020 to 2024 and Forecast 2025 to 2035, By Country
    • Historical Market Size Value (USD Million) & Volume (Metric Tons) Trend Analysis By Market Taxonomy, 2020 to 2024
    • Market Size Value (USD Million) & Volume (Metric Tons) Forecast By Market Taxonomy, 2025 to 2035
      • By Country
        • Brazil
        • Argentina
        • Rest of LATAM
      • By Grade
      • By Application
      • By End-use
    • Market Attractiveness Analysis
      • By Country
      • By Grade
      • By Application
      • By End-use
    • Key Takeaways
  12. Western Europe Market Analysis 2020 to 2024 and Forecast 2025 to 2035, By Country
    • Historical Market Size Value (USD Million) & Volume (Metric Tons) Trend Analysis By Market Taxonomy, 2020 to 2024
    • Market Size Value (USD Million) & Volume (Metric Tons) Forecast By Market Taxonomy, 2025 to 2035
      • By Country
        • Germany
        • Italy
        • France
        • UK
        • Spain
        • BENELUX
        • Nordic
        • Rest of W.Europe
      • By Grade
      • By Application
      • By End-use
    • Market Attractiveness Analysis
      • By Country
      • By Grade
      • By Application
      • By End-use
    • Key Takeaways
  13. Eastern Europe Market Analysis 2020 to 2024 and Forecast 2025 to 2035, By Country
    • Historical Market Size Value (USD Million) & Volume (Metric Tons) Trend Analysis By Market Taxonomy, 2020 to 2024
    • Market Size Value (USD Million) & Volume (Metric Tons) Forecast By Market Taxonomy, 2025 to 2035
      • By Country
        • Russia
        • Hungary
        • Poland
        • Balkan & Baltics
        • Rest of E. Europe
      • By Grade
      • By Application
      • By End-use
    • Market Attractiveness Analysis
      • By Country
      • By Grade
      • By Application
      • By End-use
    • Key Takeaways
  14. East Asia Market Analysis 2020 to 2024 and Forecast 2025 to 2035, By Country
    • Historical Market Size Value (USD Million) & Volume (Metric Tons) Trend Analysis By Market Taxonomy, 2020 to 2024
    • Market Size Value (USD Million) & Volume (Metric Tons) Forecast By Market Taxonomy, 2025 to 2035
      • By Country
        • China
        • Japan
        • South Korea
      • By Grade
      • By Application
      • By End-use
    • Market Attractiveness Analysis
      • By Country
      • By Grade
      • By Application
      • By End-use
    • Key Takeaways
  15. South Asia & Pacific Market Analysis 2020 to 2024 and Forecast 2025 to 2035, By Country
    • Historical Market Size Value (USD Million) & Volume (Metric Tons) Trend Analysis By Market Taxonomy, 2020 to 2024
    • Market Size Value (USD Million) & Volume (Metric Tons) Forecast By Market Taxonomy, 2025 to 2035
      • By Country
        • India
        • Australia & New Zealand
        • ASEAN
        • Rest of SAP
      • By Grade
      • By Application
      • By End-use
    • Market Attractiveness Analysis
      • By Country
      • By Grade
      • By Application
      • By End-use
    • Key Takeaways
  16. Middle East and Africa Market Analysis 2020 to 2024 and Forecast 2025 to 2035, By Country
    • Historical Market Size Value (USD Million) & Volume (Metric Tons) Trend Analysis By Market Taxonomy, 2020 to 2024
    • Market Size Value (USD Million) & Volume (Metric Tons) Forecast By Market Taxonomy, 2025 to 2035
      • By Country
        • GCC Countries
        • Northern Africa
        • South Africa
        • Turkiye
        • Rest of MEA
      • By Grade
      • By Application
      • By End-use
    • Market Attractiveness Analysis
      • By Country
      • By Grade
      • By Application
      • By End-use
    • Key Takeaways
  17. Key Countries Market Analysis
    • USA
      • Pricing Analysis
      • Market Share Analysis, 2024
        • By Grade
        • By Application
        • By End-use
    • Canada
      • Pricing Analysis
      • Market Share Analysis, 2024
        • By Grade
        • By Application
        • By End-use
    • Brazil
      • Pricing Analysis
      • Market Share Analysis, 2024
        • By Grade
        • By Application
        • By End-use
    • Mexico
      • Pricing Analysis
      • Market Share Analysis, 2024
        • By Grade
        • By Application
        • By End-use
    • Argentina
      • Pricing Analysis
      • Market Share Analysis, 2024
        • By Grade
        • By Application
        • By End-use
  18. Market Structure Analysis
    • Competition Dashboard
    • Competition Benchmarking
    • Market Share Analysis of Top Players
      • By Regional
      • By Grade
      • By Application
      • By End-use
  19. Competition Analysis
    • Competition Deep Dive
      • Northeast Pharmaceutical Group Co., Ltd.
        • Overview
        • Product Portfolio
        • Profitability by Market Segments (Product/Age /Sales Channel/Region)
        • Sales Footprint
        • Strategy Overview
          • Marketing Strategy
          • Product Strategy
          • Channel Strategy
      • Huanggang Huayang Pharmaceutical Co., Ltd
        • Overview
        • Product Portfolio
        • Profitability by Market Segments (Product/Age /Sales Channel/Region)
        • Sales Footprint
        • Strategy Overview
          • Marketing Strategy
          • Product Strategy
          • Channel Strategy
      • Lonza Group Ltd.
        • Overview
        • Product Portfolio
        • Profitability by Market Segments (Product/Age /Sales Channel/Region)
        • Sales Footprint
        • Strategy Overview
          • Marketing Strategy
          • Product Strategy
          • Channel Strategy
      • Ceva Sante Animale S.A.
        • Overview
        • Product Portfolio
        • Profitability by Market Segments (Product/Age /Sales Channel/Region)
        • Sales Footprint
        • Strategy Overview
          • Marketing Strategy
          • Product Strategy
          • Channel Strategy
      • Tokyo Chemical Industry Co., Ltd.
        • Overview
        • Product Portfolio
        • Profitability by Market Segments (Product/Age /Sales Channel/Region)
        • Sales Footprint
        • Strategy Overview
          • Marketing Strategy
          • Product Strategy
          • Channel Strategy
      • Kaiyuan Hengtai Chemical Co., Ltd.
        • Overview
        • Product Portfolio
        • Profitability by Market Segments (Product/Age /Sales Channel/Region)
        • Sales Footprint
        • Strategy Overview
          • Marketing Strategy
          • Product Strategy
          • Channel Strategy
      • ChengDa Pharmaceuticals Co., Ltd.
        • Overview
        • Product Portfolio
        • Profitability by Market Segments (Product/Age /Sales Channel/Region)
        • Sales Footprint
        • Strategy Overview
          • Marketing Strategy
          • Product Strategy
          • Channel Strategy
      • HuBeiYuangcheng Saichuang Technology Co., Ltd.
        • Overview
        • Product Portfolio
        • Profitability by Market Segments (Product/Age /Sales Channel/Region)
        • Sales Footprint
        • Strategy Overview
          • Marketing Strategy
          • Product Strategy
          • Channel Strategy
      • Cayman Chemical
        • Overview
        • Product Portfolio
        • Profitability by Market Segments (Product/Age /Sales Channel/Region)
        • Sales Footprint
        • Strategy Overview
          • Marketing Strategy
          • Product Strategy
          • Channel Strategy
  20. Assumptions & Acronyms Used
  21. Research Methodology

List of Tables

  • Table 1: Global Market Value (USD Million) Forecast by Region, 2020 to 2035
  • Table 2: Global Market Volume (Metric Tons) Forecast by Region, 2020 to 2035
  • Table 3: Global Market Value (USD Million) Forecast by Grade, 2020 to 2035
  • Table 4: Global Market Volume (Metric Tons) Forecast by Grade, 2020 to 2035
  • Table 5: Global Market Value (USD Million) Forecast by Application, 2020 to 2035
  • Table 6: Global Market Volume (Metric Tons) Forecast by Application, 2020 to 2035
  • Table 7: Global Market Value (USD Million) Forecast by End-use, 2020 to 2035
  • Table 8: Global Market Volume (Metric Tons) Forecast by End-use, 2020 to 2035
  • Table 9: North America Market Value (USD Million) Forecast by Country, 2020 to 2035
  • Table 10: North America Market Volume (Metric Tons) Forecast by Country, 2020 to 2035
  • Table 11: North America Market Value (USD Million) Forecast by Grade, 2020 to 2035
  • Table 12: North America Market Volume (Metric Tons) Forecast by Grade, 2020 to 2035
  • Table 13: North America Market Value (USD Million) Forecast by Application, 2020 to 2035
  • Table 14: North America Market Volume (Metric Tons) Forecast by Application, 2020 to 2035
  • Table 15: North America Market Value (USD Million) Forecast by End-use, 2020 to 2035
  • Table 16: North America Market Volume (Metric Tons) Forecast by End-use, 2020 to 2035
  • Table 17: Latin America Market Value (USD Million) Forecast by Country, 2020 to 2035
  • Table 18: Latin America Market Volume (Metric Tons) Forecast by Country, 2020 to 2035
  • Table 19: Latin America Market Value (USD Million) Forecast by Grade, 2020 to 2035
  • Table 20: Latin America Market Volume (Metric Tons) Forecast by Grade, 2020 to 2035
  • Table 21: Latin America Market Value (USD Million) Forecast by Application, 2020 to 2035
  • Table 22: Latin America Market Volume (Metric Tons) Forecast by Application, 2020 to 2035
  • Table 23: Latin America Market Value (USD Million) Forecast by End-use, 2020 to 2035
  • Table 24: Latin America Market Volume (Metric Tons) Forecast by End-use, 2020 to 2035
  • Table 25: Western Europe Market Value (USD Million) Forecast by Country, 2020 to 2035
  • Table 26: Western Europe Market Volume (Metric Tons) Forecast by Country, 2020 to 2035
  • Table 27: Western Europe Market Value (USD Million) Forecast by Grade, 2020 to 2035
  • Table 28: Western Europe Market Volume (Metric Tons) Forecast by Grade, 2020 to 2035
  • Table 29: Western Europe Market Value (USD Million) Forecast by Application, 2020 to 2035
  • Table 30: Western Europe Market Volume (Metric Tons) Forecast by Application, 2020 to 2035
  • Table 31: Western Europe Market Value (USD Million) Forecast by End-use, 2020 to 2035
  • Table 32: Western Europe Market Volume (Metric Tons) Forecast by End-use, 2020 to 2035
  • Table 33: Eastern Europe Market Value (USD Million) Forecast by Country, 2020 to 2035
  • Table 34: Eastern Europe Market Volume (Metric Tons) Forecast by Country, 2020 to 2035
  • Table 35: Eastern Europe Market Value (USD Million) Forecast by Grade, 2020 to 2035
  • Table 36: Eastern Europe Market Volume (Metric Tons) Forecast by Grade, 2020 to 2035
  • Table 37: Eastern Europe Market Value (USD Million) Forecast by Application, 2020 to 2035
  • Table 38: Eastern Europe Market Volume (Metric Tons) Forecast by Application, 2020 to 2035
  • Table 39: Eastern Europe Market Value (USD Million) Forecast by End-use, 2020 to 2035
  • Table 40: Eastern Europe Market Volume (Metric Tons) Forecast by End-use, 2020 to 2035
  • Table 41: East Asia Market Value (USD Million) Forecast by Country, 2020 to 2035
  • Table 42: East Asia Market Volume (Metric Tons) Forecast by Country, 2020 to 2035
  • Table 43: East Asia Market Value (USD Million) Forecast by Grade, 2020 to 2035
  • Table 44: East Asia Market Volume (Metric Tons) Forecast by Grade, 2020 to 2035
  • Table 45: East Asia Market Value (USD Million) Forecast by Application, 2020 to 2035
  • Table 46: East Asia Market Volume (Metric Tons) Forecast by Application, 2020 to 2035
  • Table 47: East Asia Market Value (USD Million) Forecast by End-use, 2020 to 2035
  • Table 48: East Asia Market Volume (Metric Tons) Forecast by End-use, 2020 to 2035
  • Table 49: South Asia & Pacific Market Value (USD Million) Forecast by Country, 2020 to 2035
  • Table 50: South Asia & Pacific Market Volume (Metric Tons) Forecast by Country, 2020 to 2035
  • Table 51: South Asia & Pacific Market Value (USD Million) Forecast by Grade, 2020 to 2035
  • Table 52: South Asia & Pacific Market Volume (Metric Tons) Forecast by Grade, 2020 to 2035
  • Table 53: South Asia & Pacific Market Value (USD Million) Forecast by Application, 2020 to 2035
  • Table 54: South Asia & Pacific Market Volume (Metric Tons) Forecast by Application, 2020 to 2035
  • Table 55: South Asia & Pacific Market Value (USD Million) Forecast by End-use, 2020 to 2035
  • Table 56: South Asia & Pacific Market Volume (Metric Tons) Forecast by End-use, 2020 to 2035
  • Table 57: Middle East and Africa Market Value (USD Million) Forecast by Country, 2020 to 2035
  • Table 58: Middle East and Africa Market Volume (Metric Tons) Forecast by Country, 2020 to 2035
  • Table 59: Middle East and Africa Market Value (USD Million) Forecast by Grade, 2020 to 2035
  • Table 60: Middle East and Africa Market Volume (Metric Tons) Forecast by Grade, 2020 to 2035
  • Table 61: Middle East and Africa Market Value (USD Million) Forecast by Application, 2020 to 2035
  • Table 62: Middle East and Africa Market Volume (Metric Tons) Forecast by Application, 2020 to 2035
  • Table 63: Middle East and Africa Market Value (USD Million) Forecast by End-use, 2020 to 2035
  • Table 64: Middle East and Africa Market Volume (Metric Tons) Forecast by End-use, 2020 to 2035

List of Figures

  • Figure 1: Global Market Volume (Metric Tons) Forecast 2020 to 2035
  • Figure 2: Global Market Pricing Analysis
  • Figure 3: Global Market Value (USD Million) Forecast 2020 to 2035
  • Figure 4: Global Market Value Share and BPS Analysis by Grade, 2025 and 2035
  • Figure 5: Global Market Y-o-Y Growth Comparison by Grade, 2025 to 2035
  • Figure 6: Global Market Attractiveness Analysis by Grade
  • Figure 7: Global Market Value Share and BPS Analysis by Application, 2025 and 2035
  • Figure 8: Global Market Y-o-Y Growth Comparison by Application, 2025 to 2035
  • Figure 9: Global Market Attractiveness Analysis by Application
  • Figure 10: Global Market Value Share and BPS Analysis by End-use, 2025 and 2035
  • Figure 11: Global Market Y-o-Y Growth Comparison by End-use, 2025 to 2035
  • Figure 12: Global Market Attractiveness Analysis by End-use
  • Figure 13: Global Market Value (USD Million) Share and BPS Analysis by Region, 2025 and 2035
  • Figure 14: Global Market Y-o-Y Growth Comparison by Region, 2025 to 2035
  • Figure 15: Global Market Attractiveness Analysis by Region
  • Figure 16: North America Market Incremental $ Opportunity, 2025 to 2035
  • Figure 17: Latin America Market Incremental $ Opportunity, 2025 to 2035
  • Figure 18: Western Europe Market Incremental $ Opportunity, 2025 to 2035
  • Figure 19: Eastern Europe Market Incremental $ Opportunity, 2025 to 2035
  • Figure 20: East Asia Market Incremental $ Opportunity, 2025 to 2035
  • Figure 21: South Asia & Pacific Market Incremental $ Opportunity, 2025 to 2035
  • Figure 22: Middle East and Africa Market Incremental $ Opportunity, 2025 to 2035
  • Figure 23: North America Market Value Share and BPS Analysis by Country, 2025 and 2035
  • Figure 24: North America Market Value Share and BPS Analysis by Grade, 2025 and 2035
  • Figure 25: North America Market Y-o-Y Growth Comparison by Grade, 2025 to 2035
  • Figure 26: North America Market Attractiveness Analysis by Grade
  • Figure 27: North America Market Value Share and BPS Analysis by Application, 2025 and 2035
  • Figure 28: North America Market Y-o-Y Growth Comparison by Application, 2025 to 2035
  • Figure 29: North America Market Attractiveness Analysis by Application
  • Figure 30: North America Market Value Share and BPS Analysis by End-use, 2025 and 2035
  • Figure 31: North America Market Y-o-Y Growth Comparison by End-use, 2025 to 2035
  • Figure 32: North America Market Attractiveness Analysis by End-use
  • Figure 33: Latin America Market Value Share and BPS Analysis by Country, 2025 and 2035
  • Figure 34: Latin America Market Value Share and BPS Analysis by Grade, 2025 and 2035
  • Figure 35: Latin America Market Y-o-Y Growth Comparison by Grade, 2025 to 2035
  • Figure 36: Latin America Market Attractiveness Analysis by Grade
  • Figure 37: Latin America Market Value Share and BPS Analysis by Application, 2025 and 2035
  • Figure 38: Latin America Market Y-o-Y Growth Comparison by Application, 2025 to 2035
  • Figure 39: Latin America Market Attractiveness Analysis by Application
  • Figure 40: Latin America Market Value Share and BPS Analysis by End-use, 2025 and 2035
  • Figure 41: Latin America Market Y-o-Y Growth Comparison by End-use, 2025 to 2035
  • Figure 42: Latin America Market Attractiveness Analysis by End-use
  • Figure 43: Western Europe Market Value Share and BPS Analysis by Country, 2025 and 2035
  • Figure 44: Western Europe Market Value Share and BPS Analysis by Grade, 2025 and 2035
  • Figure 45: Western Europe Market Y-o-Y Growth Comparison by Grade, 2025 to 2035
  • Figure 46: Western Europe Market Attractiveness Analysis by Grade
  • Figure 47: Western Europe Market Value Share and BPS Analysis by Application, 2025 and 2035
  • Figure 48: Western Europe Market Y-o-Y Growth Comparison by Application, 2025 to 2035
  • Figure 49: Western Europe Market Attractiveness Analysis by Application
  • Figure 50: Western Europe Market Value Share and BPS Analysis by End-use, 2025 and 2035
  • Figure 51: Western Europe Market Y-o-Y Growth Comparison by End-use, 2025 to 2035
  • Figure 52: Western Europe Market Attractiveness Analysis by End-use
  • Figure 53: Eastern Europe Market Value Share and BPS Analysis by Country, 2025 and 2035
  • Figure 54: Eastern Europe Market Value Share and BPS Analysis by Grade, 2025 and 2035
  • Figure 55: Eastern Europe Market Y-o-Y Growth Comparison by Grade, 2025 to 2035
  • Figure 56: Eastern Europe Market Attractiveness Analysis by Grade
  • Figure 57: Eastern Europe Market Value Share and BPS Analysis by Application, 2025 and 2035
  • Figure 58: Eastern Europe Market Y-o-Y Growth Comparison by Application, 2025 to 2035
  • Figure 59: Eastern Europe Market Attractiveness Analysis by Application
  • Figure 60: Eastern Europe Market Value Share and BPS Analysis by End-use, 2025 and 2035
  • Figure 61: Eastern Europe Market Y-o-Y Growth Comparison by End-use, 2025 to 2035
  • Figure 62: Eastern Europe Market Attractiveness Analysis by End-use
  • Figure 63: East Asia Market Value Share and BPS Analysis by Country, 2025 and 2035
  • Figure 64: East Asia Market Value Share and BPS Analysis by Grade, 2025 and 2035
  • Figure 65: East Asia Market Y-o-Y Growth Comparison by Grade, 2025 to 2035
  • Figure 66: East Asia Market Attractiveness Analysis by Grade
  • Figure 67: East Asia Market Value Share and BPS Analysis by Application, 2025 and 2035
  • Figure 68: East Asia Market Y-o-Y Growth Comparison by Application, 2025 to 2035
  • Figure 69: East Asia Market Attractiveness Analysis by Application
  • Figure 70: East Asia Market Value Share and BPS Analysis by End-use, 2025 and 2035
  • Figure 71: East Asia Market Y-o-Y Growth Comparison by End-use, 2025 to 2035
  • Figure 72: East Asia Market Attractiveness Analysis by End-use
  • Figure 73: South Asia & Pacific Market Value Share and BPS Analysis by Country, 2025 and 2035
  • Figure 74: South Asia & Pacific Market Value Share and BPS Analysis by Grade, 2025 and 2035
  • Figure 75: South Asia & Pacific Market Y-o-Y Growth Comparison by Grade, 2025 to 2035
  • Figure 76: South Asia & Pacific Market Attractiveness Analysis by Grade
  • Figure 77: South Asia & Pacific Market Value Share and BPS Analysis by Application, 2025 and 2035
  • Figure 78: South Asia & Pacific Market Y-o-Y Growth Comparison by Application, 2025 to 2035
  • Figure 79: South Asia & Pacific Market Attractiveness Analysis by Application
  • Figure 80: South Asia & Pacific Market Value Share and BPS Analysis by End-use, 2025 and 2035
  • Figure 81: South Asia & Pacific Market Y-o-Y Growth Comparison by End-use, 2025 to 2035
  • Figure 82: South Asia & Pacific Market Attractiveness Analysis by End-use
  • Figure 83: Middle East and Africa Market Value Share and BPS Analysis by Country, 2025 and 2035
  • Figure 84: Middle East and Africa Market Value Share and BPS Analysis by Grade, 2025 and 2035
  • Figure 85: Middle East and Africa Market Y-o-Y Growth Comparison by Grade, 2025 to 2035
  • Figure 86: Middle East and Africa Market Attractiveness Analysis by Grade
  • Figure 87: Middle East and Africa Market Value Share and BPS Analysis by Application, 2025 and 2035
  • Figure 88: Middle East and Africa Market Y-o-Y Growth Comparison by Application, 2025 to 2035
  • Figure 89: Middle East and Africa Market Attractiveness Analysis by Application
  • Figure 90: Middle East and Africa Market Value Share and BPS Analysis by End-use, 2025 and 2035
  • Figure 91: Middle East and Africa Market Y-o-Y Growth Comparison by End-use, 2025 to 2035
  • Figure 92: Middle East and Africa Market Attractiveness Analysis by End-use
  • Figure 93: Global Market - Tier Structure Analysis
  • Figure 94: Global Market - Company Share Analysis

Frequently Asked Questions

What is the projected size of the L-carnitine supplements market in 2025?

The market size is valued at USD 242.7 million in 2025.

What is the outlook on L-carnitine supplements demand by 2035?

The market is forecasted to reach USD 434.6 million by 2035, reflecting a CAGR of 6%.

Which segment leads the L-carnitine supplements market in 2025?

The food grade segment is expected to lead the market with a 55% share in 2025.

What is the projected share of functional drinks in the L-carnitine market by 2025?

Functional drinks are projected to hold a 42% share of the market in 2025.

Which country is projected to have the fastest-growing L-carnitine supplements market?

The USA is anticipated to be the fastest-growing market with a CAGR of 5.8% from 2025 to 2035.

Explore Similar Insights

Future Market Insights

L-carnitine Supplements Market