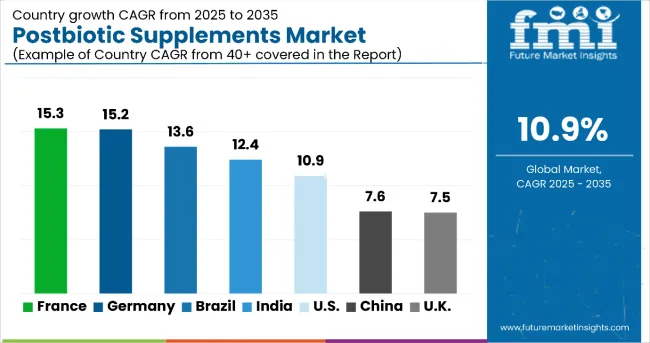
Postbiotic Supplements Market
Find Out with FMI How Postbiotic Supplements are Storming Dietary Supplements Industry in the U.K., France, Belgium, Germany, Korea, and 30+ Countries
Postbiotic Supplements Market by Form, Distribution Channel, & Region – Forecast for 2022 – 2032
Postbiotic Supplements Market Outlook 2022-2032
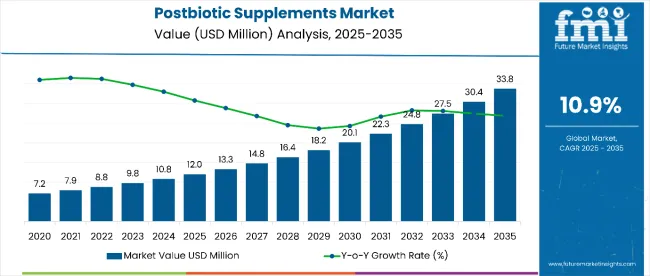
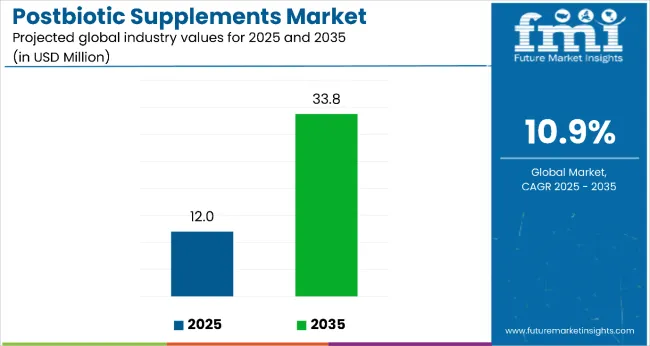
[350 Pages Report] Registering a year-on-year (Y-o-Y) growth of 11.1%, the global postbiotic supplements market is estimated to be valued at US$ 9.5 Mn in 2022. Furthermore, with rising awareness about the health benefits of products, the overall postbiotic supplements demand is likely to grow at a CAGR of 11.5% during the forecast period, totaling a valuation of US$ 28.3 Mn by 2032.
In recent years, postbiotic supplements have gained immense traction across the world due to their ability to improve human health and the trend is likely to continue during the forecast period.
Attribute |
Key Statistics |
Postbiotics Market Estimated Value (2022) |
US$ 9.5 Mn |
Projected Market Value (2032) |
US$ 28.3 Mn |
Value-based CAGR (2022-2032) |
11.5% CAGR |
Collective Value Share: Top 3 Countries (2021A) |
38.9% |
Postbiotics are bioactive compounds produced by probiotic bacteria by consuming prebiotics (fiber) or by feeding on various types of prebiotic foods. These postbiotics can be used to make various nutritional products including postbiotic supplements.
Growing awareness about the potential health benefits of postbiotic supplements is a key factor providing impetus to the growth of postbiotic supplements market. Postbiotic supplements improve the immune system, help to prevent or treat diarrhea, reduce symptoms associated with irritable bowel diseases and reduce allergies.
As they help to activate the innate and adaptive immune systems, preserve the integrity of the intestinal mucosal barrier, and combat pathogens using antimicrobial substances, similar to how probiotics work, postbiotics have primarily been linked to immunomodulatory actions.
Pili and protein p40/p75, which are postbiotics made by Lactobacillus species, are believed to have an immunomodulatory effect by acting to protect the intestinal barrier, factor proteins, bacteriocins, promote aggregation and S-layer proteins by displaying antagonistic movement against pathogens.
Similarly, rising prevalence of various digestive diseases including inflammatory bowel disease (IBD) is expected to push the demand for postbiotic supplements during the forecast period.
Over the years there has been a sharp rise in the cases of IBD across both developed and developing regions of the world. For instance, according to the Centers for Disease Control and Prevention (CDC), an estimated 3 million were diagnosed with IBD across the United States and this number is likely to further increase during the next few decades.
Postbiotic supplements are generally safe and can be easily purchased from health food stores, online shopping platforms, and other distribution channels. They find application in functional foods, pharmaceuticals, and dietary supplements. Increasing production and consumption of these products will therefore boost sales of postbiotic supplements during the forecast period.
Consumption and sales of postbiotic supplements are rising worldwide, especially in key countries like the US, Germany, and the U.K. No surprise that several giants are now focusing on launching postbiotic supplements with various claims and functional health benefits such as gut health, immune support, pollen support and many more.
Customers are progressively becoming conscious of the role a healthy digestive system plays in stimulating overall well-being. As a result, they are increasingly consuming products like prebiotics, probiotics as well as postbiotics. This will boost the growth of postbiotic supplements during the forecast period.
Let us know your requirement to get
100% FREE customization
2016-2021 Postbiotic Supplements Market Outlook Compared to 2022-2032 Forecast
The global postbiotic supplements demand grew at 7.6% CAGR between 2016 and 2021. However, with rising consumer awareness about postbiotics and their health benefits, the overall sales of postbiotic supplements are poised to rise at a prolific CAGR of 10.0% during the forecast period of 2022 and 2032.
The nonprofit organization International Scientific Association for Probiotics and Prebiotics (ISAPP) defined postbiotics as “a preparation of inanimate microorganisms and/or their components that confers a health benefit on the target host. These supplements are gradually taking over the health supplement and food & beverage industries due to their numerous health benefits.
The intrinsic stability of postbiotics, both during industrial processes and storage, is a significant factor influencing interest in them. Since many probiotic organisms are susceptible to oxygen and heat, maintaining the stability of live microorganisms is a technological difficulty, while solutions with long shelf lives can be easily accomplished for inanimate bacteria.
Additionally, postbiotics may be better suited than probiotics in areas without dependable cold chains or where the ambient temperature makes it difficult to store living microorganisms. The majority of products with a long shelf life will experience probiotic die-off during storage. It is challenging to generalise the percentage of dead cells included among different probiotic strains because rate of death during storage relies on physiological properties of the probiotic strain and storage settings.
Even though postbiotic supplements are new products, emerging trends reveal that this market will grow at an impressive growth rate during the next ten years.
Country-wise Insights
Why is the U.S. Considered a Prominent Postbiotic Supplements Market?
“Rising Prevalence of Digestive Disorders to Boost Market in the U.S.”
As per FMI, the U.S. postbiotic supplements market is anticipated to grow at a robust pace during the forecast period. This can be attributed to the growing consumption of healthy dietary supplements, presence of advanced manufacturing technologies, and strong presence of leading players.
The benefits that a healthy gut microbiome can have on human body’s immune, digestive, and neurological systems are increasingly becoming clear. Companies are becoming more aware of the microbiome, and their goal is to assist individuals and animals live longer, healthier lives.
The increased prevalence of functional and organic gastrointestinal (GI) illnesses suggests that an increasing number of people do not have adequate gut health. Food habits have changed as a result of changing lifestyles in both developed and developing economies.
Gut health has become one of North America's top health issues, particularly in the United States, as a consequence of increasing consumption of foods with high salt contents and changing lifestyles. Postbiotic supplements started out as digestive, but are moving toward new claims and new categories in the United States.
Today, a large portion of the U.S. population consumes supplements that are rich in postbiotics to improve their digestive health. This will continue to boost the U.S. postbiotic supplements market during the assessment period.
How Will Growth Unfold in German Postbiotic Supplements Market?
“Growing Demand for Vegan-friendly Supplements Propelling Sales in Germany”
The overall postbiotic supplements demand in Germany is likely to grow at a strong pace during the assessment period owing to rising trend of veganism and increasing investments in research and development.
Implementation of ground-breaking promotion policies has allowed plays in the postbiotic industry to grow at a noteworthy rate. With appropriate investment at each stage of research and development, manufacturers have worked towards increasing awareness about health benefits offered by vegan and natural supplements.
Over 20% Europeans follow some form of vegetarian or vegan diet. Growing number of Europeans seeking out vegan-friendly and natural supplements will therefore boost postbiotic supplements market in Germany over the next ten years.
Find your sweet spots for generating winning opportunities in this market.
Talk to AnalystCategory-wise Insights
Which Form of Postbiotic Supplements is More Popular in the Market?
“Capsules and Tablets Remain the Most Preferred Form of Postbiotic Supplements”
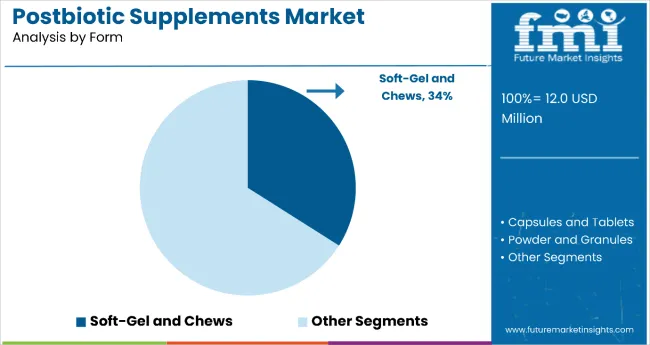
By form, the capsules and tablets segment is estimated to be valued at US$ 5,304 thousand in 2022 and further expand at 11.5% CAGR over the forecast period. This can be attributed to the rising consumer inclination towards consuming capsules and tablets due to their simple nature and better convenience.
Which Distribution Channel Will Generate Highest Revenues in the Market?
“Online Retailing Showing High Potential Growth”
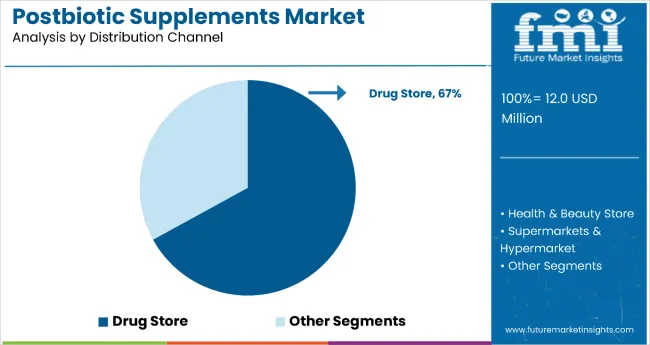
In terms of distribution channel, the online retailing segment is expected to grow at the fastest CAGR during the forecast period. This can be attributed to the rising consumer inclination towards purchasing postbiotic supplements through online platforms.
Rapid digitalization has resulted in a sturdy penetration of e-commerce in American, APEJ, and European countries. Online sales through e-commerce have added a lot of pressure to the industry and allowed it to grow with a better sales channel in a new way.
Various e-commerce businesses compete in the countries by announcing their own labels to expand their reach in the market. The increased marketing efforts of postbiotic supplements manufacturers and retailers, etc. enhanced social media promotion strategies is expected to drive growth of online retailing segment during the forecast period.
Competitive Landscape
Leading manufacturers of postbiotic supplements have recently been motivated to establish powerful brands and create products with long-term potential. This is due to the fact that modern consumers are concerned not just with the items' excellence but also with their provenance, packaging, and the purported business methods that went into their creation.
The development of strong brands and the production of products in packaging that is ecologically responsible and has a favourable public impression are therefore of utmost importance to the makers of postbiotic supplements.
Besides this, they are educating people about the effects that their products have on the environment and sustainability
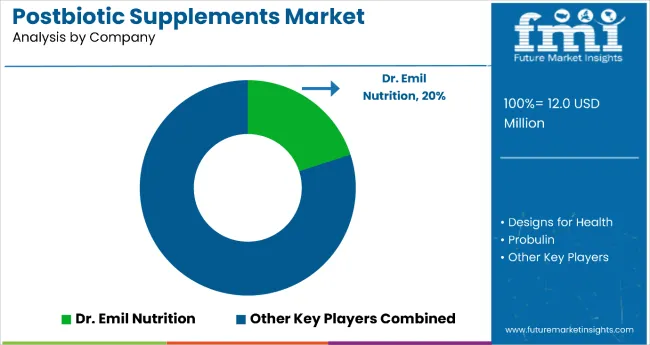
How Dr. Emil Nutrition, Designs for Health, and Glac Biotech are Helping Achieve Optimal Health with Power of Postbiotic Supplements
As the demand for health supplements continues to increase, companies like Dr. Emil Nutrition, Designs for Health, and Glac Biotech are ramping up their processes to deliver some of quality products to their customers.
Dr. Emil Nutrition is a sports nutrition company situated in Sheridan, Wyoming. The business provides protein packs, health and wellness supplements, and dietary supplements for both consumers and athletes that are supported by solid research and clinical evidence. These goods have a lot of promise and are devoid of hormones, hype, dairy, gluten, GMOs, gimmicks, and false guarantees.
In January 2022, Dr. Emil Nutrition launched Total Gut Complex which combines the benefits of prebiotics, probiotics, and postbiotics to create an all-in-one gut health nutritional supplement that provides an effective approach to stimulate, develop, and promote beneficial bacteria for improved gut health. With the gut containing 70% of the immune system, understanding and enhancing overall gut health is crucial as we confront ongoing public and personal health issues in the face of a worldwide pandemic.
Another manufacturer of postbiotic supplements is Design for Health. Designs for Health, a family-owned professional brand, only serves healthcare professionals and their patients with high-quality nutritional supplements and medical meals. The company's founding principle of "Science First" guides their uncompromising dedication to research-driven, synergistic formulations with substantial amounts of medicinal components, maximizing the potential for better treatment outcomes.
In July 2020, Designs for Health announced the addition of a new product, Tri-Butyrin SupremeTM to its gut health portfolio. Tri-Butyrin SupremeTM contains CoreBiomeTM, a patent-pending tri-butyrin form.
Glac Biotech is Asia's most inventive and forward-thinking probiotic firm. The company specializes in creating, producing, and selling advanced probiotic research and applications, as well as nutraceutical, culinary, agricultural, and animal feed sectors. Glac Biotech has been creating unique probiotic products to meet the trend of the healthcare industry since its inception in 2008, with the goal of becoming the world's leading biotech firm.
The company offers a range of products like pronulife & other probiotics, totipro postbiotics, and customized probiotics. Glac Biotech adheres to pharmaceutical standards, creates useful goods scientifically, and oversees product quality in accordance with pharmaceutical factory regulations. It is dedicated to offering probiotic products with a defined function, consistent composition, and dependability.
In April 2022, Glac Biotech, invested approximately US$ 14 million to launch the most sophisticated probiotic manufacturing facility this year in order to respond to rising market demands and strengthen proNEX probiotics manufacturing technology, known as the "Smart Instant Cooling Liquid Nitrogen System."

A unified Market Research Subscription Platform, built for today's disparate research needs.
Scope of Report
Attribute |
Details |
Estimated Market Size (2022) |
US$ 9.5 Mn |
Projected Market Size (2032) |
US$ 28.3 Mn |
Anticipated Growth Rate (2022-2032 |
10% CAGR |
Forecast Period |
2022-2032 |
Historical Data Available for |
2016-2021 |
Market Analysis |
MT for Volume and US$ Mn for Value |
Key Regions Covered |
North America, Latin America, Europe, East Asia, South Asia, Oceania and MEA |
Key Countries Covered |
United States, Canada, Brazil, Mexico, Argentina, Chile, Peru, Germany, France, Italy, Spain, UK, Netherlands, Belgium, Nordic, Russia, China, Japan, South Korea, India, Thailand, Malaysia, Indonesia, Singapore, Australia, New Zealand, GCC Countries, South Africa, Central Africa, North Africa, and others |
Key Market Segments Covered |
Form, Distribution Channel, and Region |
Key Companies Profiled |
|
Report Coverage |
Market Forecast, Company Share Analysis, Competitive Landscape, DROT Analysis, Market Dynamics and Challenges, and Strategic Growth Initiatives |
Postbiotic Supplements Market by Category
By Form:
- Soft-gel and Chews
- Capsules and Tablets
- Powder and Granules
By Distribution Channel:
- Health & Beauty Store
- Drug Store
- Modern Trade Channel (Supermarkets & Hypermarket)
- Online Retailing
By Region:
- North America
- Latin America
- Europe
- East Asia
- South Asia
- Oceania
- Middle East & Africa
Frequently Asked Questions
The postbiotic supplements market is estimated to nearly US$ 9.5 Mn in 2022.
Postbiotic supplements market sales are anticipated to increase at a CAGR of around 11.5% during the period 2022-2032.
The global postbiotic supplements market is estimated to reach a valuation of US$ 28.3 Mn by 2032.
Dr. Emil Nutrition, For The Biome, Designs for health, Beekeeper's Naturals, MaryRuth Organics, POSTBIOTICA SRL, Essential Formulas Incorporated, glac Biotech Co., Ltd. are some of the leading companies operating in the postbiotic supplements market.
The top countries driving the postbiotic supplements demand are the US, China, Japan, Germany, and the U.K.
Consumers' awareness of the importance of wellbeing and prevention and increasing demand for transparency and clean-label vegan-friendly supplements are the factors driving the growth of the postbiotic supplements market.
Table of Content
1. Executive Summary
1.1. Global Market Outlook
1.2. Demand-side Trends
1.3. Supply-side Trends
1.4. Technology Roadmap Analysis
1.5. Analysis and Recommendations
2. Market Overview
2.1. Market Coverage / Taxonomy
2.2. Market Definition / Scope / Limitations
3. Market Background
3.1. Market Dynamics
3.1.1. Drivers
3.1.2. Restraints
3.1.3. Opportunity
3.1.4. Trends
3.2. Scenario Forecast
3.2.1. Demand in Optimistic Scenario
3.2.2. Demand in Likely Scenario
3.2.3. Demand in Conservative Scenario
3.3. Product launches & Recent Developments
3.4. Product Life Cycle Analysis
3.5. Value Chain Analysis
3.5.1. Supply Side Participants and their Roles
3.5.1.1. Producers
3.5.1.2. Mid-Level Participants (Traders/ Agents/ Brokers)
3.5.1.3. Wholesalers and Distributors
3.5.2. % of Operating Margin Analysis
3.5.3. List of Raw Material Suppliers
3.5.4. List of Existing and Potential Buyer’s
3.6. Global Drinkable Yogurt Market - Pricing Analysis
3.6.1. Price Point Assessment by Region
3.6.2. Price Point Assessment by Product Type
3.6.3. Price Forecast till 2032
3.6.4. Factors affecting Pricing
3.7. Forecast Factors - Relevance & Impact
3.8. Regulatory Landscape
3.8.1. Packaging & Labelling Regulations
3.8.2. Certifications and Certifying Agency Overview
3.8.3. Import/Export Policies
3.9. Regional Parent Market Outlook
3.10. Consumers Survey Analysis
3.11. Macro-Economic Factors
3.12. Product Claims & Nutritional Information Scan by Buyers
4. Global Postbiotic Supplements Analysis 2016-2021 and Forecast, 2022-2032
4.1. Historical Market Size Value (US$ Mn) & Volume (MT) Analysis, 2016-2021
4.2. Current and Future Market Size Value (US$ Mn) & Volume (MT) Projections, 2022-2032
4.2.1. Y-o-Y Growth Trend Analysis
4.2.2. Absolute $ Opportunity Analysis
5. Global Postbiotic Supplements Analysis 2016-2021 and Forecast 2022-2032, By Form
5.1. Introduction / Key Findings
5.2. Historical Market Size Value (US$ Mn) & Volume (MT) Analysis By Form, 2016-2021
5.3. Current and Future Market Size Value (US$ Mn) & Volume (MT) Analysis and Forecast By Form, 2022-2032
5.3.1. Soft-gel and Chews
5.3.2. Capsules and Tablets
5.3.3. Powder and Granules
5.4. Y-o-Y Growth Trend Analysis By Form, 2016-2021
5.5. Absolute $ Opportunity Analysis By Form, 2022-2032
6. Global Postbiotic Supplements Analysis 2016-2021 and Forecast 2022-2032, By Distribution Channel
6.1. Introduction / Key Findings
6.2. Historical Market Size Value (US$ Mn) & Volume (MT) Analysis By Distribution Channel, 2016-2021
6.3. Current and Future Market Size Value (US$ Mn) & Volume (MT) Analysis and Forecast By Distribution Channel, 2022-2032
6.3.1. Health & Beauty Store
6.3.2. Drug Store
6.3.3. Modern Trade Channel (Supermarkets & Hypermarket)
6.3.4. Online Retailing
6.4. Y-o-Y Growth Trend Analysis By Distribution Channel, 2016-2021
6.5. Absolute $ Opportunity Analysis By Distribution Channel, 2022-2032
7. Global Postbiotic Supplements Analysis 2016-2021 and Forecast 2022-2032, By Region
7.1. Introduction
7.2. Historical Market Size Value (US$ Mn) & Volume (MT) Analysis By Region, 2016-2021
7.3. Current Market Size Value (US$ Mn) & Volume (MT) Analysis and Forecast By Region, 2022-2032
7.3.1. North America
7.3.2. Latin America
7.3.3. Europe
7.3.4. East Asia
7.3.5. South Asia
7.3.6. Oceania
7.3.7. MEA
7.4. Market Attractiveness Analysis By Region
8. North America Postbiotic Supplements Analysis 2016-2021 and Forecast 2022-2032, By Country
8.1. Historical Market Size Value (US$ Mn) & Volume (MT) Trend Analysis By Market Taxonomy, 2016-2021
8.2. Market Size Value (US$ Mn) & Volume (MT) Forecast By Market Taxonomy, 2022-2032
8.2.1. By Country
8.2.1.1. U.S.
8.2.1.2. Canada
8.2.2. By Form
8.2.3. By Distribution Channel
8.3. Market Attractiveness Analysis
8.3.1. By Country
8.3.2. By Form
8.3.3. By Distribution Channel
8.4. Key Takeaways
9. Latin America Postbiotic Supplements Analysis 2016-2021 and Forecast 2022-2032, By Country
9.1. Historical Market Size Value (US$ Mn) & Volume (MT) Trend Analysis By Market Taxonomy, 2016-2021
9.2. Market Size Value (US$ Mn) & Volume (MT) Forecast By Market Taxonomy, 2022-2032
9.2.1. By Country
9.2.1.1. Brazil
9.2.1.2. Mexico
9.2.1.3. Argentina
9.2.1.4. Chile
9.2.1.5. Peru
9.2.1.6. Rest of Latin America
9.2.2. By Form
9.2.3. By Distribution Channel
9.3. Market Attractiveness Analysis
9.3.1. By Country
9.3.2. By Form
9.3.3. By Distribution Channel
9.4. Key Takeaways
10. Europe Postbiotic Supplements Analysis 2016-2021 and Forecast 2022-2032, By Country
10.1. Historical Market Size Value (US$ Mn) & Volume (MT) Trend Analysis By Market Taxonomy, 2016-2021
10.2. Market Size Value (US$ Mn) & Volume (MT) Forecast By Market Taxonomy, 2022-2032
10.2.1. By Country
10.2.1.1. Germany
10.2.1.2. Italy
10.2.1.3. France
10.2.1.4. U.K.
10.2.1.5. Spain
10.2.1.6. Russia
10.2.1.7. BENELUX
10.2.1.8. Poland
10.2.1.9. Nordic Countries
10.2.1.10. Rest of Europe
10.2.2. By Form
10.2.3. By Distribution Channel
10.3. Market Attractiveness Analysis
10.3.1. By Country
10.3.2. By Form
10.3.3. By Distribution Channel
10.4. Key Takeaways
11. East Asia Postbiotic Supplements Analysis 2016-2021 and Forecast 2022-2032, By Country
11.1. Historical Market Size Value (US$ Mn) & Volume (MT) Trend Analysis By Market Taxonomy, 2016-2021
11.2. Market Size Value (US$ Mn) & Volume (MT) Forecast By Market Taxonomy, 2022-2032
11.2.1. By Country
11.2.1.1. China
11.2.1.2. Japan
11.2.1.3. South Korea
11.2.2. By Form
11.2.3. By Distribution Channel
11.3. Market Attractiveness Analysis
11.3.1. By Country
11.3.2. By Form
11.3.3. By Distribution Channel
11.4. Key Takeaways
12. South Asia Postbiotic Supplements Analysis 2016-2021 and Forecast 2022-2032, By Country
12.1. Historical Market Size Value (US$ Mn) & Volume (MT) Trend Analysis By Market Taxonomy, 2016-2021
12.2. Market Size Value (US$ Mn) & Volume (MT) Forecast By Market Taxonomy, 2022-2032
12.2.1. By Country
12.2.1.1. India
12.2.1.2. Thailand
12.2.1.3. Malaysia
12.2.1.4. Indonesia
12.2.1.5. Rest of South Asia
12.2.2. By Form
12.2.3. By Distribution Channel
12.3. Market Attractiveness Analysis
12.3.1. By Country
12.3.2. By Form
12.3.3. By Distribution Channel
12.4. Key Takeaways
13. Oceania Postbiotic Supplements Analysis 2016-2021 and Forecast 2022-2032, By Country
13.1. Historical Market Size Value (US$ Mn) & Volume (MT) Trend Analysis By Market Taxonomy, 2016-2021
13.2. Market Size Value (US$ Mn) & Volume (MT) Forecast By Market Taxonomy, 2022-2032
13.2.1. By Country
13.2.1.1. Australia
13.2.1.2. New Zealand
13.2.2. By Form
13.2.3. By Distribution Channel
13.3. Market Attractiveness Analysis
13.3.1. By Country
13.3.2. By Form
13.3.3. By Distribution Channel
13.4. Key Takeaways
14. MEA Postbiotic Supplements Analysis 2016-2021 and Forecast 2022-2032, By Country
14.1. Historical Market Size Value (US$ Mn) & Volume (MT) Trend Analysis By Market Taxonomy, 2016-2021
14.2. Market Size Value (US$ Mn) & Volume (MT) Forecast By Market Taxonomy, 2022-2032
14.2.1. By Country
14.2.1.1. GCC Countries
14.2.1.2. South Africa
14.2.1.3. Central Africa
14.2.1.4. North Africa
14.2.2. By Form
14.2.3. By Distribution Channel
14.3. Market Attractiveness Analysis
14.3.1. By Country
14.3.2. By Form
14.3.3. By Distribution Channel
14.4. Key Takeaways
15. Key Countries Postbiotic Supplements Analysis
15.1. U.S.
15.1.1. Pricing Analysis
15.1.2. Market Share Analysis, 2022
15.1.2.1. By Form
15.1.2.2. By Distribution Channel
15.2. Canada
15.2.1. Pricing Analysis
15.2.2. Market Share Analysis, 2022
15.2.2.1. By Form
15.2.2.2. By Distribution Channel
15.3. Brazil
15.3.1. Pricing Analysis
15.3.2. Market Share Analysis, 2022
15.3.2.1. By Form
15.3.2.2. By Distribution Channel
15.4. Mexico
15.4.1. Pricing Analysis
15.4.2. Market Share Analysis, 2022
15.4.2.1. By Form
15.4.2.2. By Distribution Channel
15.5. Argentina
15.5.1. Pricing Analysis
15.5.2. Market Share Analysis, 2022
15.5.2.1. By Form
15.5.2.2. By Distribution Channel
15.6. Chile
15.6.1. Pricing Analysis
15.6.2. Market Share Analysis, 2022
15.6.2.1. By Form
15.6.2.2. By Distribution Channel
15.7. Peru
15.7.1. Pricing Analysis
15.7.2. Market Share Analysis, 2022
15.7.2.1. By Form
15.7.2.2. By Distribution Channel
15.8. Germany
15.8.1. Pricing Analysis
15.8.2. Market Share Analysis, 2022
15.8.2.1. By Form
15.8.2.2. By Distribution Channel
15.9. Italy
15.9.1. Pricing Analysis
15.9.2. Market Share Analysis, 2022
15.9.2.1. By Form
15.9.2.2. By Distribution Channel
15.10. France
15.10.1. Pricing Analysis
15.10.2. Market Share Analysis, 2022
15.10.2.1. By Form
15.10.2.2. By Distribution Channel
15.11. Spain
15.11.1. Pricing Analysis
15.11.2. Market Share Analysis, 2022
15.11.2.1. By Form
15.11.2.2. By Distribution Channel
15.12. U.K.
15.12.1. Pricing Analysis
15.12.2. Market Share Analysis, 2021
15.12.2.1. By Form
15.12.2.2. By Distribution Channel
15.13. Russia
15.13.1. Pricing Analysis
15.13.2. Market Share Analysis, 2022
15.13.2.1. By Form
15.13.2.2. By Distribution Channel
15.14. Poland
15.14.1. Pricing Analysis
15.14.2. Market Share Analysis, 2022
15.14.2.1. By Form
15.14.2.2. By Distribution Channel
15.15. BENELUX
15.15.1. Pricing Analysis
15.15.2. Market Share Analysis, 2022
15.15.2.1. By Form
15.15.2.2. By Distribution Channel
15.16. Nordic Countries
15.16.1. Pricing Analysis
15.16.2. Market Share Analysis, 2022
15.16.2.1. By Form
15.16.2.2. By Distribution Channel
15.17. China
15.17.1. Pricing Analysis
15.17.2. Market Share Analysis, 2022
15.17.2.1. By Form
15.17.2.2. By Distribution Channel
15.18. Japan
15.18.1. Pricing Analysis
15.18.2. Market Share Analysis, 2022
15.18.2.1. By Form
15.18.2.2. By Distribution Channel
15.19. South Korea
15.19.1. Pricing Analysis
15.19.2. Market Share Analysis, 2022
15.19.2.1. By Form
15.19.2.2. By Distribution Channel
15.20. India
15.20.1. Pricing Analysis
15.20.2. Market Share Analysis, 2022
15.20.2.1. By Form
15.20.2.2. By Distribution Channel
15.21. Thailand
15.21.1. Pricing Analysis
15.21.2. Market Share Analysis, 2022
15.21.2.1. By Form
15.21.2.2. By Distribution Channel
15.22. Indonesia
15.22.1. Pricing Analysis
15.22.2. Market Share Analysis, 2022
15.22.2.1. By Form
15.22.2.2. By Distribution Channel
15.23. Malaysia
15.23.1. Pricing Analysis
15.23.2. Market Share Analysis, 2022
15.23.2.1. By Form
15.23.2.2. By Distribution Channel
15.24. Singapore
15.24.1. Pricing Analysis
15.24.2. Market Share Analysis, 2022
15.24.2.1. By Form
15.24.2.2. By Distribution Channel
15.25. GCC Countries
15.25.1. Pricing Analysis
15.25.2. Market Share Analysis, 2022
15.25.2.1. By Form
15.25.2.2. By Distribution Channel
15.26. South Africa
15.26.1. Pricing Analysis
15.26.2. Market Share Analysis, 2022
15.26.2.1. By Form
15.26.2.2. By Distribution Channel
15.27. Central Africa
15.27.1. Pricing Analysis
15.27.2. Market Share Analysis, 2022
15.27.2.1. By Form
15.27.2.2. By Distribution Channel
15.28. North Africa
15.28.1. Pricing Analysis
15.28.2. Market Share Analysis, 2022
15.28.2.1. By Form
15.28.2.2. By Distribution Channel
16. Market Structure Analysis
16.1. Competition Dashboard
16.2. Competition Benchmarking
16.3. Market Share Analysis of Top Players
16.3.1. By Regional
16.3.2. By Form
16.3.3. By Distribution Channel
17. Competition Analysis
17.1. Competition Deep Dive
17.1.1. Dr. Emil Nutrition
17.1.1.1. Overview
17.1.1.2. Product Portfolio
17.1.1.3. Profitability by Market Segments
17.1.1.4. Sales Footprint
17.1.1.5. Strategy Overview
17.1.1.5.1. Marketing Strategy
17.1.1.5.2. Product Strategy
17.1.1.5.3. Channel Strategy
17.1.2. For The Biome
17.1.2.1. Overview
17.1.2.2. Product Portfolio
17.1.2.3. Profitability by Market Segments
17.1.2.4. Sales Footprint
17.1.2.5. Strategy Overview
17.1.2.5.1. Marketing Strategy
17.1.2.5.2. Product Strategy
17.1.2.5.3. Channel Strategy
17.1.3. Designs for health
17.1.3.1. Overview
17.1.3.2. Product Portfolio
17.1.3.3. Profitability by Market Segments
17.1.3.4. Sales Footprint
17.1.3.5. Strategy Overview
17.1.3.5.1. Marketing Strategy
17.1.3.5.2. Product Strategy
17.1.3.5.3. Channel Strategy
17.1.4. Beekeeper's Naturals
17.1.4.1. Overview
17.1.4.2. Product Portfolio
17.1.4.3. Profitability by Market Segments
17.1.4.4. Sales Footprint
17.1.4.5. Strategy Overview
17.1.4.5.1. Marketing Strategy
17.1.4.5.2. Product Strategy
17.1.4.5.3. Channel Strategy
17.1.5. MaryRuth Organics
17.1.5.1. Overview
17.1.5.2. Product Portfolio
17.1.5.3. Profitability by Market Segments
17.1.5.4. Sales Footprint
17.1.5.5. Strategy Overview
17.1.5.5.1. Marketing Strategy
17.1.5.5.2. Product Strategy
17.1.5.5.3. Channel Strategy
17.1.6. POSTBIOTICA SRL
17.1.6.1. Overview
17.1.6.2. Product Portfolio
17.1.6.3. Profitability by Market Segments
17.1.6.4. Sales Footprint
17.1.6.5. Strategy Overview
17.1.6.5.1. Marketing Strategy
17.1.6.5.2. Product Strategy
17.1.6.5.3. Channel Strategy
17.1.7. Essential Formulas Incorporated (Dr. Ohhira's Probiotics)
17.1.7.1. Overview
17.1.7.2. Product Portfolio
17.1.7.3. Profitability by Market Segments
17.1.7.4. Sales Footprint
17.1.7.5. Strategy Overview
17.1.7.5.1. Marketing Strategy
17.1.7.5.2. Product Strategy
17.1.7.5.3. Channel Strategy
17.1.8. glac Biotech Co., Ltd.
17.1.8.1. Overview
17.1.8.2. Product Portfolio
17.1.8.3. Profitability by Market Segments
17.1.8.4. Sales Footprint
17.1.8.5. Strategy Overview
17.1.8.5.1. Marketing Strategy
17.1.8.5.2. Product Strategy
17.1.8.5.3. Channel Strategy
17.1.9. Others on request
17.1.9.1. Overview
17.1.9.2. Product Portfolio
17.1.9.3. Profitability by Market Segments
17.1.9.4. Sales Footprint
17.1.9.5. Strategy Overview
17.1.9.5.1. Marketing Strategy
17.1.9.5.2. Product Strategy
17.1.9.5.3. Channel Strategy
18. Assumptions & Acronyms Used
19. Research Methodology
Let us know your requirement to get
100% FREE customization
List of Tables
Table 1: Global Postbiotic Supplements Value (US$ Mn) Forecast by Region, 2016-2032
Table 2: Global Postbiotic Supplements Volume (MT) Forecast by Region, 2016-2032
Table 3: Global Postbiotic Supplements Value (US$ Mn) Forecast by Form, 2016-2032
Table 4: Global Postbiotic Supplements Volume (MT) Forecast by Form, 2016-2032
Table 5: Global Postbiotic Supplements Value (US$ Mn) Forecast by Distribution Channel, 2016-2032
Table 6: Global Postbiotic Supplements Volume (MT) Forecast by Distribution Channel, 2016-2032
Table 7: North America Postbiotic Supplements Value (US$ Mn) Forecast by Country, 2016-2032
Table 8: North America Postbiotic Supplements Volume (MT) Forecast by Country, 2016-2032
Table 9: North America Postbiotic Supplements Value (US$ Mn) Forecast by Form, 2016-2032
Table 10: North America Postbiotic Supplements Volume (MT) Forecast by Form, 2016-2032
Table 11: North America Postbiotic Supplements Value (US$ Mn) Forecast by Distribution Channel, 2016-2032
Table 12: North America Postbiotic Supplements Volume (MT) Forecast by Distribution Channel, 2016-2032
Table 13: Latin America Postbiotic Supplements Value (US$ Mn) Forecast by Country, 2016-2032
Table 14: Latin America Postbiotic Supplements Volume (MT) Forecast by Country, 2016-2032
Table 15: Latin America Postbiotic Supplements Value (US$ Mn) Forecast by Form, 2016-2032
Table 16: Latin America Postbiotic Supplements Volume (MT) Forecast by Form, 2016-2032
Table 17: Latin America Postbiotic Supplements Value (US$ Mn) Forecast by Distribution Channel, 2016-2032
Table 18: Latin America Postbiotic Supplements Volume (MT) Forecast by Distribution Channel, 2016-2032
Table 19: Europe Postbiotic Supplements Value (US$ Mn) Forecast by Country, 2016-2032
Table 20: Europe Postbiotic Supplements Volume (MT) Forecast by Country, 2016-2032
Table 21: Europe Postbiotic Supplements Value (US$ Mn) Forecast by Form, 2016-2032
Table 22: Europe Postbiotic Supplements Volume (MT) Forecast by Form, 2016-2032
Table 23: Europe Postbiotic Supplements Value (US$ Mn) Forecast by Distribution Channel, 2016-2032
Table 24: Europe Postbiotic Supplements Volume (MT) Forecast by Distribution Channel, 2016-2032
Table 25: East Asia Postbiotic Supplements Value (US$ Mn) Forecast by Country, 2016-2032
Table 26: East Asia Postbiotic Supplements Volume (MT) Forecast by Country, 2016-2032
Table 27: East Asia Postbiotic Supplements Value (US$ Mn) Forecast by Form, 2016-2032
Table 28: East Asia Postbiotic Supplements Volume (MT) Forecast by Form, 2016-2032
Table 29: East Asia Postbiotic Supplements Value (US$ Mn) Forecast by Distribution Channel, 2016-2032
Table 30: East Asia Postbiotic Supplements Volume (MT) Forecast by Distribution Channel, 2016-2032
Table 31: South Asia Postbiotic Supplements Value (US$ Mn) Forecast by Country, 2016-2032
Table 32: South Asia Postbiotic Supplements Volume (MT) Forecast by Country, 2016-2032
Table 33: South Asia Postbiotic Supplements Value (US$ Mn) Forecast by Form, 2016-2032
Table 34: South Asia Postbiotic Supplements Volume (MT) Forecast by Form, 2016-2032
Table 35: South Asia Postbiotic Supplements Value (US$ Mn) Forecast by Distribution Channel, 2016-2032
Table 36: South Asia Postbiotic Supplements Volume (MT) Forecast by Distribution Channel, 2016-2032
Table 37: Oceania Postbiotic Supplements Value (US$ Mn) Forecast by Country, 2016-2032
Table 38: Oceania Postbiotic Supplements Volume (MT) Forecast by Country, 2016-2032
Table 39: Oceania Postbiotic Supplements Value (US$ Mn) Forecast by Form, 2016-2032
Table 40: Oceania Postbiotic Supplements Volume (MT) Forecast by Form, 2016-2032
Table 41: Oceania Postbiotic Supplements Value (US$ Mn) Forecast by Distribution Channel, 2016-2032
Table 42: Oceania Postbiotic Supplements Volume (MT) Forecast by Distribution Channel, 2016-2032
Table 43: MEA Postbiotic Supplements Value (US$ Mn) Forecast by Country, 2016-2032
Table 44: MEA Postbiotic Supplements Volume (MT) Forecast by Country, 2016-2032
Table 45: MEA Postbiotic Supplements Value (US$ Mn) Forecast by Form, 2016-2032
Table 46: MEA Postbiotic Supplements Volume (MT) Forecast by Form, 2016-2032
Table 47: MEA Postbiotic Supplements Value (US$ Mn) Forecast by Distribution Channel, 2016-2032
Table 48: MEA Postbiotic Supplements Volume (MT) Forecast by Distribution Channel, 2016-2032
Find your sweet spots for generating winning opportunities in this market.
Talk to AnalystList of Charts
Figure 1: Global Postbiotic Supplements Value (US$ Mn) by Form, 2022-2032
Figure 2: Global Postbiotic Supplements Value (US$ Mn) by Distribution Channel, 2022-2032
Figure 3: Global Postbiotic Supplements Value (US$ Mn) by Region, 2022-2032
Figure 4: Global Postbiotic Supplements Value (US$ Mn) Analysis by Region, 2016-2032
Figure 5: Global Postbiotic Supplements Volume (MT) Analysis by Region, 2016-2032
Figure 6: Global Postbiotic Supplements Value Share (%) and BPS Analysis by Region, 2022-2032
Figure 7: Global Postbiotic Supplements Y-o-Y Growth (%) Projections by Region, 2022-2032
Figure 8: Global Postbiotic Supplements Value (US$ Mn) Analysis by Form, 2016-2032
Figure 9: Global Postbiotic Supplements Volume (MT) Analysis by Form, 2016-2032
Figure 10: Global Postbiotic Supplements Value Share (%) and BPS Analysis by Form, 2022-2032
Figure 11: Global Postbiotic Supplements Y-o-Y Growth (%) Projections by Form, 2022-2032
Figure 12: Global Postbiotic Supplements Value (US$ Mn) Analysis by Distribution Channel, 2016-2032
Figure 13: Global Postbiotic Supplements Volume (MT) Analysis by Distribution Channel, 2016-2032
Figure 14: Global Postbiotic Supplements Value Share (%) and BPS Analysis by Distribution Channel, 2022-2032
Figure 15: Global Postbiotic Supplements Y-o-Y Growth (%) Projections by Distribution Channel, 2022-2032
Figure 16: Global Postbiotic Supplements Attractiveness by Form, 2022-2032
Figure 17: Global Postbiotic Supplements Attractiveness by Distribution Channel, 2022-2032
Figure 18: Global Postbiotic Supplements Attractiveness by Region, 2022-2032
Figure 19: North America Postbiotic Supplements Value (US$ Mn) by Form, 2022-2032
Figure 20: North America Postbiotic Supplements Value (US$ Mn) by Distribution Channel, 2022-2032
Figure 21: North America Postbiotic Supplements Value (US$ Mn) by Country, 2022-2032
Figure 22: North America Postbiotic Supplements Value (US$ Mn) Analysis by Country, 2016-2032
Figure 23: North America Postbiotic Supplements Volume (MT) Analysis by Country, 2016-2032
Figure 24: North America Postbiotic Supplements Value Share (%) and BPS Analysis by Country, 2022-2032
Figure 25: North America Postbiotic Supplements Y-o-Y Growth (%) Projections by Country, 2022-2032
Figure 26: North America Postbiotic Supplements Value (US$ Mn) Analysis by Form, 2016-2032
Figure 27: North America Postbiotic Supplements Volume (MT) Analysis by Form, 2016-2032
Figure 28: North America Postbiotic Supplements Value Share (%) and BPS Analysis by Form, 2022-2032
Figure 29: North America Postbiotic Supplements Y-o-Y Growth (%) Projections by Form, 2022-2032
Figure 30: North America Postbiotic Supplements Value (US$ Mn) Analysis by Distribution Channel, 2016-2032
Figure 31: North America Postbiotic Supplements Volume (MT) Analysis by Distribution Channel, 2016-2032
Figure 32: North America Postbiotic Supplements Value Share (%) and BPS Analysis by Distribution Channel, 2022-2032
Figure 33: North America Postbiotic Supplements Y-o-Y Growth (%) Projections by Distribution Channel, 2022-2032
Figure 34: North America Postbiotic Supplements Attractiveness by Form, 2022-2032
Figure 35: North America Postbiotic Supplements Attractiveness by Distribution Channel, 2022-2032
Figure 36: North America Postbiotic Supplements Attractiveness by Country, 2022-2032
Figure 37: Latin America Postbiotic Supplements Value (US$ Mn) by Form, 2022-2032
Figure 38: Latin America Postbiotic Supplements Value (US$ Mn) by Distribution Channel, 2022-2032
Figure 39: Latin America Postbiotic Supplements Value (US$ Mn) by Country, 2022-2032
Figure 40: Latin America Postbiotic Supplements Value (US$ Mn) Analysis by Country, 2016-2032
Figure 41: Latin America Postbiotic Supplements Volume (MT) Analysis by Country, 2016-2032
Figure 42: Latin America Postbiotic Supplements Value Share (%) and BPS Analysis by Country, 2022-2032
Figure 43: Latin America Postbiotic Supplements Y-o-Y Growth (%) Projections by Country, 2022-2032
Figure 44: Latin America Postbiotic Supplements Value (US$ Mn) Analysis by Form, 2016-2032
Figure 45: Latin America Postbiotic Supplements Volume (MT) Analysis by Form, 2016-2032
Figure 46: Latin America Postbiotic Supplements Value Share (%) and BPS Analysis by Form, 2022-2032
Figure 47: Latin America Postbiotic Supplements Y-o-Y Growth (%) Projections by Form, 2022-2032
Figure 48: Latin America Postbiotic Supplements Value (US$ Mn) Analysis by Distribution Channel, 2016-2032
Figure 49: Latin America Postbiotic Supplements Volume (MT) Analysis by Distribution Channel, 2016-2032
Figure 50: Latin America Postbiotic Supplements Value Share (%) and BPS Analysis by Distribution Channel, 2022-2032
Figure 51: Latin America Postbiotic Supplements Y-o-Y Growth (%) Projections by Distribution Channel, 2022-2032
Figure 52: Latin America Postbiotic Supplements Attractiveness by Form, 2022-2032
Figure 53: Latin America Postbiotic Supplements Attractiveness by Distribution Channel, 2022-2032
Figure 54: Latin America Postbiotic Supplements Attractiveness by Country, 2022-2032
Figure 55: Europe Postbiotic Supplements Value (US$ Mn) by Form, 2022-2032
Figure 56: Europe Postbiotic Supplements Value (US$ Mn) by Distribution Channel, 2022-2032
Figure 57: Europe Postbiotic Supplements Value (US$ Mn) by Country, 2022-2032
Figure 58: Europe Postbiotic Supplements Value (US$ Mn) Analysis by Country, 2016-2032
Figure 59: Europe Postbiotic Supplements Volume (MT) Analysis by Country, 2016-2032
Figure 60: Europe Postbiotic Supplements Value Share (%) and BPS Analysis by Country, 2022-2032
Figure 61: Europe Postbiotic Supplements Y-o-Y Growth (%) Projections by Country, 2022-2032
Figure 62: Europe Postbiotic Supplements Value (US$ Mn) Analysis by Form, 2016-2032
Figure 63: Europe Postbiotic Supplements Volume (MT) Analysis by Form, 2016-2032
Figure 64: Europe Postbiotic Supplements Value Share (%) and BPS Analysis by Form, 2022-2032
Figure 65: Europe Postbiotic Supplements Y-o-Y Growth (%) Projections by Form, 2022-2032
Figure 66: Europe Postbiotic Supplements Value (US$ Mn) Analysis by Distribution Channel, 2016-2032
Figure 67: Europe Postbiotic Supplements Volume (MT) Analysis by Distribution Channel, 2016-2032
Figure 68: Europe Postbiotic Supplements Value Share (%) and BPS Analysis by Distribution Channel, 2022-2032
Figure 69: Europe Postbiotic Supplements Y-o-Y Growth (%) Projections by Distribution Channel, 2022-2032
Figure 70: Europe Postbiotic Supplements Attractiveness by Form, 2022-2032
Figure 71: Europe Postbiotic Supplements Attractiveness by Distribution Channel, 2022-2032
Figure 72: Europe Postbiotic Supplements Attractiveness by Country, 2022-2032
Figure 73: East Asia Postbiotic Supplements Value (US$ Mn) by Form, 2022-2032
Figure 74: East Asia Postbiotic Supplements Value (US$ Mn) by Distribution Channel, 2022-2032
Figure 75: East Asia Postbiotic Supplements Value (US$ Mn) by Country, 2022-2032
Figure 76: East Asia Postbiotic Supplements Value (US$ Mn) Analysis by Country, 2016-2032
Figure 77: East Asia Postbiotic Supplements Volume (MT) Analysis by Country, 2016-2032
Figure 78: East Asia Postbiotic Supplements Value Share (%) and BPS Analysis by Country, 2022-2032
Figure 79: East Asia Postbiotic Supplements Y-o-Y Growth (%) Projections by Country, 2022-2032
Figure 80: East Asia Postbiotic Supplements Value (US$ Mn) Analysis by Form, 2016-2032
Figure 81: East Asia Postbiotic Supplements Volume (MT) Analysis by Form, 2016-2032
Figure 82: East Asia Postbiotic Supplements Value Share (%) and BPS Analysis by Form, 2022-2032
Figure 83: East Asia Postbiotic Supplements Y-o-Y Growth (%) Projections by Form, 2022-2032
Figure 84: East Asia Postbiotic Supplements Value (US$ Mn) Analysis by Distribution Channel, 2016-2032
Figure 85: East Asia Postbiotic Supplements Volume (MT) Analysis by Distribution Channel, 2016-2032
Figure 86: East Asia Postbiotic Supplements Value Share (%) and BPS Analysis by Distribution Channel, 2022-2032
Figure 87: East Asia Postbiotic Supplements Y-o-Y Growth (%) Projections by Distribution Channel, 2022-2032
Figure 88: East Asia Postbiotic Supplements Attractiveness by Form, 2022-2032
Figure 89: East Asia Postbiotic Supplements Attractiveness by Distribution Channel, 2022-2032
Figure 90: East Asia Postbiotic Supplements Attractiveness by Country, 2022-2032
Figure 91: South Asia Postbiotic Supplements Value (US$ Mn) by Form, 2022-2032
Figure 92: South Asia Postbiotic Supplements Value (US$ Mn) by Distribution Channel, 2022-2032
Figure 93: South Asia Postbiotic Supplements Value (US$ Mn) by Country, 2022-2032
Figure 94: South Asia Postbiotic Supplements Value (US$ Mn) Analysis by Country, 2016-2032
Figure 95: South Asia Postbiotic Supplements Volume (MT) Analysis by Country, 2016-2032
Figure 96: South Asia Postbiotic Supplements Value Share (%) and BPS Analysis by Country, 2022-2032
Figure 97: South Asia Postbiotic Supplements Y-o-Y Growth (%) Projections by Country, 2022-2032
Figure 98: South Asia Postbiotic Supplements Value (US$ Mn) Analysis by Form, 2016-2032
Figure 99: South Asia Postbiotic Supplements Volume (MT) Analysis by Form, 2016-2032
Figure 100: South Asia Postbiotic Supplements Value Share (%) and BPS Analysis by Form, 2022-2032
Figure 101: South Asia Postbiotic Supplements Y-o-Y Growth (%) Projections by Form, 2022-2032
Figure 102: South Asia Postbiotic Supplements Value (US$ Mn) Analysis by Distribution Channel, 2016-2032
Figure 103: South Asia Postbiotic Supplements Volume (MT) Analysis by Distribution Channel, 2016-2032
Figure 104: South Asia Postbiotic Supplements Value Share (%) and BPS Analysis by Distribution Channel, 2022-2032
Figure 105: South Asia Postbiotic Supplements Y-o-Y Growth (%) Projections by Distribution Channel, 2022-2032
Figure 106: South Asia Postbiotic Supplements Attractiveness by Form, 2022-2032
Figure 107: South Asia Postbiotic Supplements Attractiveness by Distribution Channel, 2022-2032
Figure 108: South Asia Postbiotic Supplements Attractiveness by Country, 2022-2032
Figure 109: Oceania Postbiotic Supplements Value (US$ Mn) by Form, 2022-2032
Figure 110: Oceania Postbiotic Supplements Value (US$ Mn) by Distribution Channel, 2022-2032
Figure 111: Oceania Postbiotic Supplements Value (US$ Mn) by Country, 2022-2032
Figure 112: Oceania Postbiotic Supplements Value (US$ Mn) Analysis by Country, 2016-2032
Figure 113: Oceania Postbiotic Supplements Volume (MT) Analysis by Country, 2016-2032
Figure 114: Oceania Postbiotic Supplements Value Share (%) and BPS Analysis by Country, 2022-2032
Figure 115: Oceania Postbiotic Supplements Y-o-Y Growth (%) Projections by Country, 2022-2032
Figure 116: Oceania Postbiotic Supplements Value (US$ Mn) Analysis by Form, 2016-2032
Figure 117: Oceania Postbiotic Supplements Volume (MT) Analysis by Form, 2016-2032
Figure 118: Oceania Postbiotic Supplements Value Share (%) and BPS Analysis by Form, 2022-2032
Figure 119: Oceania Postbiotic Supplements Y-o-Y Growth (%) Projections by Form, 2022-2032
Figure 120: Oceania Postbiotic Supplements Value (US$ Mn) Analysis by Distribution Channel, 2016-2032
Figure 121: Oceania Postbiotic Supplements Volume (MT) Analysis by Distribution Channel, 2016-2032
Figure 122: Oceania Postbiotic Supplements Value Share (%) and BPS Analysis by Distribution Channel, 2022-2032
Figure 123: Oceania Postbiotic Supplements Y-o-Y Growth (%) Projections by Distribution Channel, 2022-2032
Figure 124: Oceania Postbiotic Supplements Attractiveness by Form, 2022-2032
Figure 125: Oceania Postbiotic Supplements Attractiveness by Distribution Channel, 2022-2032
Figure 126: Oceania Postbiotic Supplements Attractiveness by Country, 2022-2032
Figure 127: MEA Postbiotic Supplements Value (US$ Mn) by Form, 2022-2032
Figure 128: MEA Postbiotic Supplements Value (US$ Mn) by Distribution Channel, 2022-2032
Figure 129: MEA Postbiotic Supplements Value (US$ Mn) by Country, 2022-2032
Figure 130: MEA Postbiotic Supplements Value (US$ Mn) Analysis by Country, 2016-2032
Figure 131: MEA Postbiotic Supplements Volume (MT) Analysis by Country, 2016-2032
Figure 132: MEA Postbiotic Supplements Value Share (%) and BPS Analysis by Country, 2022-2032
Figure 133: MEA Postbiotic Supplements Y-o-Y Growth (%) Projections by Country, 2022-2032
Figure 134: MEA Postbiotic Supplements Value (US$ Mn) Analysis by Form, 2016-2032
Figure 135: MEA Postbiotic Supplements Volume (MT) Analysis by Form, 2016-2032
Figure 136: MEA Postbiotic Supplements Value Share (%) and BPS Analysis by Form, 2022-2032
Figure 137: MEA Postbiotic Supplements Y-o-Y Growth (%) Projections by Form, 2022-2032
Figure 138: MEA Postbiotic Supplements Value (US$ Mn) Analysis by Distribution Channel, 2016-2032
Figure 139: MEA Postbiotic Supplements Volume (MT) Analysis by Distribution Channel, 2016-2032
Figure 140: MEA Postbiotic Supplements Value Share (%) and BPS Analysis by Distribution Channel, 2022-2032
Figure 141: MEA Postbiotic Supplements Y-o-Y Growth (%) Projections by Distribution Channel, 2022-2032
Figure 142: MEA Postbiotic Supplements Attractiveness by Form, 2022-2032
Figure 143: MEA Postbiotic Supplements Attractiveness by Distribution Channel, 2022-2032
Figure 144: MEA Postbiotic Supplements Attractiveness by Country, 2022-2032
Need specific information?
Request CustomizationExplore Food and Beverage Insights
View Reports