Pre-Workout Supplements Market Size and Share Forecast Outlook 2025 to 2035

The global pre-workout supplements market is valued at USD 21.7 billion in 2025 and is expected to reach USD 44.7 billion by 2035, reflecting a CAGR of 7.5%.
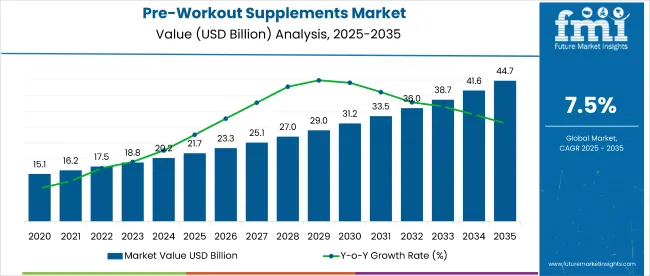
Quick Stats for Pre-Workout Supplements Market

  • Market Value (2025): USD 21.7 billion
  • Forecast Value (2035): USD 44.7 billion
  • Forecast CAGR: 7.5%
  • Form Leader in 2025: Powdered Supplements (56% Market Share)
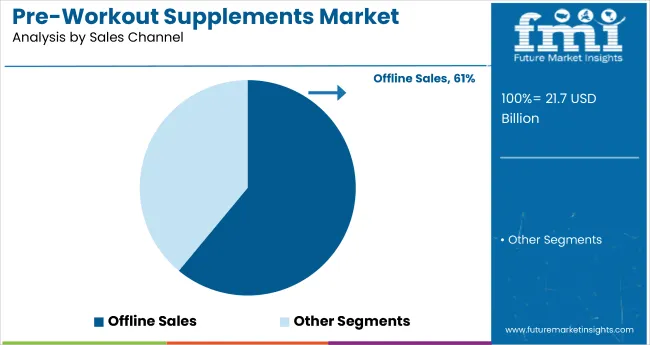
  • Top Sales Channel: Offline Sales (61% Market Share)
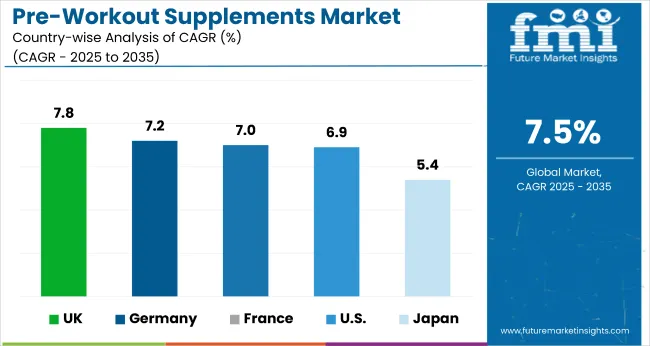
  • Key Growth Region: Europe (UK is the fastest-growing market with 7.8% CAGR)

Pre Workout Supplements Market

Metric Value
Estimated Size (2025E) USD 21.7 billion
Projected Value (2035F) USD 44.7 billion
CAGR (2025 to 2035) 7.5%

Market expansion is driven by increased health awareness, demand for performance-enhancing nutrition, and the popularity of high-intensity fitness regimes. Rising participation in recreational and professional sports, along with growing gym memberships globally, is further fueling demand for specialized pre-workout formulations.

The market holds approximately 21% of the global sports nutrition market, reflecting its strong presence among fitness-focused consumers. Within the broader dietary supplements market, it contributes around 8%, driven by the growing demand for energy-boosting formulations.

The segment captures nearly 6% of the functional food & beverages market, owing to innovations in ready-to-drink formats. In the expansive health & wellness market, it holds close to 4%, while within the fitness and performance nutrition market, its share rises to 28%, making it one of the fastest-growing subcategories in the sector.

Government regulations impacting the market focus on support for fitness initiatives and health awareness campaigns, particularly in countries like India and the UK. Key companies are focusing on proprietary ingredient formulations and expanding their digital retail presence to strengthen market positioning.

In addition, the rising popularity of personalized nutrition and subscription-based supplement models is expected to create new growth opportunities for industry players. The integration of AI-driven fitness tracking and supplement recommendation tools is also anticipated to enhance consumer engagement and product efficacy.

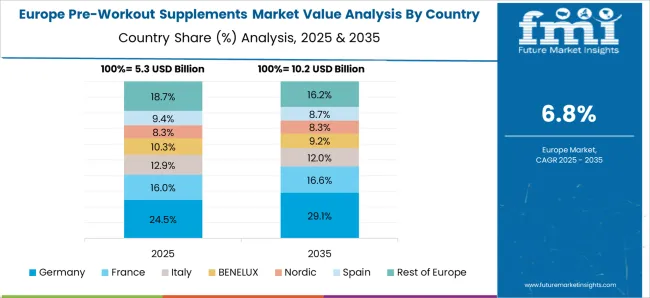
Europe is expected to retain the largest share of the global pre-workout supplements market in 2025, led by the UK with a 7.8% CAGR. Meanwhile, Germany and France closely follow this rapid growth with respective CAGRs of 7.2% and 7.0% through 2035.

Powdered supplements are set to remain the preferred product form with a 56% share, driven by customizable nutrition and convenience. Offline channels will continue leading the distribution segment with a 61% market share in 2025.

Analyzing Pre-Workout Supplements Market by Top Investment Segment

The pre-workout supplements market is segmented into form, sales channel, and region. By segment, the market includes powder, ready to drink, and capsule/tablets.

Based on sales channel, the market categorized into offline sales channel (supermarkets/hypermarkets, departmental stores, convenience stores, other sales channel (including specialty nutrition stores and fitness clubs) and online sales channel (company website and e-commerce platform).

Regionally, the market is divided classified into North America, Latin America, Western Europe, Eastern Europe, Balkans & Baltic, Russia & Belarus, Central Asia, East Asia, South Asia & Pacific, Middle East & Africa.
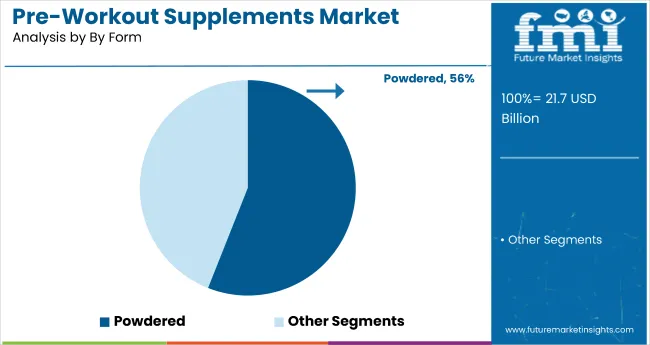
Powdered to Lead the Form Segment with 56% Market Share

Pre Workout Supplements Market Analysis By Form

Powdered pre-workout supplements are expected to dominate the type segment, accounting for a 56% of the global market share in 2025. These supplements are widely preferred due to their customizability, shelf stability, and cost-effectiveness. Fitness enthusiasts and athletes favor powders as they can tailor dosage and mix with other ingredients for the desired taste or nutrition. Their availability in multiple flavors and pack sizes supports broader consumer appeal, especially among regular gym-goers.
  • Widely preferred for customizable dosing and better absorption
  • Clean-label powdered variants are gaining popularity
  • Often paired with smoothies or fruit-based drinks for enhanced nutrition

Offline Sales to Lead the Sales Channel Segment with 61% Market Share

Pre Workout Supplements Market Analysis By Sales Channel

Offline sales channels are projected to lead the sales channel segment, accounting for 61% of global market share in 2025. Supermarkets, departmental stores, and fitness specialty outlets continue to dominate due to consumer preference for in-person consultation and physical verification of products. Offline availability also supports impulse purchases and immediate fulfillment. Despite online growth, brick-and-mortar stores remain essential for brand visibility and trust-building.

  • Supermarkets and hypermarkets dominate due to their wide accessibility
  • Gym partnerships help in promoting supplements in-store
  • Product sampling and in-store experts boost offline conversions

Top Pre-Workout Supplement Market Dynamics

The global pre-workout supplements market has been experiencing steady growth, driven by increasing health consciousness, the rise of high-intensity training programs, and growing interest in sports nutrition across all age groups. Consumers are actively seeking performance-enhancing formulations that boost energy, endurance, and focus during workouts, leading to strong demand for pre-workout products with functional ingredients like caffeine, beta-alanine, and creatine.

Recent Trends in the Pre-Workout Supplements Market
  • Rising demand for clean-label and organic pre-workout supplements among health-conscious consumers.
  • Increased popularity of ready-to-drink pre-workout formats for on-the-go convenience.
  • Growing adoption of personalized nutrition and ingredient transparency.
  • Expansion of e-commerce platforms is driving digital product visibility and access.

Key Challenges in the Pre-Workout Supplements Market

  • Regulatory complexities around health claims and ingredient approvals in different regions.
  • High product cost compared to traditional fitness foods, limiting access in price-sensitive markets.
  • Consumer skepticism regarding artificial stimulants and synthetic additives.
  • Intense market competition is creating pressure on pricing and innovation cycles.

Top Countries Manufacturing, Using and Supplying Pre-Workout Supplements

Country Wise Analysis Of Pre Workout Supplements Market

The UK leads the pre-workout supplements market driven by strong consumer demand for formulations that enhance stamina, muscle pumps, and mental focus.

In Germany and France, growth rates of 7.2% and 7.0%, respectively, are being recorded due to rising demand for clean-label and functional nutrition. While, the USA market is projected to grow at 6.9% CAGR and Japan, at a CAGR of 5.4%.

The report covers an in-depth analysis of 40+ countries; with the five top-performing OECD nations highlighted below.
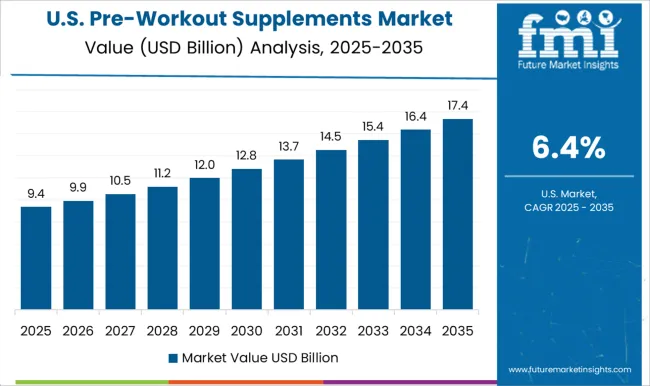
In-depth Analysis of Pre-Workout Supplements in the USA

The pre-workout supplements revenue in the USA is growing at a CAGR of 6.9% from 2025 to 2035. The country leads global demand due to a high concentration of fitness enthusiasts, strong penetration of gym chains, and a well-established supplement industry.

American consumers prioritize performance and recovery, driving innovation among leading manufacturers. As regulations favor ingredient transparency, new launches targeting vegan and stimulant-free needs are gaining traction, solidifying the country’s dominant position in this sector.

  • Growing awareness of health and fitness among the population.
  • Proliferation of clean-label and vegan supplement options.
  • E-commerce expansion through platforms like Amazon and direct-to-consumer brands.

Growth Outlook for Pre-Workout Supplements in the UK

The sales of pre-workout supplements in the UK are expanding at a CAGR of 7.8% during the forecast period. growth is driven by rising disposable income and heightened health consciousness, which have resulted in increased gym memberships and greater use of fitness nutrition products.

A surge in fitness influencer marketing and growing interest in body transformation programs are also driving product visibility and usage. The UK’s regulatory framework encourages product labeling transparency, enabling consumer trust in branded and private-label offerings.
  • High consumer demand for sugar-free and stimulant-free pre-workout products.
  • Influencer-led fitness trends shaping consumer preferences.
  • Strong retail presence both online and offline.

Demand Trajectory of Pre-Workout Supplements in Germany

The demand for pre-workout supplements in Germany is projected to grow at a CAGR of 7.2% from 2025 to 2035. Growth is driven by strong demand for scientifically backed and premium-quality formulations, particularly among athletes and sports professionals. German consumers place high importance on ingredient safety and efficacy. As fitness culture expands across demographics, powdered and capsule forms remain highly preferred.

  • Premium and scientifically formulated supplements are in high demand.
  • Strong preference for EU-compliant, clean-label products.
  • Sustainable packaging trends influencing product appeal.

Analysis of Pre-Workout Supplements in France

The pre-workout supplements market in France is projected to grow at a CAGR of 7.0% from 2025 to 2035. French consumers are increasingly engaging in wellness routines, fitness classes, and at-home workouts, which has accelerated supplement consumption. There is a growing preference for stimulant-free products, aligning with the national shift toward holistic health. The urban youth segment is particularly receptive to powdered and ready-to-drink formats with natural flavors and organic certification.

  • Increasing consumer focus on holistic and plant-based nutrition.
  • E-commerce channels are driving greater product accessibility.
  • Rising adoption of at-home fitness is fueling supplement demand.

Analysis of Pre-Workout Supplements in Japan

The pre-workout supplements market in Japan is projected to grow at a CAGR of 5.4% from 2025 to 2035. The country’s aging population is driving interest in functional nutrition for energy, endurance, and muscle maintenance. Japanese consumers value minimalistic, high-purity ingredients and are cautious about stimulants. The rise of fitness centers and wellness apps is creating awareness among younger generations.
  • Demand for functional supplements focused on endurance and recovery.
  • Integration of traditional ingredients like matcha and ginseng.
  • Health-focused e-commerce and wellness platforms supporting growth.

Leading Pre-Workout Supplements Suppliers

Pre Workout Supplements Market Analysis By Company

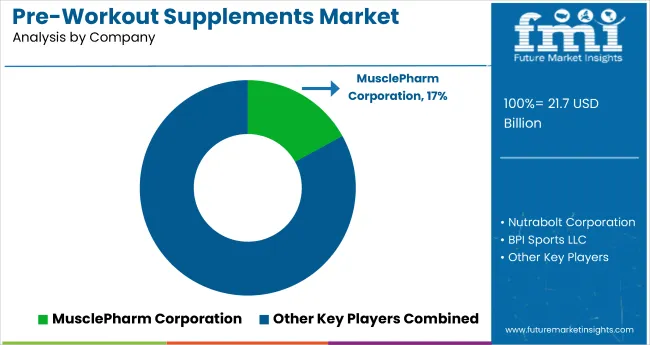
The pre-workout supplements market is moderately fragmented, with a mix of global players and niche fitness-focused brands competing across developed and emerging regions. Leading companies such as Muscle Pharm Corporation, Nutrabolt Corporation, BPI Sports LLC, Magnum Nutraceuticals, and GAT Sport are focusing on expanding their portfolios with clean-label, stimulant-free, and vegan formulations to cater to shifting consumer preferences.

Top players are adopting strategies such as competitive pricing, athlete and gym partnerships, and aggressive e-commerce expansion. Product innovation remains a core focus, with new ingredient formulations targeting energy, endurance, and recovery. Several brands are also enhancing their DTC (Direct-to-Consumer) reach by investing in personalized nutrition platforms and subscription-based services. Meanwhile, international expansion, particularly into Asia Pacific and Europe, is being pursued through distribution collaborations and retail tie-ups.

Recent Pre-Workout Supplements Industry News

  • In February 2025, Nutrabolt renewed its high-profile partnership with the Boston Celtics, reinforcing C4’s position as a leading sports nutrition brand.
  • In 2024, FitLife Brands, Inc. completed the acquisition of substantially all assets of MusclePharm Corporation. In early 2025, FitLife launched the new MusclePharm Pro Series a collection of premium sports nutrition products, through a pilot program at high-volume Vitamin Shoppe stores. If successful, this line is expected to roll out nationwide with exclusive retail partnerships.

Pre-Workout Supplements Market Report Scope

Report Attributes Details
Current Total Market Size (2025) USD 21.7 billion
Projected Market Size (2035) USD 44.7 billion
CAGR (2025 to 2035) 7.5%
Base Year for Estimation 2024
Historical Period 2020 to 2024
Projections Period 2025 to 2035
Market Analysis Parameters Revenue in USD billions/Kilotons
By Form Powder, Ready to Drink, and Capsule/Tablets
By Sales Channel Offline Sales Channel (Supermarkets/Hypermarkets, Departmental Stores, Convenience Stores, Others) and Online Sales Channel (Company Website, E-commerce Platform)
Regions Covered North America, Latin America, Western Europe, Eastern Europe, Balkans & Baltic, Russia & Belarus, Central Asia, East Asia, South Asia & Pacific, Middle East & Africa
Countries Covered United States, Canada, United Kingdom, Germany, France, China, Japan, South Korea, Brazil, Australia and 40+ countries
Key Players MusclePharm Corporation, Nutrabolt Corporation, BPI Sports LLC, Magnum Nutraceuticals, GAT Sport, Nutrex Research Inc., Beas t Sports Nutrition, SynTech Nutrition (Medix Laboratories NV), EFX Sports, and ALLMAX Nutrition Inc.
Additional Attributes Dollar sales by product type, share by functionality, regional demand growth, regulatory influence, clean- label trends, competitive benchmarking

Key Segments

By Form:

  • Powder
  • Ready-to-drink
  • Capsule/Tablets

By Sales Channel:

  • Offline Sales Channel
    • Supermarkets/Hypermarkets
    • Departmental Stores
    • Convenience Store
    • Other Sales Channel
  • Online Sales Channel
    • Company Website
    • E-commerce Platform

By Region:

  • North America
  • South America
  • Europe
  • East Asia
  • South Asia & Pacific
  • The Middle East & Africa (MEA)

Table of Content

  1. Executive Summary
    • Global Market Outlook
    • Demand-side Trends
    • Supply-side Trends
    • Technology Roadmap Analysis
    • Analysis and Recommendations
  2. Market Overview
    • Market Coverage/Taxonomy
    • Market Definition/Scope/Limitations
  3. Market Background
    • Market Dynamics
      • Drivers
      • Restraints
      • Opportunity
      • Trends
    • Scenario Forecast
      • Demand in Optimistic Scenario
      • Demand in Likely Scenario
      • Demand in Conservative Scenario
    • Opportunity Map Analysis
    • Product Life Cycle Analysis
    • Supply Chain Analysis
      • Supply Side Participants and their Roles
        • Producers
        • Mid-Level Participants (Traders/ Agents/ Brokers)
        • Wholesalers and Distributors
      • Value Added and Value Created at Node in the Supply Chain
      • List of Raw Material Suppliers
      • List of Existing and Potential Buyer’s
    • Investment Feasibility Matrix
    • Value Chain Analysis
      • Profit Margin Analysis
      • Wholesalers and Distributors
      • Retailers
    • PESTLE and Porter’s Analysis
    • Regulatory Landscape
      • By Key Regions
      • By Key Countries
    • Regional Parent Market Outlook
    • Production and Consumption Statistics
    • Import and Export Statistics
  4. Global Market Analysis 2020 to 2024 and Forecast, 2025 to 2035
    • Historical Market Size Value (USD Billion) & Volume (kilotons) Analysis, 2020 to 2024
    • Current and Future Market Size Value (USD Billion) & Volume (kilotons) Projections, 2025 to 2035
      • Y-o-Y Growth Trend Analysis
      • Absolute $ Opportunity Analysis
  5. Global Market Pricing Analysis 2020 to 2024 and Forecast 2025 to 2035
  6. Global Market Analysis 2020 to 2024 and Forecast 2025 to 2035, By Form
    • Introduction/Key Findings
    • Historical Market Size Value (USD Billion) & Volume (kilotons) Analysis By Form, 2020 to 2024
    • Current and Future Market Size Value (USD Billion) & Volume (kilotons) Analysis and Forecast By Form, 2025 to 2035
      • Powder
      • Ready to Drink
      • Capsule/Tablets
    • Y-o-Y Growth Trend Analysis By Form, 2020 to 2024
    • Absolute $ Opportunity Analysis By Form, 2025 to 2035
  7. Global Market Analysis 2020 to 2024 and Forecast 2025 to 2035, By Sales Channel
    • Introduction/Key Findings
    • Historical Market Size Value (USD Billion) & Volume (kilotons) Analysis By Sales Channel, 2020 to 2024
    • Current and Future Market Size Value (USD Billion) & Volume (kilotons) Analysis and Forecast By Sales Channel, 2025 to 2035
      • Offline Sales Channel
        • Supermarkets/Hypermarkets
        • Departmental Stores
        • Convenience Store
        • Other Sales Channel (specialty nutrition stores and fitness clubs)
      • Online Sales Channel
        • Company Website
        • E-commerce Platform
    • Y-o-Y Growth Trend Analysis By Sales Channel, 2020 to 2024
    • Absolute $ Opportunity Analysis By Sales Channel, 2025 to 2035
  8. Global Market Analysis 2020 to 2024 and Forecast 2025 to 2035, By Region
    • Introduction
    • Historical Market Size Value (USD Billion) & Volume (kilotons) Analysis By Region, 2020 to 2024
    • Current Market Size Value (USD Billion) & Volume (kilotons) Analysis and Forecast By Region, 2025 to 2035
      • North America
      • Latin America
      • Western Europe
      • Eastern Europe
      • East Asia
      • South Asia & Pacific
      • Middle East and Africa
    • Market Attractiveness Analysis By Region
  9. North America Market Analysis 2020 to 2024 and Forecast 2025 to 2035, By Country
    • Historical Market Size Value (USD Billion) & Volume (kilotons) Trend Analysis By Market Taxonomy, 2020 to 2024
    • Market Size Value (USD Billion) & Volume (kilotons) Forecast By Market Taxonomy, 2025 to 2035
      • By Country
        • USA
        • Canada
        • Mexico
      • By Form
      • By Sales Channel
    • Market Attractiveness Analysis
      • By Country
      • By Form
      • By Sales Channel
    • Key Takeaways
  10. Latin America Market Analysis 2020 to 2024 and Forecast 2025 to 2035, By Country
    • Historical Market Size Value (USD Billion) & Volume (kilotons) Trend Analysis By Market Taxonomy, 2020 to 2024
    • Market Size Value (USD Billion) & Volume (kilotons) Forecast By Market Taxonomy, 2025 to 2035
      • By Country
        • Brazil
        • Argentina
        • Rest of LATAM
      • By Form
      • By Sales Channel
    • Market Attractiveness Analysis
      • By Country
      • By Form
      • By Sales Channel
    • Key Takeaways
  11. Western Europe Market Analysis 2020 to 2024 and Forecast 2025 to 2035, By Country
    • Historical Market Size Value (USD Billion) & Volume (kilotons) Trend Analysis By Market Taxonomy, 2020 to 2024
    • Market Size Value (USD Billion) & Volume (kilotons) Forecast By Market Taxonomy, 2025 to 2035
      • By Country
        • Germany
        • Italy
        • France
        • UK
        • Spain
        • BENELUX
        • Nordic
        • Rest of W.Europe
      • By Form
      • By Sales Channel
    • Market Attractiveness Analysis
      • By Country
      • By Form
      • By Sales Channel
    • Key Takeaways
  12. Eastern Europe Market Analysis 2020 to 2024 and Forecast 2025 to 2035, By Country
    • Historical Market Size Value (USD Billion) & Volume (kilotons) Trend Analysis By Market Taxonomy, 2020 to 2024
    • Market Size Value (USD Billion) & Volume (kilotons) Forecast By Market Taxonomy, 2025 to 2035
      • By Country
        • Russia
        • Hungary
        • Poland
        • Balkan & Baltics
        • Rest of E. Europe
      • By Form
      • By Sales Channel
    • Market Attractiveness Analysis
      • By Country
      • By Form
      • By Sales Channel
    • Key Takeaways
  13. East Asia Market Analysis 2020 to 2024 and Forecast 2025 to 2035, By Country
    • Historical Market Size Value (USD Billion) & Volume (kilotons) Trend Analysis By Market Taxonomy, 2020 to 2024
    • Market Size Value (USD Billion) & Volume (kilotons) Forecast By Market Taxonomy, 2025 to 2035
      • By Country
        • China
        • Japan
        • South Korea
      • By Form
      • By Sales Channel
    • Market Attractiveness Analysis
      • By Country
      • By Form
      • By Sales Channel
    • Key Takeaways
  14. South Asia & Pacific Market Analysis 2020 to 2024 and Forecast 2025 to 2035, By Country
    • Historical Market Size Value (USD Billion) & Volume (kilotons) Trend Analysis By Market Taxonomy, 2020 to 2024
    • Market Size Value (USD Billion) & Volume (kilotons) Forecast By Market Taxonomy, 2025 to 2035
      • By Country
        • India
        • Australia & New Zealand
        • ASEAN
        • Rest of SAP
      • By Form
      • By Sales Channel
    • Market Attractiveness Analysis
      • By Country
      • By Form
      • By Sales Channel
    • Key Takeaways
  15. Middle East and Africa Market Analysis 2020 to 2024 and Forecast 2025 to 2035, By Country
    • Historical Market Size Value (USD Billion) & Volume (kilotons) Trend Analysis By Market Taxonomy, 2020 to 2024
    • Market Size Value (USD Billion) & Volume (kilotons) Forecast By Market Taxonomy, 2025 to 2035
      • By Country
        • GCC Countries
        • Northern Africa
        • South Africa
        • Turkiye
        • Rest of MEA
      • By Form
      • By Sales Channel
    • Market Attractiveness Analysis
      • By Country
      • By Form
      • By Sales Channel
    • Key Takeaways
  16. Key Countries Market Analysis
    • USA
      • Pricing Analysis
      • Market Share Analysis, 2024
        • By Form
        • By Sales Channel
    • Canada
      • Pricing Analysis
      • Market Share Analysis, 2024
        • By Form
        • By Sales Channel
    • Brazil
      • Pricing Analysis
      • Market Share Analysis, 2024
        • By Form
        • By Sales Channel
    • Mexico
      • Pricing Analysis
      • Market Share Analysis, 2024
        • By Form
        • By Sales Channel
    • Argentina
      • Pricing Analysis
      • Market Share Analysis, 2024
        • By Form
        • By Sales Channel
  17. Market Structure Analysis
    • Competition Dashboard
    • Competition Benchmarking
    • Market Share Analysis of Top Players
      • By Regional
      • By Form
      • By Sales Channel
  18. Competition Analysis
    • Competition Deep Dive
      • MusclePharm Corporation
        • Overview
        • Product Portfolio
        • Profitability by Market Segments (Product/Age /Sales Channel/Region)
        • Sales Footprint
        • Strategy Overview
          • Marketing Strategy
          • Product Strategy
          • Channel Strategy
      • Nutrabolt Corporation
        • Overview
        • Product Portfolio
        • Profitability by Market Segments (Product/Age /Sales Channel/Region)
        • Sales Footprint
        • Strategy Overview
          • Marketing Strategy
          • Product Strategy
          • Channel Strategy
      • BPI Sports, LLC
        • Overview
        • Product Portfolio
        • Profitability by Market Segments (Product/Age /Sales Channel/Region)
        • Sales Footprint
        • Strategy Overview
          • Marketing Strategy
          • Product Strategy
          • Channel Strategy
      • Magnum Nutraceuticals
        • Overview
        • Product Portfolio
        • Profitability by Market Segments (Product/Age /Sales Channel/Region)
        • Sales Footprint
        • Strategy Overview
          • Marketing Strategy
          • Product Strategy
          • Channel Strategy
      • GAT Sport
        • Overview
        • Product Portfolio
        • Profitability by Market Segments (Product/Age /Sales Channel/Region)
        • Sales Footprint
        • Strategy Overview
          • Marketing Strategy
          • Product Strategy
          • Channel Strategy
      • Nutrex Research, Inc.
        • Overview
        • Product Portfolio
        • Profitability by Market Segments (Product/Age /Sales Channel/Region)
        • Sales Footprint
        • Strategy Overview
          • Marketing Strategy
          • Product Strategy
          • Channel Strategy
      • Beast Sports Nutrition
        • Overview
        • Product Portfolio
        • Profitability by Market Segments (Product/Age /Sales Channel/Region)
        • Sales Footprint
        • Strategy Overview
          • Marketing Strategy
          • Product Strategy
          • Channel Strategy
      • SynTech Nutrition (Medix Laboratories NV)
        • Overview
        • Product Portfolio
        • Profitability by Market Segments (Product/Age /Sales Channel/Region)
        • Sales Footprint
        • Strategy Overview
          • Marketing Strategy
          • Product Strategy
          • Channel Strategy
      • EFX Sports
        • Overview
        • Product Portfolio
        • Profitability by Market Segments (Product/Age /Sales Channel/Region)
        • Sales Footprint
        • Strategy Overview
          • Marketing Strategy
          • Product Strategy
          • Channel Strategy
      • ALLMAX Nutrition, Inc.
        • Overview
        • Product Portfolio
        • Profitability by Market Segments (Product/Age /Sales Channel/Region)
        • Sales Footprint
        • Strategy Overview
          • Marketing Strategy
          • Product Strategy
          • Channel Strategy
  19. Assumptions & Acronyms Used
  20. Research Methodology

List of Tables

  • Table 1: Global Market Value (USD Billion) Forecast by Region, 2020-2035
  • Table 2: Global Market Volume (kilotons) Forecast by Region, 2020-2035
  • Table 3: Global Market Value (USD Billion) Forecast by Form, 2020-2035
  • Table 4: Global Market Volume (kilotons) Forecast by Form, 2020-2035
  • Table 5: Global Market Value (USD Billion) Forecast by Sales Channel, 2020-2035
  • Table 6: Global Market Volume (kilotons) Forecast by Sales Channel, 2020-2035
  • Table 7: North America Market Value (USD Billion) Forecast by Country, 2020-2035
  • Table 8: North America Market Volume (kilotons) Forecast by Country, 2020-2035
  • Table 9: North America Market Value (USD Billion) Forecast by Form, 2020-2035
  • Table 10: North America Market Volume (kilotons) Forecast by Form, 2020-2035
  • Table 11: North America Market Value (USD Billion) Forecast by Sales Channel, 2020-2035
  • Table 12: North America Market Volume (kilotons) Forecast by Sales Channel, 2020-2035
  • Table 13: Latin America Market Value (USD Billion) Forecast by Country, 2020-2035
  • Table 14: Latin America Market Volume (kilotons) Forecast by Country, 2020-2035
  • Table 15: Latin America Market Value (USD Billion) Forecast by Form, 2020-2035
  • Table 16: Latin America Market Volume (kilotons) Forecast by Form, 2020-2035
  • Table 17: Latin America Market Value (USD Billion) Forecast by Sales Channel, 2020-2035
  • Table 18: Latin America Market Volume (kilotons) Forecast by Sales Channel, 2020-2035
  • Table 19: Western Europe Market Value (USD Billion) Forecast by Country, 2020-2035
  • Table 20: Western Europe Market Volume (kilotons) Forecast by Country, 2020-2035
  • Table 21: Western Europe Market Value (USD Billion) Forecast by Form, 2020-2035
  • Table 22: Western Europe Market Volume (kilotons) Forecast by Form, 2020-2035
  • Table 23: Western Europe Market Value (USD Billion) Forecast by Sales Channel, 2020-2035
  • Table 24: Western Europe Market Volume (kilotons) Forecast by Sales Channel, 2020-2035
  • Table 25: Eastern Europe Market Value (USD Billion) Forecast by Country, 2020-2035
  • Table 26: Eastern Europe Market Volume (kilotons) Forecast by Country, 2020-2035
  • Table 27: Eastern Europe Market Value (USD Billion) Forecast by Form, 2020-2035
  • Table 28: Eastern Europe Market Volume (kilotons) Forecast by Form, 2020-2035
  • Table 29: Eastern Europe Market Value (USD Billion) Forecast by Sales Channel, 2020-2035
  • Table 30: Eastern Europe Market Volume (kilotons) Forecast by Sales Channel, 2020-2035
  • Table 31: East Asia Market Value (USD Billion) Forecast by Country, 2020-2035
  • Table 32: East Asia Market Volume (kilotons) Forecast by Country, 2020-2035
  • Table 33: East Asia Market Value (USD Billion) Forecast by Form, 2020-2035
  • Table 34: East Asia Market Volume (kilotons) Forecast by Form, 2020-2035
  • Table 35: East Asia Market Value (USD Billion) Forecast by Sales Channel, 2020-2035
  • Table 36: East Asia Market Volume (kilotons) Forecast by Sales Channel, 2020-2035
  • Table 37: South Asia & Pacific Market Value (USD Billion) Forecast by Country, 2020-2035
  • Table 38: South Asia & Pacific Market Volume (kilotons) Forecast by Country, 2020-2035
  • Table 39: South Asia & Pacific Market Value (USD Billion) Forecast by Form, 2020-2035
  • Table 40: South Asia & Pacific Market Volume (kilotons) Forecast by Form, 2020-2035
  • Table 41: South Asia & Pacific Market Value (USD Billion) Forecast by Sales Channel, 2020-2035
  • Table 42: South Asia & Pacific Market Volume (kilotons) Forecast by Sales Channel, 2020-2035
  • Table 43: Middle East and Africa Market Value (USD Billion) Forecast by Country, 2020-2035
  • Table 44: Middle East and Africa Market Volume (kilotons) Forecast by Country, 2020-2035
  • Table 45: Middle East and Africa Market Value (USD Billion) Forecast by Form, 2020-2035
  • Table 46: Middle East and Africa Market Volume (kilotons) Forecast by Form, 2020-2035
  • Table 47: Middle East and Africa Market Value (USD Billion) Forecast by Sales Channel, 2020-2035
  • Table 48: Middle East and Africa Market Volume (kilotons) Forecast by Sales Channel, 2020-2035

List of Figures

  • Figure 1: Global Market Volume (kilotons) Forecast 2020-2035
  • Figure 2: Global Market Pricing Analysis
  • Figure 3: Global Market Value (USD Billion) Forecast 2020-2035
  • Figure 4: Global Market Value Share and BPS Analysis by Form, 2025 and 2035
  • Figure 5: Global Market Y-o-Y Growth Comparison by Form, 2025-2035
  • Figure 6: Global Market Attractiveness Analysis by Form
  • Figure 7: Global Market Value Share and BPS Analysis by Sales Channel, 2025 and 2035
  • Figure 8: Global Market Y-o-Y Growth Comparison by Sales Channel, 2025-2035
  • Figure 9: Global Market Attractiveness Analysis by Sales Channel
  • Figure 10: Global Market Value (USD Billion) Share and BPS Analysis by Region, 2025 and 2035
  • Figure 11: Global Market Y-o-Y Growth Comparison by Region, 2025-2035
  • Figure 12: Global Market Attractiveness Analysis by Region
  • Figure 13: North America Market Incremental $ Opportunity, 2025-2035
  • Figure 14: Latin America Market Incremental $ Opportunity, 2025-2035
  • Figure 15: Western Europe Market Incremental $ Opportunity, 2025-2035
  • Figure 16: Eastern Europe Market Incremental $ Opportunity, 2025-2035
  • Figure 17: East Asia Market Incremental $ Opportunity, 2025-2035
  • Figure 18: South Asia & Pacific Market Incremental $ Opportunity, 2025-2035
  • Figure 19: Middle East and Africa Market Incremental $ Opportunity, 2025-2035
  • Figure 20: North America Market Value Share and BPS Analysis by Country, 2025 and 2035
  • Figure 21: North America Market Value Share and BPS Analysis by Form, 2025 and 2035
  • Figure 22: North America Market Y-o-Y Growth Comparison by Form, 2025-2035
  • Figure 23: North America Market Attractiveness Analysis by Form
  • Figure 24: North America Market Value Share and BPS Analysis by Sales Channel, 2025 and 2035
  • Figure 25: North America Market Y-o-Y Growth Comparison by Sales Channel, 2025-2035
  • Figure 26: North America Market Attractiveness Analysis by Sales Channel
  • Figure 27: Latin America Market Value Share and BPS Analysis by Country, 2025 and 2035
  • Figure 28: Latin America Market Value Share and BPS Analysis by Form, 2025 and 2035
  • Figure 29: Latin America Market Y-o-Y Growth Comparison by Form, 2025-2035
  • Figure 30: Latin America Market Attractiveness Analysis by Form
  • Figure 31: Latin America Market Value Share and BPS Analysis by Sales Channel, 2025 and 2035
  • Figure 32: Latin America Market Y-o-Y Growth Comparison by Sales Channel, 2025-2035
  • Figure 33: Latin America Market Attractiveness Analysis by Sales Channel
  • Figure 34: Western Europe Market Value Share and BPS Analysis by Country, 2025 and 2035
  • Figure 35: Western Europe Market Value Share and BPS Analysis by Form, 2025 and 2035
  • Figure 36: Western Europe Market Y-o-Y Growth Comparison by Form, 2025-2035
  • Figure 37: Western Europe Market Attractiveness Analysis by Form
  • Figure 38: Western Europe Market Value Share and BPS Analysis by Sales Channel, 2025 and 2035
  • Figure 39: Western Europe Market Y-o-Y Growth Comparison by Sales Channel, 2025-2035
  • Figure 40: Western Europe Market Attractiveness Analysis by Sales Channel
  • Figure 41: Eastern Europe Market Value Share and BPS Analysis by Country, 2025 and 2035
  • Figure 42: Eastern Europe Market Value Share and BPS Analysis by Form, 2025 and 2035
  • Figure 43: Eastern Europe Market Y-o-Y Growth Comparison by Form, 2025-2035
  • Figure 44: Eastern Europe Market Attractiveness Analysis by Form
  • Figure 45: Eastern Europe Market Value Share and BPS Analysis by Sales Channel, 2025 and 2035
  • Figure 46: Eastern Europe Market Y-o-Y Growth Comparison by Sales Channel, 2025-2035
  • Figure 47: Eastern Europe Market Attractiveness Analysis by Sales Channel
  • Figure 48: East Asia Market Value Share and BPS Analysis by Country, 2025 and 2035
  • Figure 49: East Asia Market Value Share and BPS Analysis by Form, 2025 and 2035
  • Figure 50: East Asia Market Y-o-Y Growth Comparison by Form, 2025-2035
  • Figure 51: East Asia Market Attractiveness Analysis by Form
  • Figure 52: East Asia Market Value Share and BPS Analysis by Sales Channel, 2025 and 2035
  • Figure 53: East Asia Market Y-o-Y Growth Comparison by Sales Channel, 2025-2035
  • Figure 54: East Asia Market Attractiveness Analysis by Sales Channel
  • Figure 55: South Asia & Pacific Market Value Share and BPS Analysis by Country, 2025 and 2035
  • Figure 56: South Asia & Pacific Market Value Share and BPS Analysis by Form, 2025 and 2035
  • Figure 57: South Asia & Pacific Market Y-o-Y Growth Comparison by Form, 2025-2035
  • Figure 58: South Asia & Pacific Market Attractiveness Analysis by Form
  • Figure 59: South Asia & Pacific Market Value Share and BPS Analysis by Sales Channel, 2025 and 2035
  • Figure 60: South Asia & Pacific Market Y-o-Y Growth Comparison by Sales Channel, 2025-2035
  • Figure 61: South Asia & Pacific Market Attractiveness Analysis by Sales Channel
  • Figure 62: Middle East and Africa Market Value Share and BPS Analysis by Country, 2025 and 2035
  • Figure 63: Middle East and Africa Market Value Share and BPS Analysis by Form, 2025 and 2035
  • Figure 64: Middle East and Africa Market Y-o-Y Growth Comparison by Form, 2025-2035
  • Figure 65: Middle East and Africa Market Attractiveness Analysis by Form
  • Figure 66: Middle East and Africa Market Value Share and BPS Analysis by Sales Channel, 2025 and 2035
  • Figure 67: Middle East and Africa Market Y-o-Y Growth Comparison by Sales Channel, 2025-2035
  • Figure 68: Middle East and Africa Market Attractiveness Analysis by Sales Channel
  • Figure 69: Global Market - Tier Structure Analysis
  • Figure 70: Global Market - Company Share Analysis

Frequently Asked Questions

What is the projected size of the pre-workout supplements market in 2025?

The market size is valued at USD 21.7 billion in 2025.

What is the outlook on the demand for pre-workout supplements by 2035?

The market is forecasted to reach USD 44.7 billion by 2035, reflecting a CAGR of 7.5%.

Which segment leads the pre-workout supplements market by form in 2025?

Powdered supplements will lead the form segment, accounting for 56% of the global market share in 2025.

What is the top offline sales channels in the pre-workout supplements market by 2025?

Offline channels will dominate the sales channel segment with a 61% share in 2025.

Which country is projected to have the fastest-growing pre-workout supplements market?

The UK is projected to grow at the fastest rate with a CAGR of 7.8% from 2025 to 2035.

Explore Similar Insights

Future Market Insights

Pre-Workout Supplements Market