Glutathione Supplements Market Size and Share Forecast Outlook 2025 to 2035

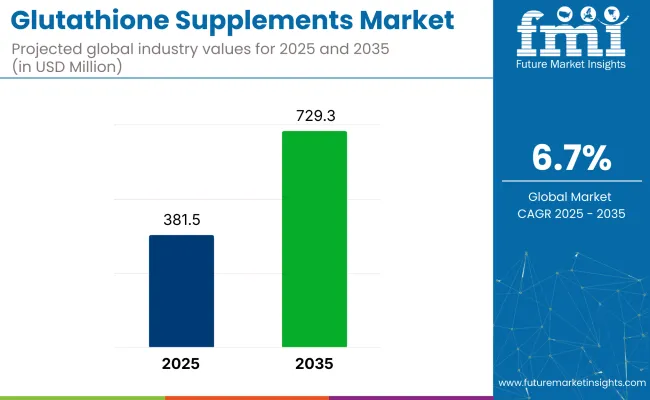
The global glutathione supplements market is valued at USD 381.5 million in 2025 and is slated to reach USD 729.3 million by 2035, which shows a CAGR of 6.7%. Factors driving this growth include the increasing prevalence of chronic diseases, declining natural glutathione levels with age, and rising consumer awareness regarding antioxidant benefits.
Quick Stats for Glutathione Supplements Market

  • Market Value (2025): USD 381.5 million
  • Forecast Value (2035): USD 729.3 million
  • Forecast CAGR: 6.7%
  • End User Leader in 2025:  Adults (65%Market Share)
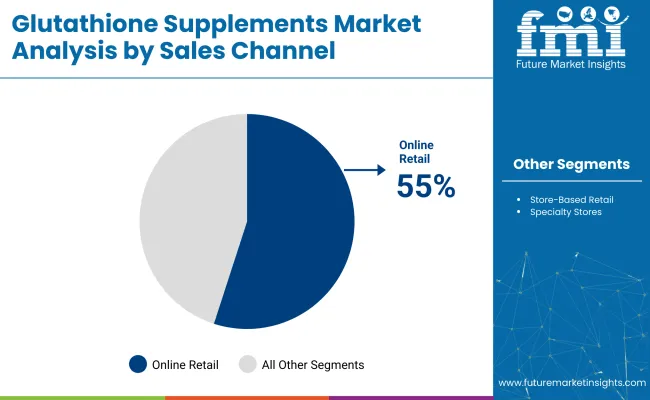
  • Top Sales Channel Segment: Online Retail (55% Market Share in 2025)
  • Key Growth Region: East Asia (Japan is the fastest-growing market with 7.9% CAGR)

Glutathione Supplements Market

Metric Value
Market Size (2025) USD 381.5 million
Market Size (2035) USD 729.3 million
CAGR (2025 to 2035) 6.7%

Additionally, technological advancements in bioavailable formulations, including liposomal glutathione, are expected to enhance product efficacy and accelerate market expansion globally.

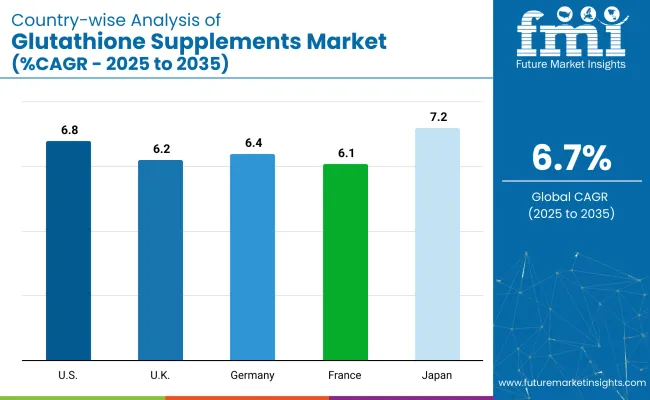
Japan is projected to grow at a CAGR of 7.2%, driven by rising demand for anti-aging and skin health supplements. The USA is expected to register a CAGR of 6.8% owing to its increasing aging population and preference for immune-boosting clean-label formulations. Germany is estimated to grow at a CAGR of 6.4%, supported by higher spending on natural antioxidant-based supplements.

Adults are expected to lead the end user segment with a 65% market share in 2025. Online retail will dominate the sales channel segment with a 55% share, supported by increasing e-commerce penetration and consumer preference for convenient purchasing options.

Government regulations are becoming stricter to ensure the safety and efficacy of glutathione supplements, with authorities such as the USA FDA and EFSA enforcing guidelines on clean-label claims, bioavailability standards, and permissible daily intake levels. In response, manufacturers are focusing on innovations such as liposomal glutathione technology to enhance absorption and effectiveness. Additionally, natural fermentation techniques are being adopted to produce vegan, non-GMO, and allergen-free formulations.

The market accounts for approximately 2-3% of the overall dietary supplements market, driven by its niche antioxidant benefits and targeted immune support. Within the nutraceuticals market, it holds a share of around 1-2%, as broader categories like vitamins and minerals dominate. In the functional foods and beverages market, its contribution is under 1%, since it is mainly consumed as a supplement rather than integrated into food products.

However, within the antioxidant supplements segment, glutathione supplements account for nearly 5-7%, reflecting their strong positioning as a master antioxidant among health-conscious consumers seeking cellular detoxification and skin health benefits.

Analyzing Glutathione Supplement Market by Top Investment Segments

The glutathione supplements market segments include product forms, flavour type, end user, sales channel, functionality, and region. The product form segment covers capsules, gummies, tablets, powders, liquid, and topical ointments. The flavour type segment includes citrus, orange, berry, lemon, blueberry, mint, and others (such as chocolate, unflavoured, vanilla, and herbal blends).

The end user segment comprises toddlers (2-4 years), tweens (5-12 years), adolescents (13-18 years), and adults (above 18). The sales channel segment consists of store-based retail (hypermarket/supermarket, convenience store, medical stores, specialty stores (health & wellness)) and online retail (company website, third party website, social media selling).

The functionality segment includes immunity support, mood support, antioxidant support, beauty support, blood pressure support, bone and joint health support, cognitive support, and overall energy and detox support. The regional segment includes North America, Latin America, Europe, South Asia, East Asia, Oceania, and the Middle East & Africa.

Capsules to Lead Product Form Segment with 30% Market Share in 2025

Capsules are projected to remain the most lucrative segment, holding a market share of 30% in 2025.

  • Powders are being increasingly adopted by consumers seeking flexible dosing and blend ability with beverages.
  • Liquid forms are preferred by individuals with swallowing difficulties or those requiring fast absorption, while topical ointments are used for skin-related antioxidant applications.

Berry to Lead Flavour Type Segment with 25% Market Share in 2025

Berry flavours are expected to remain the most lucrative segment, accounting for a market share of 25% in 2025.

  • Citrus flavours also remain popular because of their refreshing taste and association with immunity-boosting benefits. Orange flavour appeals to a broad consumer base owing to its familiar and mild taste.
  • Lemon and mint flavours are gaining traction, particularly in effervescent and liquid formulations, for their invigorating properties. Blueberry flavour is emerging as a niche option targeting health-conscious consumers seeking superfood benefits.

Adults (above 18) to Lead End User Segment with 65% Market Share in 2025

Adults (above 18) are expected to remain the most lucrative segment, holding a market share of approximately 65% in 2025.
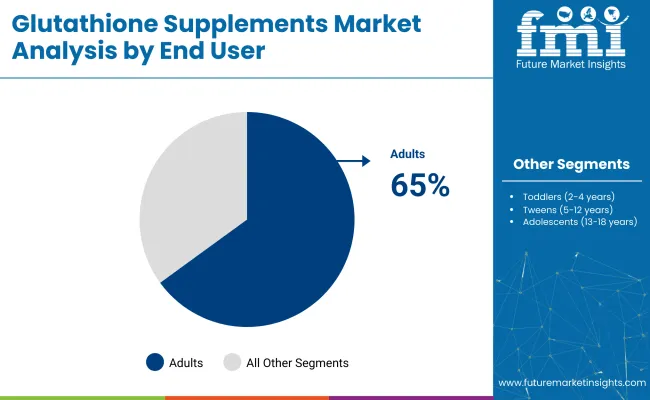
  • Adults widely consume glutathione supplements for immune support, detoxification, and beauty benefits such as skin brightening.
  • The tween segment sees moderate growth driven by parental focus on immunity and overall well-being, while the toddler segment remains niche, with supplements administered only under paediatric recommendation.

Glutathione Supplements Market End Use

Online Retail to Lead Sales Channel Segment with 55% Market Share in 2025

Online retail is expected to remain the most lucrative sales channel, accounting for a market share of 55% in 2025.

Third-party websites such as Amazon and iHerb are leading this segment due to their strong global presence and trust factor among buyers.

Social media selling is emerging rapidly with influencer-led marketing, particularly for beauty and detox supplement categories.
Glutathione Supplements Market Sales Channel

Antioxidant Support to Lead Functionality Segment with 37.2% Market Share in 2025

Antioxidant support is expected to remain the most lucrative segment, holding a market share of approximately 37.2% in 2025.

  • Immunity support also holds a significant share as consumers increasingly focus on preventive health solutions post-pandemic.
  • Cognitive support, mood support, and bone and joint health support remain niche segments, targeting specific health concerns in targeted demographics.
  • Blood pressure support and overall energy and detox support are witnessing moderate growth, driven by the rising prevalence of lifestyle-related disorders.

Top Glutathione Supplement Market Dynamics

The global glutathione supplements market is growing steadily, driven by rising health consciousness, increasing demand for antioxidant-rich supplements, and advancements in bioavailable and clean-label glutathione formulations.

Recent Trends in the Glutathione Supplements Market
  • Liposomal glutathione formulations are being launched to enhance bioavailability and absorption.
  • Clean-label, vegan, and non-GMO glutathione supplements are gaining popularity among health-conscious consumers.
  • Gummies and flavoured oral supplements are witnessing increasing demand due to convenience and palatability.
  • Companies are investing in natural fermentation technologies for sustainable glutathione production.

Challenges in the Glutathione Supplements Market

  • Low oral bioavailability remains a limitation for traditional glutathione supplements.
  • Strict regulatory requirements for antioxidant health claims are impacting new product launches.
  • High production costs of advanced formulations affect affordability for price-sensitive consumers.
  • Intense competition among established players creates pricing pressures and margin constraints.

Analyzing Top Countries Using and Consuming Glutathione Supplements Market

Glutathione Supplements Market Country Wise

Japan is projected to witness the highest growth rate in the glutathione supplements market, with a CAGR of 7.2% from 2025 to 2035, driven by strong R&D, aging population demand, and premium formulations. The USA follows with a CAGR of 6.8%, supported by rising health-conscious consumers and robust online sales channels.

Germany is expected to grow at 6.4% due to increasing demand for natural and allergen-free supplements. The UK shows a CAGR of 6.2%, fuelled by millennial preferences for antioxidants, while France records the lowest among these at 6.1%, driven by beauty-focused supplement consumption.

The report covers an in-depth analysis of 40+ countries; five top-performing OECD countries are highlighted below. 

USA Glutathione Supplements Market Analysis

The USA glutathione supplements market is projected to grow at a CAGR of 6.8% from 2025 to 2035.

  • Growing consumer preference for clean-label and vegan supplements.
  • Strong distribution networks via online and specialty stores.
  • High investments in R&D for advanced bioavailable formulations.
  • Leading companies include NOW Foods, Nature’s Craft, and Jarrow Formulas.

UK Glutathione Supplements Market Analysis

The UK glutathione supplements revenue is expected to grow at a CAGR of 6.2% from 2025 to 2035.

  • Rising popularity of antioxidant supplements among millennials.
  • Strong regulatory framework supporting supplement safety.
  • Increasing promotional campaigns by wellness influencers.
  • Major brands include Solgar and Swisse with targeted formulations.

Glutathione Supplements Demand Analysis in Germany

Sales of glutathione supplements in Germany are expected to register a CAGR of 6.4% from 2025 to 2035.

  • Growing demand for natural and allergen-free supplements.
  • Robust pharmacy and specialty store distribution network.
  • Increased focus on immunity-boosting formulations post-pandemic.
  • Leading companies include Pure Encapsulations Inc. and Healthy Origins.

Glutathione Supplements Demand Analysis in France

Sales of glutathione supplements in France are anticipated to grow at a CAGR of 6.1% from 2025 to 2035.

  • Strong presence of pharmacy-based supplement sales.
  • Increasing innovation in flavour and formulation variety.
  • High demand for beauty-focused glutathione products.
  • Expansion of online retail and e-pharmacy platforms.

Japan Glutathione Supplements Market Analysis

The Japan glutathione supplements sales are forecasted to grow at a CAGR of 7.2% from 2025 to 2035, the highest among the top countries.

  • Strong R&D focus on bioavailable glutathione formulations.
  • High consumer preference for multifunctional health products.
  • Government initiatives promoting nutritional wellness.
  • Rising demand for premium, clean-label, and vegan supplements.

Leading Glutathione Supplements Manufacturers and Suppliers 

The global glutathione supplements market is characterized by a mix of established and emerging players, indicating a moderately fragmented landscape. Leading companies are actively engaging in strategies such as product innovation, strategic partnerships, and expansion into new markets to strengthen their positions.

Top companies like NOW Foods, Life Extension, and Jarrow Formulas are focusing on developing advanced formulations, including liposomal and nano-encapsulated glutathione, to enhance bioavailability and meet consumer demand for effective supplements. These innovations are often accompanied by rigorous clinical studies to substantiate health claims, thereby building consumer trust.

Recent Glutathione Supplements Industry News

  • In April 2024, OZiva, a renowned player in the clean-label nutrition industry, launched Bioactive Gluta, a fizzy drink designed to address prevalent skin issues.

Glutathione Supplements Market - Report Scope

Report Attributes Details
Current Total Market Size (2025) USD 381.5 million
Projected Market Size (2035) USD 729.3 million
CAGR (2025 to 2035) 6.7%
Base Year for Estimation 2024
Historical Period 2020 to 2024
Projections Period 2025 to 2035
Market Analysis Parameters Revenue in USD million/Volume (Metric Tons)
By Product Form Capsules, Gummies, Tablets, Powders, Liquid, and Topical Ointments
By Flavour Type Citrus, Orange, Berry, Lemon, Blueberry, Mint, Others
By End User Toddlers (2-4 years), Tweens (5-12 years), Adolescents (13-18 years), Adults (above 18)
By Sales Channel Store-based Retail (Hypermarket/Supermarket, Convenience Store, Medical Stores, Specialty Stores (Health & Wellness)), Online Retail (Company Website, Third-party Website, Social Media Selling)
By Functionality Immunity Support, Mood Support, Antioxidant Support, Beauty Support, Blood Pressure Support, Bone a nd Joint Health Support, Cognitive Support, Overall Energy a nd Detox Support
Regions Covered North America, Latin America, Western Europe, Eastern Europe, East Asia, South Asia & Pacific, Middle East & Africa
Countries Covered United States, Canada, United Kingdom, Germany, France, China, Japan, South Korea, Brazil, Australia
Key Players NOW Foods, Life Extension, Alliwise, ELMNT Health, BioSchwartz, Horbaach, NutriFlair, DaVinci Laboratories, Nature's Craft, Swanson, Piping Rock, NutriVein, BioFinest, We Like Vitamins, Toniiqq, Jarrows Formula, Bulk Supplements, Fresh Nutrition, aSquared Nutrition, Solgar, Pure Encapsulations Inc, BoldFit, Swisse, Nature's Island, Hikari, Aqua Skin, Shandong Jincheng Bio-pharmaceutical Co., Kohjin Life Sciences, Kirkman Group, Healthy Origins
Additional Attributes Dollar sales by value, market share analysis by region, and country-wise analysis.

Key Segmentation

By Product Forms:

As per form type, the industry has been categorized into Capsules, Gummies, Tablets, Powders, Liquid, and Topical ointments.

By Flavors type:

As per flavors type, the industry has been categorized into Citrus, Orange, Berry, Lemon, Blueberry, Mint flavors, and Others.

By End Users:

This segment is further categorized into Toddlers (2-4 years), Tween (5-12 years), Adolescents (13-18 years), and Adults (above 18).

By Sales Channel:

As per the sales channel, the industry has been categorized into Store-based retail (Hypermarkets, Supermarkets, Convenience stores, Medical stores, Specialty stores) and Online retail (Company websites, Third party websites, and Social Media Selling).

By Functionality:

This segment is further categorized into Immunity Support, Mood Support, Antioxidant support, Beauty support, Blood Pressure Support, Bone and Joint Health support, Cognitive support, and Overall energy and detox support.

By Region:

Industry analysis has been carried out in key countries of North America, Latin America, Europe, East Asia, South Asia, Oceania, and the Middle East & Africa.

Table of Content

  1. Executive Summary
    • Global Market Outlook
    • Demand-side Trends
    • Supply-side Trends
    • Technology Roadmap Analysis
    • Analysis and Recommendations
  2. Market Overview
    • Market Coverage / Taxonomy
    • Market Definition / Scope / Limitations
  3. Market Background
    • Market Dynamics
      • Drivers
      • Restraints
      • Opportunity
      • Trends
    • Scenario Forecast
      • Demand in Optimistic Scenario
      • Demand in Likely Scenario
      • Demand in Conservative Scenario
    • Opportunity Map Analysis
    • Product Life Cycle Analysis
    • Supply Chain Analysis
      • Supply Side Participants and their Roles
        • Producers
        • Mid-Level Participants (Traders/ Agents/ Brokers)
        • Wholesalers and Distributors
      • Value Added and Value Created at Node in the Supply Chain
      • List of Raw Material Suppliers
      • List of Existing and Potential Buyer’s
    • Investment Feasibility Matrix
    • Value Chain Analysis
      • Profit Margin Analysis
      • Wholesalers and Distributors
      • Retailers
    • PESTLE and Porter’s Analysis
    • Regulatory Landscape
      • By Key Regions
      • By Key Countries
    • Regional Parent Market Outlook
    • Production and Consumption Statistics
    • Import and Export Statistics
  4. Global Market Analysis 2020 to 2024 and Forecast, 2025 to 2035
    • Historical Market Size Value (USD Million) & Volume (Metric Tons) Analysis, 2020 to 2024
    • Current and Future Market Size Value (USD Million) & Volume (Metric Tons) Projections, 2025 to 2035
      • Y-o-Y Growth Trend Analysis
      • Absolute $ Opportunity Analysis
  5. Global Market Pricing Analysis 2020 to 2024 and Forecast 2025 to 2035
  6. Global Market Analysis 2020 to 2024 and Forecast 2025 to 2035, By Product Forms
    • Introduction / Key Findings
    • Historical Market Size Value (USD Million) & Volume (Metric Tons) Analysis By Product Forms, 2020 to 2024
    • Current and Future Market Size Value (USD Million) & Volume (Metric Tons) Analysis and Forecast By Product Forms, 2025 to 2035
      • Capsules
      • Gummies
      • Tablets
      • Powders
      • Liquid
      • Topical Ointments
    • Y-o-Y Growth Trend Analysis By Product Forms, 2020 to 2024
    • Absolute $ Opportunity Analysis By Product Forms, 2025 to 2035
  7. Global Market Analysis 2020 to 2024 and Forecast 2025 to 2035, By Flavours Type
    • Introduction / Key Findings
    • Historical Market Size Value (USD Million) & Volume (Metric Tons) Analysis By Flavours Type, 2020 to 2024
    • Current and Future Market Size Value (USD Million) & Volume (Metric Tons) Analysis and Forecast By Flavours Type, 2025 to 2035
      • Citrus
      • Orange
      • Berry
      • Lemon
      • Blueberry
      • Mint
      • Others
    • Y-o-Y Growth Trend Analysis By Flavours Type, 2020 to 2024
    • Absolute $ Opportunity Analysis By Flavours Type, 2025 to 2035
  8. Global Market Analysis 2020 to 2024 and Forecast 2025 to 2035, By End Users
    • Introduction / Key Findings
    • Historical Market Size Value (USD Million) & Volume (Metric Tons) Analysis By End Users, 2020 to 2024
    • Current and Future Market Size Value (USD Million) & Volume (Metric Tons) Analysis and Forecast By End Users, 2025 to 2035
      • Toddlers (2-4 years)
      • Tween (5-12 years)
      • Adolescents (13-18 years)
      • Adults (above 18)
    • Y-o-Y Growth Trend Analysis By End Users, 2020 to 2024
    • Absolute $ Opportunity Analysis By End Users, 2025 to 2035
  9. Global Market Analysis 2020 to 2024 and Forecast 2025 to 2035, By Sales Channel
    • Introduction / Key Findings
    • Historical Market Size Value (USD Million) & Volume (Metric Tons) Analysis By Sales Channel, 2020 to 2024
    • Current and Future Market Size Value (USD Million) & Volume (Metric Tons) Analysis and Forecast By Sales Channel, 2025 to 2035
      • Store-based Retail
        • Hypermarket/Supermarket
        • Convenience Store
        • Medical Stores
        • Specialty Stores (Health & Wellness)
      • Online Retail
        • Company Website
        • Third party website
        • Social Media Selling
    • Y-o-Y Growth Trend Analysis By Sales Channel, 2020 to 2024
    • Absolute $ Opportunity Analysis By Sales Channel, 2025 to 2035
  10. Global Market Analysis 2020 to 2024 and Forecast 2025 to 2035, By Functionality
    • Introduction / Key Findings
    • Historical Market Size Value (USD Million) & Volume (Metric Tons) Analysis By Functionality, 2020 to 2024
    • Current and Future Market Size Value (USD Million) & Volume (Metric Tons) Analysis and Forecast By Functionality, 2025 to 2035
      • Immunity Support
      • Mood Support
      • Antioxidant Support
      • Beauty Support
      • Blood Pressure Support
      • Bone and Joint Health Support
      • Cognitive Support
      • Overall Energy and Detox Support
    • Y-o-Y Growth Trend Analysis By Functionality, 2020 to 2024
    • Absolute $ Opportunity Analysis By Functionality, 2025 to 2035
  11. Global Market Analysis 2020 to 2024 and Forecast 2025 to 2035, By Region
    • Introduction
    • Historical Market Size Value (USD Million) & Volume (Metric Tons) Analysis By Region, 2020 to 2024
    • Current Market Size Value (USD Million) & Volume (Metric Tons) Analysis and Forecast By Region, 2025 to 2035
      • USA
      • Latin America
      • Western Europe
      • Eastern Europe
      • East Asia
      • South Asia & Pacific
      • Middle East and Africa
    • Market Attractiveness Analysis By Region
  12. USA Market Analysis 2020 to 2024 and Forecast 2025 to 2035, By Country
    • Historical Market Size Value (USD Million) & Volume (Metric Tons) Trend Analysis By Market Taxonomy, 2020 to 2024
    • Market Size Value (USD Million) & Volume (Metric Tons) Forecast By Market Taxonomy, 2025 to 2035
      • By Country
        • Canada
        • Brazil
        • Mexico
        • Argentina
      • By Product Forms
      • By Flavours Type
      • By End Users
      • By Sales Channel
      • By Functionality
    • Market Attractiveness Analysis
      • By Country
      • By Product Forms
      • By Flavours Type
      • By End Users
      • By Sales Channel
      • By Functionality
    • Key Takeaways
  13. Latin America Market Analysis 2020 to 2024 and Forecast 2025 to 2035, By Country
    • Historical Market Size Value (USD Million) & Volume (Metric Tons) Trend Analysis By Market Taxonomy, 2020 to 2024
    • Market Size Value (USD Million) & Volume (Metric Tons) Forecast By Market Taxonomy, 2025 to 2035
      • By Country
        • Brazil
        • Argentina
        • Rest of LATAM
      • By Product Forms
      • By Flavours Type
      • By End Users
      • By Sales Channel
      • By Functionality
    • Market Attractiveness Analysis
      • By Country
      • By Product Forms
      • By Flavours Type
      • By End Users
      • By Sales Channel
      • By Functionality
    • Key Takeaways
  14. Western Europe Market Analysis 2020 to 2024 and Forecast 2025 to 2035, By Country
    • Historical Market Size Value (USD Million) & Volume (Metric Tons) Trend Analysis By Market Taxonomy, 2020 to 2024
    • Market Size Value (USD Million) & Volume (Metric Tons) Forecast By Market Taxonomy, 2025 to 2035
      • By Country
        • Germany
        • Italy
        • France
        • UK
        • Spain
        • BENELUX
        • Nordic
        • Rest of W.Europe
      • By Product Forms
      • By Flavours Type
      • By End Users
      • By Sales Channel
      • By Functionality
    • Market Attractiveness Analysis
      • By Country
      • By Product Forms
      • By Flavours Type
      • By End Users
      • By Sales Channel
      • By Functionality
    • Key Takeaways
  15. Eastern Europe Market Analysis 2020 to 2024 and Forecast 2025 to 2035, By Country
    • Historical Market Size Value (USD Million) & Volume (Metric Tons) Trend Analysis By Market Taxonomy, 2020 to 2024
    • Market Size Value (USD Million) & Volume (Metric Tons) Forecast By Market Taxonomy, 2025 to 2035
      • By Country
        • Russia
        • Hungary
        • Poland
        • Balkan & Baltics
        • Rest of E. Europe
      • By Product Forms
      • By Flavours Type
      • By End Users
      • By Sales Channel
      • By Functionality
    • Market Attractiveness Analysis
      • By Country
      • By Product Forms
      • By Flavours Type
      • By End Users
      • By Sales Channel
      • By Functionality
    • Key Takeaways
  16. East Asia Market Analysis 2020 to 2024 and Forecast 2025 to 2035, By Country
    • Historical Market Size Value (USD Million) & Volume (Metric Tons) Trend Analysis By Market Taxonomy, 2020 to 2024
    • Market Size Value (USD Million) & Volume (Metric Tons) Forecast By Market Taxonomy, 2025 to 2035
      • By Country
        • China
        • Japan
        • South Korea
      • By Product Forms
      • By Flavours Type
      • By End Users
      • By Sales Channel
      • By Functionality
    • Market Attractiveness Analysis
      • By Country
      • By Product Forms
      • By Flavours Type
      • By End Users
      • By Sales Channel
      • By Functionality
    • Key Takeaways
  17. South Asia & Pacific Market Analysis 2020 to 2024 and Forecast 2025 to 2035, By Country
    • Historical Market Size Value (USD Million) & Volume (Metric Tons) Trend Analysis By Market Taxonomy, 2020 to 2024
    • Market Size Value (USD Million) & Volume (Metric Tons) Forecast By Market Taxonomy, 2025 to 2035
      • By Country
        • India
        • Australia & New Zealand
        • ASEAN
        • Rest of SAP
      • By Product Forms
      • By Flavours Type
      • By End Users
      • By Sales Channel
      • By Functionality
    • Market Attractiveness Analysis
      • By Country
      • By Product Forms
      • By Flavours Type
      • By End Users
      • By Sales Channel
      • By Functionality
    • Key Takeaways
  18. Middle East and Africa Market Analysis 2020 to 2024 and Forecast 2025 to 2035, By Country
    • Historical Market Size Value (USD Million) & Volume (Metric Tons) Trend Analysis By Market Taxonomy, 2020 to 2024
    • Market Size Value (USD Million) & Volume (Metric Tons) Forecast By Market Taxonomy, 2025 to 2035
      • By Country
        • GCC Countries
        • Northern Africa
        • South Africa
        • Turkiye
        • Rest of MEA
      • By Product Forms
      • By Flavours Type
      • By End Users
      • By Sales Channel
      • By Functionality
    • Market Attractiveness Analysis
      • By Country
      • By Product Forms
      • By Flavours Type
      • By End Users
      • By Sales Channel
      • By Functionality
    • Key Takeaways
  19. Key Countries Market Analysis
    • USA
      • Pricing Analysis
      • Market Share Analysis, 2024
        • By Product Forms
        • By Flavours Type
        • By End Users
        • By Sales Channel
        • By Functionality
    • Canada
      • Pricing Analysis
      • Market Share Analysis, 2024
        • By Product Forms
        • By Flavours Type
        • By End Users
        • By Sales Channel
        • By Functionality
    • Brazil
      • Pricing Analysis
      • Market Share Analysis, 2024
        • By Product Forms
        • By Flavours Type
        • By End Users
        • By Sales Channel
        • By Functionality
    • Mexico
      • Pricing Analysis
      • Market Share Analysis, 2024
        • By Product Forms
        • By Flavours Type
        • By End Users
        • By Sales Channel
        • By Functionality
    • Argentina
      • Pricing Analysis
      • Market Share Analysis, 2024
        • By Product Forms
        • By Flavours Type
        • By End Users
        • By Sales Channel
        • By Functionality
  20. Market Structure Analysis
    • Competition Dashboard
    • Competition Benchmarking
    • Market Share Analysis of Top Players
      • By Regional
      • By Product Forms
      • By Flavours Type
      • By End Users
      • By Sales Channel
      • By Functionality
  21. Competition Analysis
    • Competition Deep Dive
      • Nestle
        • Overview
        • Product Portfolio
        • Profitability by Market Segments (Product/Age /Sales Channel/Region)
        • Sales Footprint
        • Strategy Overview
          • Marketing Strategy
          • Product Strategy
          • Channel Strategy
      • Dana Dairy Group
        • Overview
        • Product Portfolio
        • Profitability by Market Segments (Product/Age /Sales Channel/Region)
        • Sales Footprint
        • Strategy Overview
          • Marketing Strategy
          • Product Strategy
          • Channel Strategy
      • Anchor
        • Overview
        • Product Portfolio
        • Profitability by Market Segments (Product/Age /Sales Channel/Region)
        • Sales Footprint
        • Strategy Overview
          • Marketing Strategy
          • Product Strategy
          • Channel Strategy
      • Amul (GCMMF)
        • Overview
        • Product Portfolio
        • Profitability by Market Segments (Product/Age /Sales Channel/Region)
        • Sales Footprint
        • Strategy Overview
          • Marketing Strategy
          • Product Strategy
          • Channel Strategy
      • Grupo Lala
        • Overview
        • Product Portfolio
        • Profitability by Market Segments (Product/Age /Sales Channel/Region)
        • Sales Footprint
        • Strategy Overview
          • Marketing Strategy
          • Product Strategy
          • Channel Strategy
      • Fonterra
        • Overview
        • Product Portfolio
        • Profitability by Market Segments (Product/Age /Sales Channel/Region)
        • Sales Footprint
        • Strategy Overview
          • Marketing Strategy
          • Product Strategy
          • Channel Strategy
      • Groupe Lactalis
        • Overview
        • Product Portfolio
        • Profitability by Market Segments (Product/Age /Sales Channel/Region)
        • Sales Footprint
        • Strategy Overview
          • Marketing Strategy
          • Product Strategy
          • Channel Strategy
      • Yili Group
        • Overview
        • Product Portfolio
        • Profitability by Market Segments (Product/Age /Sales Channel/Region)
        • Sales Footprint
        • Strategy Overview
          • Marketing Strategy
          • Product Strategy
          • Channel Strategy
      • Dairy Farmers of America
        • Overview
        • Product Portfolio
        • Profitability by Market Segments (Product/Age /Sales Channel/Region)
        • Sales Footprint
        • Strategy Overview
          • Marketing Strategy
          • Product Strategy
          • Channel Strategy
      • Arla Foods
        • Overview
        • Product Portfolio
        • Profitability by Market Segments (Product/Age /Sales Channel/Region)
        • Sales Footprint
        • Strategy Overview
          • Marketing Strategy
          • Product Strategy
          • Channel Strategy
      • Mother Dairy
        • Overview
        • Product Portfolio
        • Profitability by Market Segments (Product/Age /Sales Channel/Region)
        • Sales Footprint
        • Strategy Overview
          • Marketing Strategy
          • Product Strategy
          • Channel Strategy
  22. Assumptions & Acronyms Used
  23. Research Methodology

List of Tables

  • Table 1: Global Market Value (USD Million) Forecast by Region, 2020-2035
  • Table 2: Global Market Volume (Metric Tons) Forecast by Region, 2020-2035
  • Table 3: Global Market Value (USD Million) Forecast by Product Forms, 2020-2035
  • Table 4: Global Market Volume (Metric Tons) Forecast by Product Forms, 2020-2035
  • Table 5: Global Market Value (USD Million) Forecast by Flavours Type, 2020-2035
  • Table 6: Global Market Volume (Metric Tons) Forecast by Flavours Type, 2020-2035
  • Table 7: Global Market Value (USD Million) Forecast by End Users, 2020-2035
  • Table 8: Global Market Volume (Metric Tons) Forecast by End Users, 2020-2035
  • Table 9: Global Market Value (USD Million) Forecast by Sales Channel, 2020-2035
  • Table 10: Global Market Volume (Metric Tons) Forecast by Sales Channel, 2020-2035
  • Table 11: Global Market Value (USD Million) Forecast by Functionality, 2020-2035
  • Table 12: Global Market Volume (Metric Tons) Forecast by Functionality, 2020-2035
  • Table 13: USA Market Value (USD Million) Forecast by Country, 2020-2035
  • Table 14: USA Market Volume (Metric Tons) Forecast by Country, 2020-2035
  • Table 15: USA Market Value (USD Million) Forecast by Product Forms, 2020-2035
  • Table 16: USA Market Volume (Metric Tons) Forecast by Product Forms, 2020-2035
  • Table 17: USA Market Value (USD Million) Forecast by Flavours Type, 2020-2035
  • Table 18: USA Market Volume (Metric Tons) Forecast by Flavours Type, 2020-2035
  • Table 19: USA Market Value (USD Million) Forecast by End Users, 2020-2035
  • Table 20: USA Market Volume (Metric Tons) Forecast by End Users, 2020-2035
  • Table 21: USA Market Value (USD Million) Forecast by Sales Channel, 2020-2035
  • Table 22: USA Market Volume (Metric Tons) Forecast by Sales Channel, 2020-2035
  • Table 23: USA Market Value (USD Million) Forecast by Functionality, 2020-2035
  • Table 24: USA Market Volume (Metric Tons) Forecast by Functionality, 2020-2035
  • Table 25: Latin America Market Value (USD Million) Forecast by Country, 2020-2035
  • Table 26: Latin America Market Volume (Metric Tons) Forecast by Country, 2020-2035
  • Table 27: Latin America Market Value (USD Million) Forecast by Product Forms, 2020-2035
  • Table 28: Latin America Market Volume (Metric Tons) Forecast by Product Forms, 2020-2035
  • Table 29: Latin America Market Value (USD Million) Forecast by Flavours Type, 2020-2035
  • Table 30: Latin America Market Volume (Metric Tons) Forecast by Flavours Type, 2020-2035
  • Table 31: Latin America Market Value (USD Million) Forecast by End Users, 2020-2035
  • Table 32: Latin America Market Volume (Metric Tons) Forecast by End Users, 2020-2035
  • Table 33: Latin America Market Value (USD Million) Forecast by Sales Channel, 2020-2035
  • Table 34: Latin America Market Volume (Metric Tons) Forecast by Sales Channel, 2020-2035
  • Table 35: Latin America Market Value (USD Million) Forecast by Functionality, 2020-2035
  • Table 36: Latin America Market Volume (Metric Tons) Forecast by Functionality, 2020-2035
  • Table 37: Western Europe Market Value (USD Million) Forecast by Country, 2020-2035
  • Table 38: Western Europe Market Volume (Metric Tons) Forecast by Country, 2020-2035
  • Table 39: Western Europe Market Value (USD Million) Forecast by Product Forms, 2020-2035
  • Table 40: Western Europe Market Volume (Metric Tons) Forecast by Product Forms, 2020-2035
  • Table 41: Western Europe Market Value (USD Million) Forecast by Flavours Type, 2020-2035
  • Table 42: Western Europe Market Volume (Metric Tons) Forecast by Flavours Type, 2020-2035
  • Table 43: Western Europe Market Value (USD Million) Forecast by End Users, 2020-2035
  • Table 44: Western Europe Market Volume (Metric Tons) Forecast by End Users, 2020-2035
  • Table 45: Western Europe Market Value (USD Million) Forecast by Sales Channel, 2020-2035
  • Table 46: Western Europe Market Volume (Metric Tons) Forecast by Sales Channel, 2020-2035
  • Table 47: Western Europe Market Value (USD Million) Forecast by Functionality, 2020-2035
  • Table 48: Western Europe Market Volume (Metric Tons) Forecast by Functionality, 2020-2035
  • Table 49: Eastern Europe Market Value (USD Million) Forecast by Country, 2020-2035
  • Table 50: Eastern Europe Market Volume (Metric Tons) Forecast by Country, 2020-2035
  • Table 51: Eastern Europe Market Value (USD Million) Forecast by Product Forms, 2020-2035
  • Table 52: Eastern Europe Market Volume (Metric Tons) Forecast by Product Forms, 2020-2035
  • Table 53: Eastern Europe Market Value (USD Million) Forecast by Flavours Type, 2020-2035
  • Table 54: Eastern Europe Market Volume (Metric Tons) Forecast by Flavours Type, 2020-2035
  • Table 55: Eastern Europe Market Value (USD Million) Forecast by End Users, 2020-2035
  • Table 56: Eastern Europe Market Volume (Metric Tons) Forecast by End Users, 2020-2035
  • Table 57: Eastern Europe Market Value (USD Million) Forecast by Sales Channel, 2020-2035
  • Table 58: Eastern Europe Market Volume (Metric Tons) Forecast by Sales Channel, 2020-2035
  • Table 59: Eastern Europe Market Value (USD Million) Forecast by Functionality, 2020-2035
  • Table 60: Eastern Europe Market Volume (Metric Tons) Forecast by Functionality, 2020-2035
  • Table 61: East Asia Market Value (USD Million) Forecast by Country, 2020-2035
  • Table 62: East Asia Market Volume (Metric Tons) Forecast by Country, 2020-2035
  • Table 63: East Asia Market Value (USD Million) Forecast by Product Forms, 2020-2035
  • Table 64: East Asia Market Volume (Metric Tons) Forecast by Product Forms, 2020-2035
  • Table 65: East Asia Market Value (USD Million) Forecast by Flavours Type, 2020-2035
  • Table 66: East Asia Market Volume (Metric Tons) Forecast by Flavours Type, 2020-2035
  • Table 67: East Asia Market Value (USD Million) Forecast by End Users, 2020-2035
  • Table 68: East Asia Market Volume (Metric Tons) Forecast by End Users, 2020-2035
  • Table 69: East Asia Market Value (USD Million) Forecast by Sales Channel, 2020-2035
  • Table 70: East Asia Market Volume (Metric Tons) Forecast by Sales Channel, 2020-2035
  • Table 71: East Asia Market Value (USD Million) Forecast by Functionality, 2020-2035
  • Table 72: East Asia Market Volume (Metric Tons) Forecast by Functionality, 2020-2035
  • Table 73: South Asia & Pacific Market Value (USD Million) Forecast by Country, 2020-2035
  • Table 74: South Asia & Pacific Market Volume (Metric Tons) Forecast by Country, 2020-2035
  • Table 75: South Asia & Pacific Market Value (USD Million) Forecast by Product Forms, 2020-2035
  • Table 76: South Asia & Pacific Market Volume (Metric Tons) Forecast by Product Forms, 2020-2035
  • Table 77: South Asia & Pacific Market Value (USD Million) Forecast by Flavours Type, 2020-2035
  • Table 78: South Asia & Pacific Market Volume (Metric Tons) Forecast by Flavours Type, 2020-2035
  • Table 79: South Asia & Pacific Market Value (USD Million) Forecast by End Users, 2020-2035
  • Table 80: South Asia & Pacific Market Volume (Metric Tons) Forecast by End Users, 2020-2035
  • Table 81: South Asia & Pacific Market Value (USD Million) Forecast by Sales Channel, 2020-2035
  • Table 82: South Asia & Pacific Market Volume (Metric Tons) Forecast by Sales Channel, 2020-2035
  • Table 83: South Asia & Pacific Market Value (USD Million) Forecast by Functionality, 2020-2035
  • Table 84: South Asia & Pacific Market Volume (Metric Tons) Forecast by Functionality, 2020-2035
  • Table 85: Middle East and Africa Market Value (USD Million) Forecast by Country, 2020-2035
  • Table 86: Middle East and Africa Market Volume (Metric Tons) Forecast by Country, 2020-2035
  • Table 87: Middle East and Africa Market Value (USD Million) Forecast by Product Forms, 2020-2035
  • Table 88: Middle East and Africa Market Volume (Metric Tons) Forecast by Product Forms, 2020-2035
  • Table 89: Middle East and Africa Market Value (USD Million) Forecast by Flavours Type, 2020-2035
  • Table 90: Middle East and Africa Market Volume (Metric Tons) Forecast by Flavours Type, 2020-2035
  • Table 91: Middle East and Africa Market Value (USD Million) Forecast by End Users, 2020-2035
  • Table 92: Middle East and Africa Market Volume (Metric Tons) Forecast by End Users, 2020-2035
  • Table 93: Middle East and Africa Market Value (USD Million) Forecast by Sales Channel, 2020-2035
  • Table 94: Middle East and Africa Market Volume (Metric Tons) Forecast by Sales Channel, 2020-2035
  • Table 95: Middle East and Africa Market Value (USD Million) Forecast by Functionality, 2020-2035
  • Table 96: Middle East and Africa Market Volume (Metric Tons) Forecast by Functionality, 2020-2035

List of Figures

  • Figure 1: Global Market Volume (Metric Tons) Forecast 2020-2035
  • Figure 2: Global Market Pricing Analysis
  • Figure 3: Global Market Value (USD Million) Forecast 2020-2035
  • Figure 4: Global Market Value Share and BPS Analysis by Product Forms, 2025 and 2035
  • Figure 5: Global Market Y-o-Y Growth Comparison by Product Forms, 2025-2035
  • Figure 6: Global Market Attractiveness Analysis by Product Forms
  • Figure 7: Global Market Value Share and BPS Analysis by Flavours Type, 2025 and 2035
  • Figure 8: Global Market Y-o-Y Growth Comparison by Flavours Type, 2025-2035
  • Figure 9: Global Market Attractiveness Analysis by Flavours Type
  • Figure 10: Global Market Value Share and BPS Analysis by End Users, 2025 and 2035
  • Figure 11: Global Market Y-o-Y Growth Comparison by End Users, 2025-2035
  • Figure 12: Global Market Attractiveness Analysis by End Users
  • Figure 13: Global Market Value Share and BPS Analysis by Sales Channel, 2025 and 2035
  • Figure 14: Global Market Y-o-Y Growth Comparison by Sales Channel, 2025-2035
  • Figure 15: Global Market Attractiveness Analysis by Sales Channel
  • Figure 16: Global Market Value Share and BPS Analysis by Functionality, 2025 and 2035
  • Figure 17: Global Market Y-o-Y Growth Comparison by Functionality, 2025-2035
  • Figure 18: Global Market Attractiveness Analysis by Functionality
  • Figure 19: Global Market Value (USD Million) Share and BPS Analysis by Region, 2025 and 2035
  • Figure 20: Global Market Y-o-Y Growth Comparison by Region, 2025-2035
  • Figure 21: Global Market Attractiveness Analysis by Region
  • Figure 22: USA Market Incremental $ Opportunity, 2025-2035
  • Figure 23: Latin America Market Incremental $ Opportunity, 2025-2035
  • Figure 24: Western Europe Market Incremental $ Opportunity, 2025-2035
  • Figure 25: Eastern Europe Market Incremental $ Opportunity, 2025-2035
  • Figure 26: East Asia Market Incremental $ Opportunity, 2025-2035
  • Figure 27: South Asia & Pacific Market Incremental $ Opportunity, 2025-2035
  • Figure 28: Middle East and Africa Market Incremental $ Opportunity, 2025-2035
  • Figure 29: USA Market Value Share and BPS Analysis by Country, 2025 and 2035
  • Figure 30: USA Market Value Share and BPS Analysis by Product Forms, 2025 and 2035
  • Figure 31: USA Market Y-o-Y Growth Comparison by Product Forms, 2025-2035
  • Figure 32: USA Market Attractiveness Analysis by Product Forms
  • Figure 33: USA Market Value Share and BPS Analysis by Flavours Type, 2025 and 2035
  • Figure 34: USA Market Y-o-Y Growth Comparison by Flavours Type, 2025-2035
  • Figure 35: USA Market Attractiveness Analysis by Flavours Type
  • Figure 36: USA Market Value Share and BPS Analysis by End Users, 2025 and 2035
  • Figure 37: USA Market Y-o-Y Growth Comparison by End Users, 2025-2035
  • Figure 38: USA Market Attractiveness Analysis by End Users
  • Figure 39: USA Market Value Share and BPS Analysis by Sales Channel, 2025 and 2035
  • Figure 40: USA Market Y-o-Y Growth Comparison by Sales Channel, 2025-2035
  • Figure 41: USA Market Attractiveness Analysis by Sales Channel
  • Figure 42: USA Market Value Share and BPS Analysis by Functionality, 2025 and 2035
  • Figure 43: USA Market Y-o-Y Growth Comparison by Functionality, 2025-2035
  • Figure 44: USA Market Attractiveness Analysis by Functionality
  • Figure 45: Latin America Market Value Share and BPS Analysis by Country, 2025 and 2035
  • Figure 46: Latin America Market Value Share and BPS Analysis by Product Forms, 2025 and 2035
  • Figure 47: Latin America Market Y-o-Y Growth Comparison by Product Forms, 2025-2035
  • Figure 48: Latin America Market Attractiveness Analysis by Product Forms
  • Figure 49: Latin America Market Value Share and BPS Analysis by Flavours Type, 2025 and 2035
  • Figure 50: Latin America Market Y-o-Y Growth Comparison by Flavours Type, 2025-2035
  • Figure 51: Latin America Market Attractiveness Analysis by Flavours Type
  • Figure 52: Latin America Market Value Share and BPS Analysis by End Users, 2025 and 2035
  • Figure 53: Latin America Market Y-o-Y Growth Comparison by End Users, 2025-2035
  • Figure 54: Latin America Market Attractiveness Analysis by End Users
  • Figure 55: Latin America Market Value Share and BPS Analysis by Sales Channel, 2025 and 2035
  • Figure 56: Latin America Market Y-o-Y Growth Comparison by Sales Channel, 2025-2035
  • Figure 57: Latin America Market Attractiveness Analysis by Sales Channel
  • Figure 58: Latin America Market Value Share and BPS Analysis by Functionality, 2025 and 2035
  • Figure 59: Latin America Market Y-o-Y Growth Comparison by Functionality, 2025-2035
  • Figure 60: Latin America Market Attractiveness Analysis by Functionality
  • Figure 61: Western Europe Market Value Share and BPS Analysis by Country, 2025 and 2035
  • Figure 62: Western Europe Market Value Share and BPS Analysis by Product Forms, 2025 and 2035
  • Figure 63: Western Europe Market Y-o-Y Growth Comparison by Product Forms, 2025-2035
  • Figure 64: Western Europe Market Attractiveness Analysis by Product Forms
  • Figure 65: Western Europe Market Value Share and BPS Analysis by Flavours Type, 2025 and 2035
  • Figure 66: Western Europe Market Y-o-Y Growth Comparison by Flavours Type, 2025-2035
  • Figure 67: Western Europe Market Attractiveness Analysis by Flavours Type
  • Figure 68: Western Europe Market Value Share and BPS Analysis by End Users, 2025 and 2035
  • Figure 69: Western Europe Market Y-o-Y Growth Comparison by End Users, 2025-2035
  • Figure 70: Western Europe Market Attractiveness Analysis by End Users
  • Figure 71: Western Europe Market Value Share and BPS Analysis by Sales Channel, 2025 and 2035
  • Figure 72: Western Europe Market Y-o-Y Growth Comparison by Sales Channel, 2025-2035
  • Figure 73: Western Europe Market Attractiveness Analysis by Sales Channel
  • Figure 74: Western Europe Market Value Share and BPS Analysis by Functionality, 2025 and 2035
  • Figure 75: Western Europe Market Y-o-Y Growth Comparison by Functionality, 2025-2035
  • Figure 76: Western Europe Market Attractiveness Analysis by Functionality
  • Figure 77: Eastern Europe Market Value Share and BPS Analysis by Country, 2025 and 2035
  • Figure 78: Eastern Europe Market Value Share and BPS Analysis by Product Forms, 2025 and 2035
  • Figure 79: Eastern Europe Market Y-o-Y Growth Comparison by Product Forms, 2025-2035
  • Figure 80: Eastern Europe Market Attractiveness Analysis by Product Forms
  • Figure 81: Eastern Europe Market Value Share and BPS Analysis by Flavours Type, 2025 and 2035
  • Figure 82: Eastern Europe Market Y-o-Y Growth Comparison by Flavours Type, 2025-2035
  • Figure 83: Eastern Europe Market Attractiveness Analysis by Flavours Type
  • Figure 84: Eastern Europe Market Value Share and BPS Analysis by End Users, 2025 and 2035
  • Figure 85: Eastern Europe Market Y-o-Y Growth Comparison by End Users, 2025-2035
  • Figure 86: Eastern Europe Market Attractiveness Analysis by End Users
  • Figure 87: Eastern Europe Market Value Share and BPS Analysis by Sales Channel, 2025 and 2035
  • Figure 88: Eastern Europe Market Y-o-Y Growth Comparison by Sales Channel, 2025-2035
  • Figure 89: Eastern Europe Market Attractiveness Analysis by Sales Channel
  • Figure 90: Eastern Europe Market Value Share and BPS Analysis by Functionality, 2025 and 2035
  • Figure 91: Eastern Europe Market Y-o-Y Growth Comparison by Functionality, 2025-2035
  • Figure 92: Eastern Europe Market Attractiveness Analysis by Functionality
  • Figure 93: East Asia Market Value Share and BPS Analysis by Country, 2025 and 2035
  • Figure 94: East Asia Market Value Share and BPS Analysis by Product Forms, 2025 and 2035
  • Figure 95: East Asia Market Y-o-Y Growth Comparison by Product Forms, 2025-2035
  • Figure 96: East Asia Market Attractiveness Analysis by Product Forms
  • Figure 97: East Asia Market Value Share and BPS Analysis by Flavours Type, 2025 and 2035
  • Figure 98: East Asia Market Y-o-Y Growth Comparison by Flavours Type, 2025-2035
  • Figure 99: East Asia Market Attractiveness Analysis by Flavours Type
  • Figure 100: East Asia Market Value Share and BPS Analysis by End Users, 2025 and 2035
  • Figure 101: East Asia Market Y-o-Y Growth Comparison by End Users, 2025-2035
  • Figure 102: East Asia Market Attractiveness Analysis by End Users
  • Figure 103: East Asia Market Value Share and BPS Analysis by Sales Channel, 2025 and 2035
  • Figure 104: East Asia Market Y-o-Y Growth Comparison by Sales Channel, 2025-2035
  • Figure 105: East Asia Market Attractiveness Analysis by Sales Channel
  • Figure 106: East Asia Market Value Share and BPS Analysis by Functionality, 2025 and 2035
  • Figure 107: East Asia Market Y-o-Y Growth Comparison by Functionality, 2025-2035
  • Figure 108: East Asia Market Attractiveness Analysis by Functionality
  • Figure 109: South Asia & Pacific Market Value Share and BPS Analysis by Country, 2025 and 2035
  • Figure 110: South Asia & Pacific Market Value Share and BPS Analysis by Product Forms, 2025 and 2035
  • Figure 111: South Asia & Pacific Market Y-o-Y Growth Comparison by Product Forms, 2025-2035
  • Figure 112: South Asia & Pacific Market Attractiveness Analysis by Product Forms
  • Figure 113: South Asia & Pacific Market Value Share and BPS Analysis by Flavours Type, 2025 and 2035
  • Figure 114: South Asia & Pacific Market Y-o-Y Growth Comparison by Flavours Type, 2025-2035
  • Figure 115: South Asia & Pacific Market Attractiveness Analysis by Flavours Type
  • Figure 116: South Asia & Pacific Market Value Share and BPS Analysis by End Users, 2025 and 2035
  • Figure 117: South Asia & Pacific Market Y-o-Y Growth Comparison by End Users, 2025-2035
  • Figure 118: South Asia & Pacific Market Attractiveness Analysis by End Users
  • Figure 119: South Asia & Pacific Market Value Share and BPS Analysis by Sales Channel, 2025 and 2035
  • Figure 120: South Asia & Pacific Market Y-o-Y Growth Comparison by Sales Channel, 2025-2035
  • Figure 121: South Asia & Pacific Market Attractiveness Analysis by Sales Channel
  • Figure 122: South Asia & Pacific Market Value Share and BPS Analysis by Functionality, 2025 and 2035
  • Figure 123: South Asia & Pacific Market Y-o-Y Growth Comparison by Functionality, 2025-2035
  • Figure 124: South Asia & Pacific Market Attractiveness Analysis by Functionality
  • Figure 125: Middle East and Africa Market Value Share and BPS Analysis by Country, 2025 and 2035
  • Figure 126: Middle East and Africa Market Value Share and BPS Analysis by Product Forms, 2025 and 2035
  • Figure 127: Middle East and Africa Market Y-o-Y Growth Comparison by Product Forms, 2025-2035
  • Figure 128: Middle East and Africa Market Attractiveness Analysis by Product Forms
  • Figure 129: Middle East and Africa Market Value Share and BPS Analysis by Flavours Type, 2025 and 2035
  • Figure 130: Middle East and Africa Market Y-o-Y Growth Comparison by Flavours Type, 2025-2035
  • Figure 131: Middle East and Africa Market Attractiveness Analysis by Flavours Type
  • Figure 132: Middle East and Africa Market Value Share and BPS Analysis by End Users, 2025 and 2035
  • Figure 133: Middle East and Africa Market Y-o-Y Growth Comparison by End Users, 2025-2035
  • Figure 134: Middle East and Africa Market Attractiveness Analysis by End Users
  • Figure 135: Middle East and Africa Market Value Share and BPS Analysis by Sales Channel, 2025 and 2035
  • Figure 136: Middle East and Africa Market Y-o-Y Growth Comparison by Sales Channel, 2025-2035
  • Figure 137: Middle East and Africa Market Attractiveness Analysis by Sales Channel
  • Figure 138: Middle East and Africa Market Value Share and BPS Analysis by Functionality, 2025 and 2035
  • Figure 139: Middle East and Africa Market Y-o-Y Growth Comparison by Functionality, 2025-2035
  • Figure 140: Middle East and Africa Market Attractiveness Analysis by Functionality
  • Figure 141: Global Market - Tier Structure Analysis
  • Figure 142: Global Market - Company Share Analysis

Frequently Asked Questions

What is the projected size of the glutathione supplements market in 2025?

The market is valued at USD 381.5 million in 2025.

What is the forecasted size of the glutathione supplements market by 2035?

The market is projected to reach USD 729.3 million by 2035.

What is the CAGR of the glutathione supplements market from 2025 to 2035?

The market is expected to grow at a CAGR of 6.7%.

Which product form holds the largest share in the glutathione supplements market?

Capsules are the leading product form with a 30% market share in 2025.

Which country is expected to have the highest CAGR in the glutathione supplements market from 2025 to 2035?

Japan is projected to have the highest CAGR at 7.2% during this period.

Explore Similar Insights

Future Market Insights

Glutathione Supplements Market