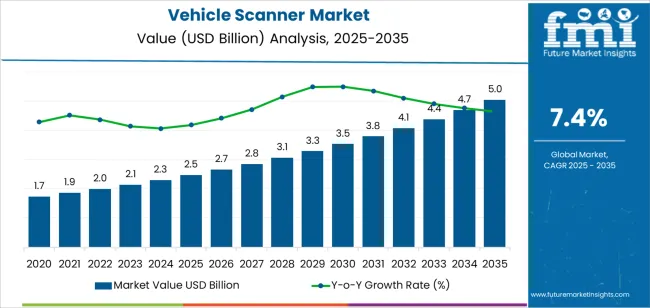
The vehicle scanner market is projected to reach a valuation of USD 2.3 billion in 2024, with a potential growth of USD 4.7 billion by 2034. The market is expected to witness a steady rise, with a promising CAGR of 7.4% from 2024 to 2034.
The growing demand for advanced scanning technologies to improve vehicle safety and performance is the immediate driver of the growth of the vehicle scanner industry.
Key dynamics driving the vehicle scanner market are:
Attributes | Details |
---|---|
Estimated Vehicle Scanner Market Size for 2024 | USD 2.3 billion |
Forecasted Vehicle Scanner Market Value for 2034 | USD 4.7 billion |
Projected Value-based Market CAGR for 2024 to 2034 | 7.4% |
This section provides a detailed analysis of the vehicle scanner market over the past five years and highlights the expected trends in the industry. The market has experienced a substantial historical CAGR of 9.1%, but it is gradually becoming more restrictive. The industry is anticipated to continue to develop at an enduring pace of 7.4% CAGR until 2034.
Historical CAGR (2019 to 2023) | 9.1% |
---|---|
Forecast CAGR (2024 to 2034) | 7.4% |
The high initial investment costs, operational challenges in integrating scanning systems into current infrastructure, privacy and regulatory compliance issues, and other aspects impede the expansion of the vehicle scanner sector.
Crucial factors that are anticipated to disturb the demand for vehicle scanners through 2034 include:
Market players are expected to be shrewd and flexible over the anticipated period, as these challenging attributes position the industry for future success.
Integration of AI and Machine Learning Climb Sharply in the Vehicle Scanner Sector
Algorithms driven by AI become more complex and precise as the technology develops. This has a significant effect on the automotive sector, as AI-powered algorithms improve the precision and effectiveness of vehicle scanning.
The ability of vehicle scanners to scan automobiles more rapidly and precisely than ever before, owing to AI-powered algorithms, is helping propel the market for these cutting-edge scanning technologies.
Consequently, numerous automakers and maintenance facilities are allocating funds toward these sophisticated scanning systems to enhance business processes and boost customer satisfaction in the forthcoming decade.
Emphasis on Multi-Modal Scanning Rumbles in Automobile Economy
The automobile industry is witnessing a surge in demand for rigid vehicle scanners due to the integration of various scanning technologies. Adopting advanced scanning technologies in the industry has become crucial for comprehensive threat detection and prevention.
These scanning technologies include X-ray, millimeter-wave, and terahertz scanning systems, which can identify threats such as explosives, weapons, and other contraband hidden in vehicles.
Employing such rigid vehicle scanners ensures the safety and security of passengers, drivers, and the general public by preventing the entry of dangerous items into vehicles. The increasing emphasis on public safety and the need to comply with stringent government regulations drive the demand for rigid vehicle scanners in the automobile industry.
Amplified Integration with Digital Platforms Soars Vehicle Scanning Demand
The vehicle scanner market is developing due to the integration of scanning data into digital security ecosystems for real-time monitoring and analysis. With the increasing need for enhanced security measures and efficient traffic management, the demand for vehicle scanners has risen significantly in recent years.
Incorporating advanced scanning technologies such as laser scanning, ultrasonic scanning, and magnetic resonance imaging (MRI) has further expanded the scope of the market.
These technologies provide accurate and reliable data on vehicle identification, weight, dimensions, and other parameters, enabling authorities to monitor and regulate traffic flow effectively.
The growing adoption of cloud-based systems and Internet of Things (IoT) technologies has opened up new avenues for the vehicle scanner market, enabling seamless data integration and analysis across multiple platforms and devices. The mounting demand for sophisticated security and traffic management systems is anticipated to propel the market's expansion in the preceding decade.
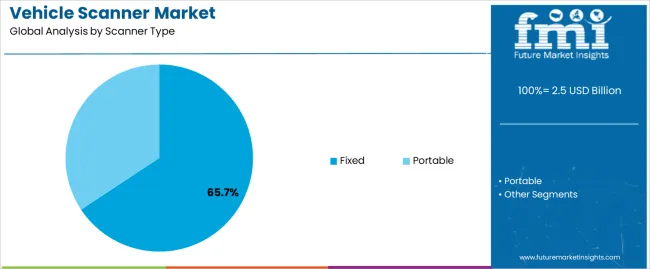
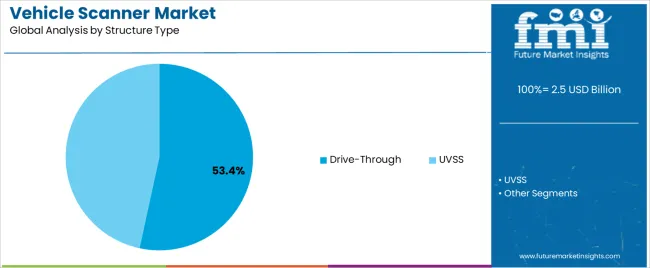
This section delves into a detailed analysis of specific market sectors within the vehicle scanner industry. The research primarily focuses on two main topics: the portable vehicle scanner segment and the drive-through structure segment.
This section aims to provide a comprehensive examination of these segments, enabling readers to better understand their significance in the broader context of the vehicle scanner industry.
Attributes | Details |
---|---|
Top Scanner Type | Portable Vehicle Scanner |
Forecasted CAGR from 2024 to 2034 | 7.2% |
During the period from 2024 to 2034, the portable vehicle scanner emerged as the most widely adopted type of vehicle scanner in the industry, exhibiting a CAGR of 7.2%.
However, this CAGR represents a decrease from the prior period of 2019 to 2023, during which the portable vehicle scanner type experienced a higher growth rate of 8.8%. The development of the portable vehicle scanner segment was driven by several factors, which are expected to be discussed further below:
Attributes | Details |
---|---|
Top Structure Type | Drive-Through |
Forecasted CAGR from 2024 to 2034 | 7.0% |
With a compound annual growth rate of 7.0%, the drive-through vehicle scanner structure became the most popular in the market between 2024 and 2034.
On the other hand, compared to the previous period of 2019 to 2023, when the drive-through vehicle scanner structure enjoyed a greater growth rate of 8.6%, this CAGR reflects a reduction. Some of the elements that propelled the growth of the drive-through vehicle scanner industry are anticipated to be covered in more detail below:
This section delves into the vehicle scanner sectors of some of the most influential nations on the global stage, including the United States, China, Japan, South Korea, and the United Kingdom.
A comprehensive investigation is expected to explore the various factors impacting these countries' demand for, adoption of, and engagement with vehicle scanners. The analysis is anticipated to provide a detailed understanding of the current state of vehicle scanning technology in these nations and their potential for growth in the forthcoming decade.
Countries | Forecasted CAGR from 2024 to 2034 |
---|---|
United States | 7.7% |
United Kingdom | 8.6% |
China | 7.9% |
Japan | 8.5% |
South Korea | 9.0% |
Through 2034, the vehicle scanner market in the United States is anticipated to expand at a CAGR of 7.7%. In comparison to the CAGR of 9.8% recorded between 2019 and 2023, this growth rate is lower.
The sector is expected to achieve a worth of USD 829.6 million by 2034, notwithstanding the lackluster expansion. The need for automobile scanners is driven by the following factors, which are likely to be very important for the industry's growth:
With a CAGR of 8.6% until 2034, the car scanner market in the United Kingdom is predicted to expand significantly in the upcoming years. The sector has already demonstrated tremendous promise, with a remarkable 12.9% CAGR predicted between 2019 and 2023.
The market is expected to be worth USD 189.7 million, indicating that the automotive industry has ample room to develop and attract investment. The following are some of the main trends:
China's vehicle scanner market is experiencing a remarkable upswing in demand, with industry experts predicting a CAGR of 7.9%. By 2034, the sector is expected to be valued at a staggering USD 724.0 million. Furthermore, China’s automobile scanning industry witnessed a substantial CAGR of 11.3% between 2019 and 2023. The growth is attributed to these trends:
The demand for vehicle scanners in Japan is soaring dramatically, and the industry is anticipated to grow at a CAGR of 8.5% through 2034, meaning that by that year, it should be valued at around USD 492.3 million. The Japan automobile scanner market's prior compound annual growth rate was about 12.8%. Among the main motivators are:
There is a forecast that the vehicle scanner market in South Korea is projected to develop at a potential CAGR of 9.0% by 2034, resulting in a valuation of USD 292.0 million. It should be recalled that the country previously saw a higher CAGR of 15.6% from 2019 to 2023. The following are some of the main trends:
Market players in the vehicle scanner industry are expected to grow substantially in the ensuing decade due to an array of significant parameters. Technological advancements, including sensor technologies, artificial intelligence, and machine learning, should make more complex and precise scanning systems possible.
Integration and interoperability are of utmost importance, with manufacturers concentrating on developing scalable, modular systems that can be easily integrated into preexisting security infrastructure.
Amplified collaboration is also expected between industry players, research institutions, and government agencies to drive innovation and address emerging challenges in vehicle scanning technology. Furthermore, market players prioritize sustainability by developing eco-friendly and energy-efficient scanning solutions.
The vehicle scanner industry players are expected to adapt to evolving market demands and technological advancements to stay competitive and meet the increasingly complex security needs of the automotive sector in the forthcoming decade.
Recent Developments in the Vehicle Scanner Market
Table 1: Global Market Value (US$ Million) Forecast by Region, 2019 to 2034
Table 2: Global Market Volume (Units) Forecast by Region, 2019 to 2034
Table 3: Global Market Value (US$ Million) Forecast by Scanner Type, 2019 to 2034
Table 4: Global Market Volume (Units) Forecast by Scanner Type, 2019 to 2034
Table 5: Global Market Value (US$ Million) Forecast by Structure Type, 2019 to 2034
Table 6: Global Market Volume (Units) Forecast by Structure Type, 2019 to 2034
Table 7: Global Market Value (US$ Million) Forecast by Application, 2019 to 2034
Table 8: Global Market Volume (Units) Forecast by Application, 2019 to 2034
Table 9: Global Market Value (US$ Million) Forecast by Component, 2019 to 2034
Table 10: Global Market Volume (Units) Forecast by Component, 2019 to 2034
Table 11: North America Market Value (US$ Million) Forecast by Country, 2019 to 2034
Table 12: North America Market Volume (Units) Forecast by Country, 2019 to 2034
Table 13: North America Market Value (US$ Million) Forecast by Scanner Type, 2019 to 2034
Table 14: North America Market Volume (Units) Forecast by Scanner Type, 2019 to 2034
Table 15: North America Market Value (US$ Million) Forecast by Structure Type, 2019 to 2034
Table 16: North America Market Volume (Units) Forecast by Structure Type, 2019 to 2034
Table 17: North America Market Value (US$ Million) Forecast by Application, 2019 to 2034
Table 18: North America Market Volume (Units) Forecast by Application, 2019 to 2034
Table 19: North America Market Value (US$ Million) Forecast by Component, 2019 to 2034
Table 20: North America Market Volume (Units) Forecast by Component, 2019 to 2034
Table 21: Latin America Market Value (US$ Million) Forecast by Country, 2019 to 2034
Table 22: Latin America Market Volume (Units) Forecast by Country, 2019 to 2034
Table 23: Latin America Market Value (US$ Million) Forecast by Scanner Type, 2019 to 2034
Table 24: Latin America Market Volume (Units) Forecast by Scanner Type, 2019 to 2034
Table 25: Latin America Market Value (US$ Million) Forecast by Structure Type, 2019 to 2034
Table 26: Latin America Market Volume (Units) Forecast by Structure Type, 2019 to 2034
Table 27: Latin America Market Value (US$ Million) Forecast by Application, 2019 to 2034
Table 28: Latin America Market Volume (Units) Forecast by Application, 2019 to 2034
Table 29: Latin America Market Value (US$ Million) Forecast by Component, 2019 to 2034
Table 30: Latin America Market Volume (Units) Forecast by Component, 2019 to 2034
Table 31: Europe Market Value (US$ Million) Forecast by Country, 2019 to 2034
Table 32: Europe Market Volume (Units) Forecast by Country, 2019 to 2034
Table 33: Europe Market Value (US$ Million) Forecast by Scanner Type, 2019 to 2034
Table 34: Europe Market Volume (Units) Forecast by Scanner Type, 2019 to 2034
Table 35: Europe Market Value (US$ Million) Forecast by Structure Type, 2019 to 2034
Table 36: Europe Market Volume (Units) Forecast by Structure Type, 2019 to 2034
Table 37: Europe Market Value (US$ Million) Forecast by Application, 2019 to 2034
Table 38: Europe Market Volume (Units) Forecast by Application, 2019 to 2034
Table 39: Europe Market Value (US$ Million) Forecast by Component, 2019 to 2034
Table 40: Europe Market Volume (Units) Forecast by Component, 2019 to 2034
Table 41: East Asia Market Value (US$ Million) Forecast by Country, 2019 to 2034
Table 42: East Asia Market Volume (Units) Forecast by Country, 2019 to 2034
Table 43: East Asia Market Value (US$ Million) Forecast by Scanner Type, 2019 to 2034
Table 44: East Asia Market Volume (Units) Forecast by Scanner Type, 2019 to 2034
Table 45: East Asia Market Value (US$ Million) Forecast by Structure Type, 2019 to 2034
Table 46: East Asia Market Volume (Units) Forecast by Structure Type, 2019 to 2034
Table 47: East Asia Market Value (US$ Million) Forecast by Application, 2019 to 2034
Table 48: East Asia Market Volume (Units) Forecast by Application, 2019 to 2034
Table 49: East Asia Market Value (US$ Million) Forecast by Component, 2019 to 2034
Table 50: East Asia Market Volume (Units) Forecast by Component, 2019 to 2034
Table 51: South Asia Market Value (US$ Million) Forecast by Country, 2019 to 2034
Table 52: South Asia Market Volume (Units) Forecast by Country, 2019 to 2034
Table 53: South Asia Market Value (US$ Million) Forecast by Scanner Type, 2019 to 2034
Table 54: South Asia Market Volume (Units) Forecast by Scanner Type, 2019 to 2034
Table 55: South Asia Market Value (US$ Million) Forecast by Structure Type, 2019 to 2034
Table 56: South Asia Market Volume (Units) Forecast by Structure Type, 2019 to 2034
Table 57: South Asia Market Value (US$ Million) Forecast by Application, 2019 to 2034
Table 58: South Asia Market Volume (Units) Forecast by Application, 2019 to 2034
Table 59: South Asia Market Value (US$ Million) Forecast by Component, 2019 to 2034
Table 60: South Asia Market Volume (Units) Forecast by Component, 2019 to 2034
Table 61: Oceania Market Value (US$ Million) Forecast by Country, 2019 to 2034
Table 62: Oceania Market Volume (Units) Forecast by Country, 2019 to 2034
Table 63: Oceania Market Value (US$ Million) Forecast by Scanner Type, 2019 to 2034
Table 64: Oceania Market Volume (Units) Forecast by Scanner Type, 2019 to 2034
Table 65: Oceania Market Value (US$ Million) Forecast by Structure Type, 2019 to 2034
Table 66: Oceania Market Volume (Units) Forecast by Structure Type, 2019 to 2034
Table 67: Oceania Market Value (US$ Million) Forecast by Application, 2019 to 2034
Table 68: Oceania Market Volume (Units) Forecast by Application, 2019 to 2034
Table 69: Oceania Market Value (US$ Million) Forecast by Component, 2019 to 2034
Table 70: Oceania Market Volume (Units) Forecast by Component, 2019 to 2034
Table 71: MEA Market Value (US$ Million) Forecast by Country, 2019 to 2034
Table 72: MEA Market Volume (Units) Forecast by Country, 2019 to 2034
Table 73: MEA Market Value (US$ Million) Forecast by Scanner Type, 2019 to 2034
Table 74: MEA Market Volume (Units) Forecast by Scanner Type, 2019 to 2034
Table 75: MEA Market Value (US$ Million) Forecast by Structure Type, 2019 to 2034
Table 76: MEA Market Volume (Units) Forecast by Structure Type, 2019 to 2034
Table 77: MEA Market Value (US$ Million) Forecast by Application, 2019 to 2034
Table 78: MEA Market Volume (Units) Forecast by Application, 2019 to 2034
Table 79: MEA Market Value (US$ Million) Forecast by Component, 2019 to 2034
Table 80: MEA Market Volume (Units) Forecast by Component, 2019 to 2034
Figure 1: Global Market Value (US$ Million) by Scanner Type, 2024 to 2034
Figure 2: Global Market Value (US$ Million) by Structure Type, 2024 to 2034
Figure 3: Global Market Value (US$ Million) by Application, 2024 to 2034
Figure 4: Global Market Value (US$ Million) by Component, 2024 to 2034
Figure 5: Global Market Value (US$ Million) by Region, 2024 to 2034
Figure 6: Global Market Value (US$ Million) Analysis by Region, 2019 to 2034
Figure 7: Global Market Volume (Units) Analysis by Region, 2019 to 2034
Figure 8: Global Market Value Share (%) and BPS Analysis by Region, 2024 to 2034
Figure 9: Global Market Y-o-Y Growth (%) Projections by Region, 2024 to 2034
Figure 10: Global Market Value (US$ Million) Analysis by Scanner Type, 2019 to 2034
Figure 11: Global Market Volume (Units) Analysis by Scanner Type, 2019 to 2034
Figure 12: Global Market Value Share (%) and BPS Analysis by Scanner Type, 2024 to 2034
Figure 13: Global Market Y-o-Y Growth (%) Projections by Scanner Type, 2024 to 2034
Figure 14: Global Market Value (US$ Million) Analysis by Structure Type, 2019 to 2034
Figure 15: Global Market Volume (Units) Analysis by Structure Type, 2019 to 2034
Figure 16: Global Market Value Share (%) and BPS Analysis by Structure Type, 2024 to 2034
Figure 17: Global Market Y-o-Y Growth (%) Projections by Structure Type, 2024 to 2034
Figure 18: Global Market Value (US$ Million) Analysis by Application, 2019 to 2034
Figure 19: Global Market Volume (Units) Analysis by Application, 2019 to 2034
Figure 20: Global Market Value Share (%) and BPS Analysis by Application, 2024 to 2034
Figure 21: Global Market Y-o-Y Growth (%) Projections by Application, 2024 to 2034
Figure 22: Global Market Value (US$ Million) Analysis by Component, 2019 to 2034
Figure 23: Global Market Volume (Units) Analysis by Component, 2019 to 2034
Figure 24: Global Market Value Share (%) and BPS Analysis by Component, 2024 to 2034
Figure 25: Global Market Y-o-Y Growth (%) Projections by Component, 2024 to 2034
Figure 26: Global Market Attractiveness by Scanner Type, 2024 to 2034
Figure 27: Global Market Attractiveness by Structure Type, 2024 to 2034
Figure 28: Global Market Attractiveness by Application, 2024 to 2034
Figure 29: Global Market Attractiveness by Component, 2024 to 2034
Figure 30: Global Market Attractiveness by Region, 2024 to 2034
Figure 31: North America Market Value (US$ Million) by Scanner Type, 2024 to 2034
Figure 32: North America Market Value (US$ Million) by Structure Type, 2024 to 2034
Figure 33: North America Market Value (US$ Million) by Application, 2024 to 2034
Figure 34: North America Market Value (US$ Million) by Component, 2024 to 2034
Figure 35: North America Market Value (US$ Million) by Country, 2024 to 2034
Figure 36: North America Market Value (US$ Million) Analysis by Country, 2019 to 2034
Figure 37: North America Market Volume (Units) Analysis by Country, 2019 to 2034
Figure 38: North America Market Value Share (%) and BPS Analysis by Country, 2024 to 2034
Figure 39: North America Market Y-o-Y Growth (%) Projections by Country, 2024 to 2034
Figure 40: North America Market Value (US$ Million) Analysis by Scanner Type, 2019 to 2034
Figure 41: North America Market Volume (Units) Analysis by Scanner Type, 2019 to 2034
Figure 42: North America Market Value Share (%) and BPS Analysis by Scanner Type, 2024 to 2034
Figure 43: North America Market Y-o-Y Growth (%) Projections by Scanner Type, 2024 to 2034
Figure 44: North America Market Value (US$ Million) Analysis by Structure Type, 2019 to 2034
Figure 45: North America Market Volume (Units) Analysis by Structure Type, 2019 to 2034
Figure 46: North America Market Value Share (%) and BPS Analysis by Structure Type, 2024 to 2034
Figure 47: North America Market Y-o-Y Growth (%) Projections by Structure Type, 2024 to 2034
Figure 48: North America Market Value (US$ Million) Analysis by Application, 2019 to 2034
Figure 49: North America Market Volume (Units) Analysis by Application, 2019 to 2034
Figure 50: North America Market Value Share (%) and BPS Analysis by Application, 2024 to 2034
Figure 51: North America Market Y-o-Y Growth (%) Projections by Application, 2024 to 2034
Figure 52: North America Market Value (US$ Million) Analysis by Component, 2019 to 2034
Figure 53: North America Market Volume (Units) Analysis by Component, 2019 to 2034
Figure 54: North America Market Value Share (%) and BPS Analysis by Component, 2024 to 2034
Figure 55: North America Market Y-o-Y Growth (%) Projections by Component, 2024 to 2034
Figure 56: North America Market Attractiveness by Scanner Type, 2024 to 2034
Figure 57: North America Market Attractiveness by Structure Type, 2024 to 2034
Figure 58: North America Market Attractiveness by Application, 2024 to 2034
Figure 59: North America Market Attractiveness by Component, 2024 to 2034
Figure 60: North America Market Attractiveness by Country, 2024 to 2034
Figure 61: Latin America Market Value (US$ Million) by Scanner Type, 2024 to 2034
Figure 62: Latin America Market Value (US$ Million) by Structure Type, 2024 to 2034
Figure 63: Latin America Market Value (US$ Million) by Application, 2024 to 2034
Figure 64: Latin America Market Value (US$ Million) by Component, 2024 to 2034
Figure 65: Latin America Market Value (US$ Million) by Country, 2024 to 2034
Figure 66: Latin America Market Value (US$ Million) Analysis by Country, 2019 to 2034
Figure 67: Latin America Market Volume (Units) Analysis by Country, 2019 to 2034
Figure 68: Latin America Market Value Share (%) and BPS Analysis by Country, 2024 to 2034
Figure 69: Latin America Market Y-o-Y Growth (%) Projections by Country, 2024 to 2034
Figure 70: Latin America Market Value (US$ Million) Analysis by Scanner Type, 2019 to 2034
Figure 71: Latin America Market Volume (Units) Analysis by Scanner Type, 2019 to 2034
Figure 72: Latin America Market Value Share (%) and BPS Analysis by Scanner Type, 2024 to 2034
Figure 73: Latin America Market Y-o-Y Growth (%) Projections by Scanner Type, 2024 to 2034
Figure 74: Latin America Market Value (US$ Million) Analysis by Structure Type, 2019 to 2034
Figure 75: Latin America Market Volume (Units) Analysis by Structure Type, 2019 to 2034
Figure 76: Latin America Market Value Share (%) and BPS Analysis by Structure Type, 2024 to 2034
Figure 77: Latin America Market Y-o-Y Growth (%) Projections by Structure Type, 2024 to 2034
Figure 78: Latin America Market Value (US$ Million) Analysis by Application, 2019 to 2034
Figure 79: Latin America Market Volume (Units) Analysis by Application, 2019 to 2034
Figure 80: Latin America Market Value Share (%) and BPS Analysis by Application, 2024 to 2034
Figure 81: Latin America Market Y-o-Y Growth (%) Projections by Application, 2024 to 2034
Figure 82: Latin America Market Value (US$ Million) Analysis by Component, 2019 to 2034
Figure 83: Latin America Market Volume (Units) Analysis by Component, 2019 to 2034
Figure 84: Latin America Market Value Share (%) and BPS Analysis by Component, 2024 to 2034
Figure 85: Latin America Market Y-o-Y Growth (%) Projections by Component, 2024 to 2034
Figure 86: Latin America Market Attractiveness by Scanner Type, 2024 to 2034
Figure 87: Latin America Market Attractiveness by Structure Type, 2024 to 2034
Figure 88: Latin America Market Attractiveness by Application, 2024 to 2034
Figure 89: Latin America Market Attractiveness by Component, 2024 to 2034
Figure 90: Latin America Market Attractiveness by Country, 2024 to 2034
Figure 91: Europe Market Value (US$ Million) by Scanner Type, 2024 to 2034
Figure 92: Europe Market Value (US$ Million) by Structure Type, 2024 to 2034
Figure 93: Europe Market Value (US$ Million) by Application, 2024 to 2034
Figure 94: Europe Market Value (US$ Million) by Component, 2024 to 2034
Figure 95: Europe Market Value (US$ Million) by Country, 2024 to 2034
Figure 96: Europe Market Value (US$ Million) Analysis by Country, 2019 to 2034
Figure 97: Europe Market Volume (Units) Analysis by Country, 2019 to 2034
Figure 98: Europe Market Value Share (%) and BPS Analysis by Country, 2024 to 2034
Figure 99: Europe Market Y-o-Y Growth (%) Projections by Country, 2024 to 2034
Figure 100: Europe Market Value (US$ Million) Analysis by Scanner Type, 2019 to 2034
Figure 101: Europe Market Volume (Units) Analysis by Scanner Type, 2019 to 2034
Figure 102: Europe Market Value Share (%) and BPS Analysis by Scanner Type, 2024 to 2034
Figure 103: Europe Market Y-o-Y Growth (%) Projections by Scanner Type, 2024 to 2034
Figure 104: Europe Market Value (US$ Million) Analysis by Structure Type, 2019 to 2034
Figure 105: Europe Market Volume (Units) Analysis by Structure Type, 2019 to 2034
Figure 106: Europe Market Value Share (%) and BPS Analysis by Structure Type, 2024 to 2034
Figure 107: Europe Market Y-o-Y Growth (%) Projections by Structure Type, 2024 to 2034
Figure 108: Europe Market Value (US$ Million) Analysis by Application, 2019 to 2034
Figure 109: Europe Market Volume (Units) Analysis by Application, 2019 to 2034
Figure 110: Europe Market Value Share (%) and BPS Analysis by Application, 2024 to 2034
Figure 111: Europe Market Y-o-Y Growth (%) Projections by Application, 2024 to 2034
Figure 112: Europe Market Value (US$ Million) Analysis by Component, 2019 to 2034
Figure 113: Europe Market Volume (Units) Analysis by Component, 2019 to 2034
Figure 114: Europe Market Value Share (%) and BPS Analysis by Component, 2024 to 2034
Figure 115: Europe Market Y-o-Y Growth (%) Projections by Component, 2024 to 2034
Figure 116: Europe Market Attractiveness by Scanner Type, 2024 to 2034
Figure 117: Europe Market Attractiveness by Structure Type, 2024 to 2034
Figure 118: Europe Market Attractiveness by Application, 2024 to 2034
Figure 119: Europe Market Attractiveness by Component, 2024 to 2034
Figure 120: Europe Market Attractiveness by Country, 2024 to 2034
Figure 121: East Asia Market Value (US$ Million) by Scanner Type, 2024 to 2034
Figure 122: East Asia Market Value (US$ Million) by Structure Type, 2024 to 2034
Figure 123: East Asia Market Value (US$ Million) by Application, 2024 to 2034
Figure 124: East Asia Market Value (US$ Million) by Component, 2024 to 2034
Figure 125: East Asia Market Value (US$ Million) by Country, 2024 to 2034
Figure 126: East Asia Market Value (US$ Million) Analysis by Country, 2019 to 2034
Figure 127: East Asia Market Volume (Units) Analysis by Country, 2019 to 2034
Figure 128: East Asia Market Value Share (%) and BPS Analysis by Country, 2024 to 2034
Figure 129: East Asia Market Y-o-Y Growth (%) Projections by Country, 2024 to 2034
Figure 130: East Asia Market Value (US$ Million) Analysis by Scanner Type, 2019 to 2034
Figure 131: East Asia Market Volume (Units) Analysis by Scanner Type, 2019 to 2034
Figure 132: East Asia Market Value Share (%) and BPS Analysis by Scanner Type, 2024 to 2034
Figure 133: East Asia Market Y-o-Y Growth (%) Projections by Scanner Type, 2024 to 2034
Figure 134: East Asia Market Value (US$ Million) Analysis by Structure Type, 2019 to 2034
Figure 135: East Asia Market Volume (Units) Analysis by Structure Type, 2019 to 2034
Figure 136: East Asia Market Value Share (%) and BPS Analysis by Structure Type, 2024 to 2034
Figure 137: East Asia Market Y-o-Y Growth (%) Projections by Structure Type, 2024 to 2034
Figure 138: East Asia Market Value (US$ Million) Analysis by Application, 2019 to 2034
Figure 139: East Asia Market Volume (Units) Analysis by Application, 2019 to 2034
Figure 140: East Asia Market Value Share (%) and BPS Analysis by Application, 2024 to 2034
Figure 141: East Asia Market Y-o-Y Growth (%) Projections by Application, 2024 to 2034
Figure 142: East Asia Market Value (US$ Million) Analysis by Component, 2019 to 2034
Figure 143: East Asia Market Volume (Units) Analysis by Component, 2019 to 2034
Figure 144: East Asia Market Value Share (%) and BPS Analysis by Component, 2024 to 2034
Figure 145: East Asia Market Y-o-Y Growth (%) Projections by Component, 2024 to 2034
Figure 146: East Asia Market Attractiveness by Scanner Type, 2024 to 2034
Figure 147: East Asia Market Attractiveness by Structure Type, 2024 to 2034
Figure 148: East Asia Market Attractiveness by Application, 2024 to 2034
Figure 149: East Asia Market Attractiveness by Component, 2024 to 2034
Figure 150: East Asia Market Attractiveness by Country, 2024 to 2034
Figure 151: South Asia Market Value (US$ Million) by Scanner Type, 2024 to 2034
Figure 152: South Asia Market Value (US$ Million) by Structure Type, 2024 to 2034
Figure 153: South Asia Market Value (US$ Million) by Application, 2024 to 2034
Figure 154: South Asia Market Value (US$ Million) by Component, 2024 to 2034
Figure 155: South Asia Market Value (US$ Million) by Country, 2024 to 2034
Figure 156: South Asia Market Value (US$ Million) Analysis by Country, 2019 to 2034
Figure 157: South Asia Market Volume (Units) Analysis by Country, 2019 to 2034
Figure 158: South Asia Market Value Share (%) and BPS Analysis by Country, 2024 to 2034
Figure 159: South Asia Market Y-o-Y Growth (%) Projections by Country, 2024 to 2034
Figure 160: South Asia Market Value (US$ Million) Analysis by Scanner Type, 2019 to 2034
Figure 161: South Asia Market Volume (Units) Analysis by Scanner Type, 2019 to 2034
Figure 162: South Asia Market Value Share (%) and BPS Analysis by Scanner Type, 2024 to 2034
Figure 163: South Asia Market Y-o-Y Growth (%) Projections by Scanner Type, 2024 to 2034
Figure 164: South Asia Market Value (US$ Million) Analysis by Structure Type, 2019 to 2034
Figure 165: South Asia Market Volume (Units) Analysis by Structure Type, 2019 to 2034
Figure 166: South Asia Market Value Share (%) and BPS Analysis by Structure Type, 2024 to 2034
Figure 167: South Asia Market Y-o-Y Growth (%) Projections by Structure Type, 2024 to 2034
Figure 168: South Asia Market Value (US$ Million) Analysis by Application, 2019 to 2034
Figure 169: South Asia Market Volume (Units) Analysis by Application, 2019 to 2034
Figure 170: South Asia Market Value Share (%) and BPS Analysis by Application, 2024 to 2034
Figure 171: South Asia Market Y-o-Y Growth (%) Projections by Application, 2024 to 2034
Figure 172: South Asia Market Value (US$ Million) Analysis by Component, 2019 to 2034
Figure 173: South Asia Market Volume (Units) Analysis by Component, 2019 to 2034
Figure 174: South Asia Market Value Share (%) and BPS Analysis by Component, 2024 to 2034
Figure 175: South Asia Market Y-o-Y Growth (%) Projections by Component, 2024 to 2034
Figure 176: South Asia Market Attractiveness by Scanner Type, 2024 to 2034
Figure 177: South Asia Market Attractiveness by Structure Type, 2024 to 2034
Figure 178: South Asia Market Attractiveness by Application, 2024 to 2034
Figure 179: South Asia Market Attractiveness by Component, 2024 to 2034
Figure 180: South Asia Market Attractiveness by Country, 2024 to 2034
Figure 181: Oceania Market Value (US$ Million) by Scanner Type, 2024 to 2034
Figure 182: Oceania Market Value (US$ Million) by Structure Type, 2024 to 2034
Figure 183: Oceania Market Value (US$ Million) by Application, 2024 to 2034
Figure 184: Oceania Market Value (US$ Million) by Component, 2024 to 2034
Figure 185: Oceania Market Value (US$ Million) by Country, 2024 to 2034
Figure 186: Oceania Market Value (US$ Million) Analysis by Country, 2019 to 2034
Figure 187: Oceania Market Volume (Units) Analysis by Country, 2019 to 2034
Figure 188: Oceania Market Value Share (%) and BPS Analysis by Country, 2024 to 2034
Figure 189: Oceania Market Y-o-Y Growth (%) Projections by Country, 2024 to 2034
Figure 190: Oceania Market Value (US$ Million) Analysis by Scanner Type, 2019 to 2034
Figure 191: Oceania Market Volume (Units) Analysis by Scanner Type, 2019 to 2034
Figure 192: Oceania Market Value Share (%) and BPS Analysis by Scanner Type, 2024 to 2034
Figure 193: Oceania Market Y-o-Y Growth (%) Projections by Scanner Type, 2024 to 2034
Figure 194: Oceania Market Value (US$ Million) Analysis by Structure Type, 2019 to 2034
Figure 195: Oceania Market Volume (Units) Analysis by Structure Type, 2019 to 2034
Figure 196: Oceania Market Value Share (%) and BPS Analysis by Structure Type, 2024 to 2034
Figure 197: Oceania Market Y-o-Y Growth (%) Projections by Structure Type, 2024 to 2034
Figure 198: Oceania Market Value (US$ Million) Analysis by Application, 2019 to 2034
Figure 199: Oceania Market Volume (Units) Analysis by Application, 2019 to 2034
Figure 200: Oceania Market Value Share (%) and BPS Analysis by Application, 2024 to 2034
Figure 201: Oceania Market Y-o-Y Growth (%) Projections by Application, 2024 to 2034
Figure 202: Oceania Market Value (US$ Million) Analysis by Component, 2019 to 2034
Figure 203: Oceania Market Volume (Units) Analysis by Component, 2019 to 2034
Figure 204: Oceania Market Value Share (%) and BPS Analysis by Component, 2024 to 2034
Figure 205: Oceania Market Y-o-Y Growth (%) Projections by Component, 2024 to 2034
Figure 206: Oceania Market Attractiveness by Scanner Type, 2024 to 2034
Figure 207: Oceania Market Attractiveness by Structure Type, 2024 to 2034
Figure 208: Oceania Market Attractiveness by Application, 2024 to 2034
Figure 209: Oceania Market Attractiveness by Component, 2024 to 2034
Figure 210: Oceania Market Attractiveness by Country, 2024 to 2034
Figure 211: MEA Market Value (US$ Million) by Scanner Type, 2024 to 2034
Figure 212: MEA Market Value (US$ Million) by Structure Type, 2024 to 2034
Figure 213: MEA Market Value (US$ Million) by Application, 2024 to 2034
Figure 214: MEA Market Value (US$ Million) by Component, 2024 to 2034
Figure 215: MEA Market Value (US$ Million) by Country, 2024 to 2034
Figure 216: MEA Market Value (US$ Million) Analysis by Country, 2019 to 2034
Figure 217: MEA Market Volume (Units) Analysis by Country, 2019 to 2034
Figure 218: MEA Market Value Share (%) and BPS Analysis by Country, 2024 to 2034
Figure 219: MEA Market Y-o-Y Growth (%) Projections by Country, 2024 to 2034
Figure 220: MEA Market Value (US$ Million) Analysis by Scanner Type, 2019 to 2034
Figure 221: MEA Market Volume (Units) Analysis by Scanner Type, 2019 to 2034
Figure 222: MEA Market Value Share (%) and BPS Analysis by Scanner Type, 2024 to 2034
Figure 223: MEA Market Y-o-Y Growth (%) Projections by Scanner Type, 2024 to 2034
Figure 224: MEA Market Value (US$ Million) Analysis by Structure Type, 2019 to 2034
Figure 225: MEA Market Volume (Units) Analysis by Structure Type, 2019 to 2034
Figure 226: MEA Market Value Share (%) and BPS Analysis by Structure Type, 2024 to 2034
Figure 227: MEA Market Y-o-Y Growth (%) Projections by Structure Type, 2024 to 2034
Figure 228: MEA Market Value (US$ Million) Analysis by Application, 2019 to 2034
Figure 229: MEA Market Volume (Units) Analysis by Application, 2019 to 2034
Figure 230: MEA Market Value Share (%) and BPS Analysis by Application, 2024 to 2034
Figure 231: MEA Market Y-o-Y Growth (%) Projections by Application, 2024 to 2034
Figure 232: MEA Market Value (US$ Million) Analysis by Component, 2019 to 2034
Figure 233: MEA Market Volume (Units) Analysis by Component, 2019 to 2034
Figure 234: MEA Market Value Share (%) and BPS Analysis by Component, 2024 to 2034
Figure 235: MEA Market Y-o-Y Growth (%) Projections by Component, 2024 to 2034
Figure 236: MEA Market Attractiveness by Scanner Type, 2024 to 2034
Figure 237: MEA Market Attractiveness by Structure Type, 2024 to 2034
Figure 238: MEA Market Attractiveness by Application, 2024 to 2034
Figure 239: MEA Market Attractiveness by Component, 2024 to 2034
Figure 240: MEA Market Attractiveness by Country, 2024 to 2034
The market is expected to be valued at USD 2.3 billion in 2024.
Portable vehicle scanner type leads the market.
The market is ruled by the United States, China, Japan, South Korea, and the United Kingdom.
The market is anticipated to surpass USD 4.7 billion by 2034.
The vehicle scanner industry is anticipated to develop at a CAGR of 7.4% from 2024 to 2034.
Explore Similar Insights
Thank you!
You will receive an email from our Business Development Manager. Please be sure to check your SPAM/JUNK folder too.