Vehicle Interior Air Quality Monitoring Technology Market Size and Share Forecast Outlook 2025 to 2035

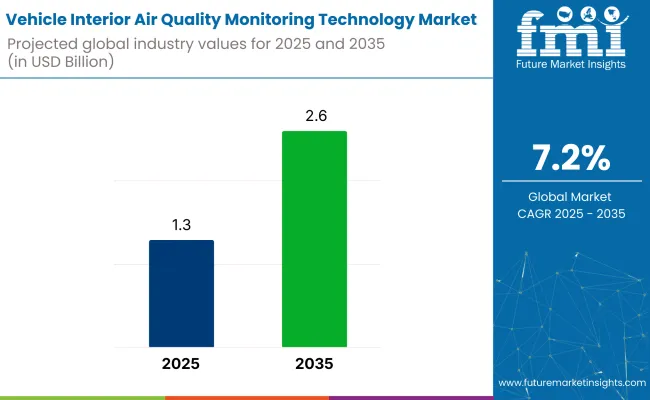
The global vehicle interior air quality monitoring technology market is forecasted to grow from USD 1.3 billion in 2025 to USD 2.6 billion by 2035, registering a CAGR of 7.2% during the forecast period.
Quick Stats for Vehicle Interior Air Quality Monitoring Technology Market

  • Market Value (2025): USD 1.3 billion
  • Forecast Value (2035): USD 2.6 billion
  • Global CAGR: 7.2%
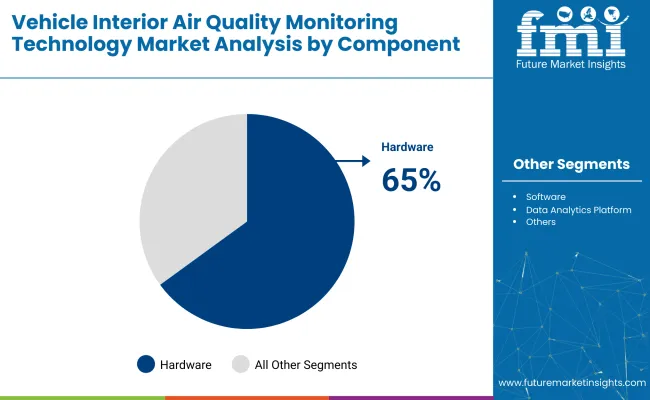
  • Leading Segment in 2025: Hardware (~65% share)
  • Key Growth Region: Asia Pacific (China, India, Japan), Europe (United Kingdom, Germany)
  • Key Players: DENSO, Robert Bosch, Honeywell International Inc, MAHLE, Emerson, Sensirion, LG, SGS, Eberspächer Group, Mechanical Simulation

Vehicle Interior Air Quality Monitoring Technology Market

The growing concerns regarding indoor air quality and health implications are encouraging the adoption of air filtration and monitoring systems in cars. Consumer awareness about air quality and health-related issues is further accelerating industry adoption. Increased demand for electric vehicles (EVs) and autonomous vehicles (AVs) is also contributing to the industry expansion.

Advanced sensor technologies and smart vehicles are being utilized to create sophisticated real-time air quality monitoring systems for vehicle interiors. These systems are designed to detect pollutants, allergens, and volatile organic compounds (VOCs) in the cabin air. “Advances in sensor technology and smart vehicles mean that how and when we use our cars is changing. Just as air pollution and indoor air quality have become a requirement for healthy homes, car cabin air quality is now also under scrutiny,” said Dr. John McKeon, CEO of Allergy Standards Limited (ASL).

The vehicle interior air quality monitoring technology industry forms a small but growing share across its broader parent segments. Within the automotive cabin air quality sensors industry, it holds a substantial 30-35% share, as core monitoring modules integrate with filtration and ventilation systems. In the wider automotive environmental sensors industry, its contribution is approximately 10-12%, competing with sensors for temperature, humidity, and ambient light.

Within the vehicle HVAC and air filtration systems segment, air quality monitoring accounts for 8-10%, supporting adaptive filtration and climate control. Its share in the smart vehicle electronics category stands at 5-7%, driven by rising demand for health-focused connected features. Across the expansive automotive electronics industry, its presence remains typically under 1% but is gaining strategic importance.

Vehicle Interior Air Quality Monitoring Technology Market Analyzed by Top Investment Segments

The vehicle interior air quality monitoring technology market is experiencing strong growth, driven by investments in hardware, infrared-based detection, and cabin air quality monitoring, fueled by concerns over air quality and regulations.
Hardware Is Expected to Lead the Market

Vehicle Interior Air Quality Monitoring Technology Market Analysis By Component

The hardware component is expected to dominate the market, accounting for 65% of the share by 2025. This dominance is driven by the increasing demand for sensors, controllers, and other components that are essential for real-time monitoring and management of cabin air quality.

Companies such as Honeywell and Bosch are leading the charge in providing high-quality sensors that measure particulate matter, carbon dioxide, and volatile organic compounds. These hardware components are integrated into vehicle air conditioning systems, offering real-time analysis of indoor air conditions, improving cabin comfort, and promoting passenger health.
  • Particulate and gas sensors are being integrated into OEM-standard air filtration systems.
  • Multi-functional boards are being customized for compact installations in mid-segment vehicles.
  • Automotive-grade chipsets are being certified for air quality processing applications.

Infrared-Based Detection will Dominate the Technology Segment.

Vehicle Interior Air Quality Monitoring Technology Market Analysis By Technology

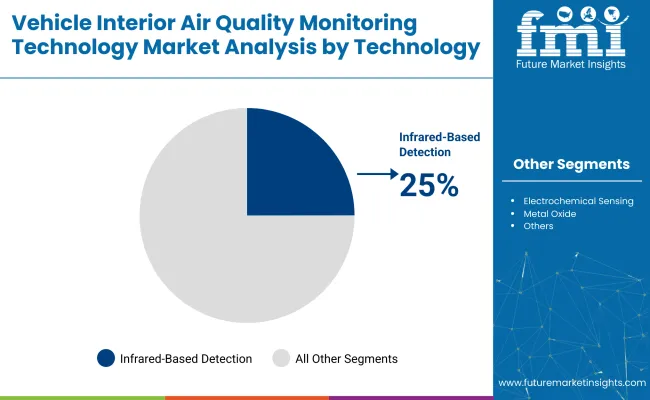
Infrared-based detection technology is projected to capture 25% share by 2025. This technology offers a non-invasive, efficient method for detecting and monitoring harmful gases such as carbon dioxide and nitrogen dioxide within the vehicle cabin.

Companies like Osram and Raytheon are enhancing infrared-based detection systems with greater sensitivity and accuracy, enabling better detection of particulate matter and other contaminants in the air. As vehicle manufacturers and consumers increasingly prioritize health-conscious solutions, infrared-based detection is becoming an essential component in vehicle interior air quality systems, contributing to safer driving environments.

  • Infrared-based dual-wavelength sensors are being adopted for CO₂ calibration accuracy.
  • Miniaturized NDIR sensors are being installed in luxury and electric vehicle lines.
  • Smart HVAC systems are being optimized using IR data feedback for pollutant removal.

Passenger Cars Are Expected to Lead the Vehicle Type Segment

Passenger cars are expected to dominate the vehicle type segment, holding a 55% share in 2025. The growing focus on cabin air quality for personal vehicles is being driven by rising awareness of health risks associated with air pollution and increasing regulatory requirements for air quality control systems.

Leading automotive manufacturers, including Toyota and Ford, are incorporating advanced air quality monitoring systems into their vehicles to meet consumer demand for cleaner, healthier driving environments. This trend is further bolstered by the integration of smart technologies and eco-friendly materials that enhance cabin air circulation and filtration, driving adoption in passenger vehicles.

  • HEPA-filter-supported sensors are being embedded in next-gen electric vehicles.
  • Personalized zone-based monitoring is being tested in premium car segments.
  • App-linked cabin diagnostics are being offered by connected vehicle manufacturers.

Cabin Air Quality Monitoring to Lead the Application Segment

Cabin air quality monitoring is projected to capture a 35% share in 2025. This application focuses on detecting and managing pollutants such as carbon monoxide, particulate matter, and allergens inside the vehicle cabin. Companies like Denso and Valeo are pioneering technologies that enable real-time air quality monitoring systems, allowing for automatic adjustments to the vehicle's ventilation system.

This functionality is crucial for maintaining a comfortable and safe environment for passengers, especially in urban areas where air quality is often compromised. As consumer demand for cleaner air in vehicles continues to rise, cabin air quality monitoring is becoming a standard feature in modern vehicles.

  • Automated fan-speed adjustments are being activated through in-cabin AQI thresholds.
  • Mobile-connected dashboards are being developed for in-transit air quality reporting.
  • Cabin monitors with real-time visual AQ indicators are being incorporated in EVs.

Top Vehicle Interior Air Quality Monitoring Technology Market Dynamics

The vehicle interior air quality monitoring market is growing due to increased consumer awareness, stricter regulations, and technological advancements. However, high implementation costs and integration complexities could limit widespread adoption.

Heightened Regulation and Awareness Propel Adoption

Demand for in-cabin air quality solutions is being supported by consumer health priorities and compliance with air pollution legislation. Vehicle manufacturers have been required to install particulate and gas sensors that track cabin pollutants. In markets such as Europe and North America, air quality benchmarks have been mandated, pushing OEMs toward system-wide deployment.

  • EU in-cabin air quality standards are being applied to passenger car models since 2024.
  • Vehicle wellness ratings are being influenced by real-time AQI performance.
  • Integrated AQ monitoring is being prioritized for family and medical-use vehicles.

Cost and Technical Complexity Constrain Broader Rollout

Adoption has been slowed by elevated system costs and compatibility issues with traditional vehicle platforms. High-precision sensors, embedded analytics, and calibration processes have increased unit pricing. Retrofitting legacy models with smart air systems has proven operationally intensive, especially for low-margin manufacturers.
  • Sensor recalibration requirements are being flagged as a cost driver in OEM testing.
  • Technical integration with HVAC and BMS is being seen as resource-heavy.
  • Mid-tier automakers are deferring rollout in favor of lower-cost filter-based alternatives.

Analyzing Top Countries Manufacturing, Deploying, and Advancing Vehicle Interior Air Quality Monitoring Technology

Country Wise Analysis Of Vehicle Interior Air Quality Monitoring Technology Market

Countries CAGR (2025 to 2035)
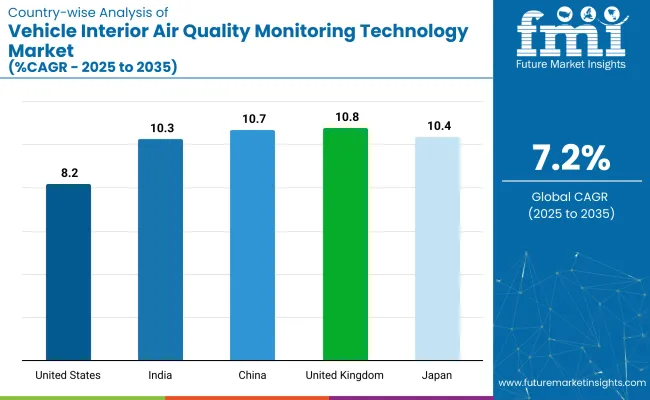
United States 8.2%
United Kingdom 10.8%
China 10.7%
India 10.3%
Japan 10.4%

During 2025 to 2035, an average CAGR of 9.8% is projected to be recorded by OECD participants in the vehicle interior air-quality monitoring technology industry. A rise of 10.8% is expected to be registered by the United Kingdom, enabled by tightened in-cabin VOC directives and wellness-centric trim features. An increase of 10.4% is forecast to be observed in Japan, supported by sensor integration within hybrid and battery-electric platforms, whereas 8.3% growth is anticipated to be experienced by the United States, aided by premium SUV refresh cycles.

BRICS economies are projected to post a mean of 10.5%; China’s 10.8% trajectory is being propelled by electric-vehicle production quotas that require active filtration, and India’s 10.3% outlook is being driven by passenger-car emission norms and heightened cabin-hygiene awareness. A global expansion rate of 7.2% is set to be observed, reflecting regulatory impetus and occupant-well-being priorities.

The report covers detailed analysis of 40+ countries and the top five countries have been shared as a reference.

Analysis of Vehicle Interior Air Quality Monitoring Technology Market in the United States

The United States vehicle interior air quality monitoring technology market is expected to grow at a CAGR of 8.2% through 2035. Growth is being supported by increasing consumer demand for better air quality and health-conscious living. Leading automotive companies such as Ford, General Motors, and Tesla are integrating advanced air quality sensors and filtration systems into vehicles.

Government regulations and industry standards promoting cleaner environments are encouraging innovation. Rising awareness about the effects of air pollution on health and the growing focus on electric vehicles further drive industry demand. Continuous advancements in air quality sensors and real-time monitoring systems support industry expansion.

  • AI-enhanced AQI dashboards are being added in premium SUV segments.
  • Standardization of in-cabin sensor placement is being evaluated by NHTSA.
  • Retail financing options for in-car health tech add-ons are being explored.

Demand Forecast for Vehicle Interior Air Quality Monitoring Technology Market in the United Kingdom

The United Kingdom vehicle interior air quality monitoring technology market is projected to grow at a CAGR of 10.8% through 2035. Growth is being supported by rising consumer awareness about air quality and its impact on health. Major automotive manufacturers such as Jaguar Land Rover, BMW, and Volvo are focusing on the integration of advanced air purification and monitoring technologies in vehicles.

Increasing government focus on emission reduction and efforts drive product development. Innovations in smart air quality sensors and filtration systems enhance performance. Moreover, regulatory frameworks ensuring healthier driving environments contribute to the industry’s growth in the UK.

  • NHS-linked guidelines on indoor transport air quality are being referenced.
  • Allergy-based air filtration ratings are being adopted by leading dealerships.
  • Tax incentives for “health-ready” vehicles are being evaluated post to 2025.

Growth Analysis of Vehicle Interior Air Quality Monitoring Technology Market in China

The vehicle interior air quality monitoring technology market in China is expected to grow at a CAGR of 10.7% through 2035. Expansion is being driven by rapid industrialization, increasing automotive sales, and rising health concerns related to air pollution. Leading automotive brands like BYD, Geely, and SAIC Motor are investing in product innovation and expanding their portfolios.

Government regulations on pet food safety and nutritional standards enhance consumer confidence. Distribution channels including veterinary clinics and e-commerce platforms are being strengthened. Awareness of pet health conditions like obesity, renal disorders, and allergies is increasing demand. Product development focusing on ingredient quality supports industry growth.

  • Smart cockpit ecosystems integrating AQ monitors are being scaled across EV fleets.
  • OEM-led AQ data sharing with municipal health networks is being tested.
  • Domestic sensor start-ups are being funded via provincial innovation grants.

Future Outlook for Vehicle Interior Air Quality Monitoring Technology Market in India

The vehicle interior air quality monitoring technology market in China is anticipated to grow at a CAGR of 10.3% through 2035. Growth is driven by increasing consumer awareness, growing urbanization, and a rising middle class. Automotive companies such as Tata Motors, Mahindra & Mahindra, and Hyundai India are incorporating air quality monitoring systems in vehicles to cater to health-conscious consumers.

Increased demand for electric vehicles and stringent environmental regulations are driving the adoption of advanced air quality monitoring technologies. Innovations in air purification systems and sensors ensure the quality of cabin air, while government support for automotive technologies accelerates industry growth.

  • Smart cabin health kits are being bundled with EV sales in metro cities.
  • Real-time air quality alerts via mobile apps are being synced with vehicle sensors.
  • Public awareness campaigns on cabin air safety are being backed by MoEFCC.

Vehicle Interior Air Quality Monitoring Technology Market Growth Outlook in Japan

The vehicle interior air quality monitoring technology market in Japan is projected to grow at a CAGR of 10.4% through 2035. Growth is supported by the country’s emphasis on advanced radar technologies and strategic defense initiatives. Key players such as Mitsubishi Electric, NEC Corporation, and the Japan Aerospace Exploration Agency (JAXA) are actively developing sophisticated space radar systems.

Investments in satellite-based radar for environmental monitoring, defense surveillance, and disaster management are prioritized. Technological innovation, strong government support, and international collaborations further propel industry growth.
  • Sensor accuracy verification under ISO 16000 is being institutionalized.
  • Scent-neutralization tech using ionization is being embedded in kei cars.
  • Cabin AQI analytics are being included in vehicle-to-home IoT platforms.

Leading Companies in Vehicle Interior Air Quality Monitoring Technology Market

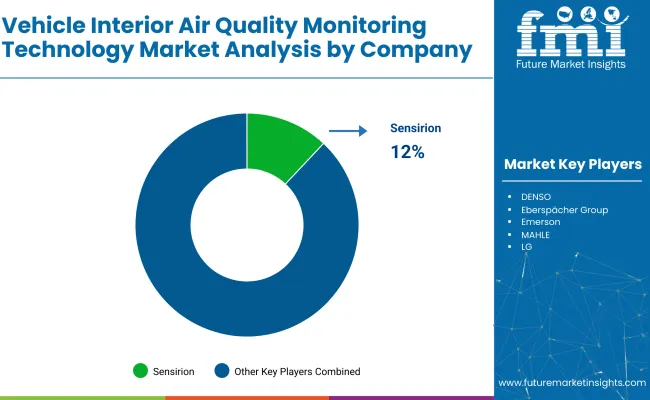
Vehicle Interior Air Quality Monitoring Technology Market Analysis By Company

The market is led by established suppliers such as DENSO, Honeywell International, and Bosch, known for their advanced air quality sensors and integration within HVAC systems. These companies maintain a strong presence across automotive OEM platforms, focusing on in-cabin wellness and regulatory compliance. Mid-tier contributors like Emerson and MAHLE support the industry with modular monitoring solutions that align with evolving emissions standards.

Niche-focused firms such as SGS address specific use cases, including air-quality compliance testing and certification. Rising consumer health concerns, stricter in-cabin VOC limits, and growing urban air pollution are compelling OEMs to adopt advanced sensor systems. This shift is accelerating the integration of real-time air monitoring in both passenger and commercial vehicles.

Recent Vehicle Interior Air Quality Monitoring Technology Industry News

  • In May 2025, Groove Technologies launched the Qik-FIT™ Universal Cabin Air Filter System, designed for easy installation and high efficiency, fitting 80% of cabin air filter sales. This patent-protected system addresses the aftermarket need for air quality improvement.
  • In August 2024, Renesas Electronics introduced the RRH62000 all-in-one sensor module, capable of monitoring harmful airborne contaminants like particulates and VOCs, providing real-time cabin air quality measurement.

Key Players in Vehicle Interior Air Quality Monitoring Technology Market

  • DENSO
  • Eberspächer Group
  • Emerson
  • Honeywell International Inc
  • LG
  • MAHLE
  • Mechanical Simulation
  • Robert Bosch
  • Sensirion
  • SGS

Research Coverage and Scope Summary

Report Attributes Details
Current Total Industry Size (2025) USD 1.3 billion
Projected Industry Size (2035) USD 2.6 billion
CAGR (2025 to 2035) 7.2%
Base Year for Estimation 2024
Historical Period 2020 to 2024
Projections Period 2025 to 2035
Quantitative Units USD billion for value and million units,
Components Analyzed (Segment 1) Software: Data analytics platforms; Real-time monitoring dashboards; Others Hardware: Gas sensors; Humidity & temperature sensors; Odor sensors; Others Service: Installation & integration; Calibration & maintenance
Technologies Analyzed (Segment 2) Infrared-based detection; Electrochemical sensing; Photoionization detection; Metal oxide semiconductors; Others
Vehicle Types Covered (Segment 3) Passenger cars: Sedan; Hatchback; SUV Commercial vehicles: Light commercial vehicle; Heavy commercial vehicle; Buses & coaches
Applications Covered (Segment 4) Cabin air quality monitoring; HVAC system integration; Real-time driver & passenger health alerts; Fleet health management; Others
Regions Covered North America, Europe, Asia-Pacific, Latin America, Middle East, and Africa
Countries Covered United States; Canada; United Kingdom; Germany; France; Italy; Spain; Belgium; Sweden; China; India; Japan; Australia; Singapore; South Korea; Southeast Asia; Brazil; Mexico; Argentina; South Africa; Saudi Arabia; UAE
Key Players DENSO; Eberspächer Group; Emerson; Honeywell International Inc; LG; MAHLE; Mechanical Simulation; Robert Bosch; Sensirion; SGS
Additional Attributes Dollar sales by component (hardware vs software vs services); Growth of cabin air quality monitoring systems in electric vehicles; Integration with autonomous driving technologies; OEM vs aftermarket adoption trends; Regulatory push for improved in-cabin air quality systems

Vehicle Interior Air Quality Monitoring Technology Market Analyzed by Key Investment Segments

By Component:

The industry is segmented by component into software (data analytics platforms, real-time monitoring dashboards, and others), hardware (gas sensors, humidity & temperature sensors, odor sensors, and others), and service (installation & integration, calibration & maintenance).

By Technology:

The industry includes infrared-based detection, electrochemical sensing, photoionization detection, metal oxide semiconductors, and others.

By Vehicle:

The industry is segmented by vehicle type into passenger cars (sedan, hatchback, SUV), commercial vehicles (light commercial vehicle, heavy commercial vehicle, buses & coaches).

By Application:

The industry includes cabin air quality monitoring, HVAC system integration, real-time driver & passenger health alerts, fleet health management, and others.

By Region:

The industry covers North America, Europe, Asia Pacific, Latin America, and Middle East & Africa.

Table of Content

  1. Executive Summary
    • Global Market Outlook
    • Demand-side Trends
    • Supply-side Trends
    • Technology Roadmap Analysis
    • Analysis and Recommendations
  2. Market Overview
    • Market Coverage / Taxonomy
    • Market Definition / Scope / Limitations
  3. Market Background
    • Market Dynamics
      • Drivers
      • Restraints
      • Opportunity
      • Trends
    • Scenario Forecast
      • Demand in Optimistic Scenario
      • Demand in Likely Scenario
      • Demand in Conservative Scenario
    • Opportunity Map Analysis
    • Product Life Cycle Analysis
    • Supply Chain Analysis
      • Supply Side Participants and their Roles
        • Producers
        • Mid-Level Participants (Traders/ Agents/ Brokers)
        • Wholesalers and Distributors
      • Value Added and Value Created at Node in the Supply Chain
      • List of Raw Material Suppliers
      • List of Existing and Potential Buyer’s
    • Investment Feasibility Matrix
    • Value Chain Analysis
      • Profit Margin Analysis
      • Wholesalers and Distributors
      • Retailers
    • PESTLE and Porter’s Analysis
    • Regulatory Landscape
      • By Key Regions
      • By Key Countries
    • Regional Parent Market Outlook
    • Production and Consumption Statistics
    • Import and Export Statistics
  4. Global Market Analysis 2020 to 2024 and Forecast, 2025 to 2035
    • Historical Market Size Value (USD Billion) & Volume (Million Units) Analysis, 2020 to 2024
    • Current and Future Market Size Value (USD Billion) & Volume (Million Units) Projections, 2025 to 2035
      • Y-o-Y Growth Trend Analysis
      • Absolute $ Opportunity Analysis
  5. Global Market Pricing Analysis 2020 to 2024 and Forecast 2025 to 2035
  6. Global Market Analysis 2020 to 2024 and Forecast 2025 to 2035, By Component
    • Introduction / Key Findings
    • Historical Market Size Value (USD Billion) & Volume (Million Units) Analysis By Component, 2020 to 2024
    • Current and Future Market Size Value (USD Billion) & Volume (Million Units) Analysis and Forecast By Component, 2025 to 2035
      • Software
        • Data Analytics Platforms
        • Real-time Monitoring Dashboards
        • Others
      • Hardware
        • Gas Sensors
        • Humidity & Temperature Sensors
        • Odor Sensors
        • Others
      • Service
        • Installation & Integration
        • Calibration & Maintenance
    • Y-o-Y Growth Trend Analysis By Component, 2020 to 2024
    • Absolute $ Opportunity Analysis By Component, 2025 to 2035
  7. Global Market Analysis 2020 to 2024 and Forecast 2025 to 2035, By Technology
    • Introduction / Key Findings
    • Historical Market Size Value (USD Billion) & Volume (Million Units) Analysis By Technology, 2020 to 2024
    • Current and Future Market Size Value (USD Billion) & Volume (Million Units) Analysis and Forecast By Technology, 2025 to 2035
      • Infrared-based Detection
      • Electrochemical Sensing
      • Photoionization Detection
      • Metal Oxide Semiconductors
      • Others
    • Y-o-Y Growth Trend Analysis By Technology, 2020 to 2024
    • Absolute $ Opportunity Analysis By Technology, 2025 to 2035
  8. Global Market Analysis 2020 to 2024 and Forecast 2025 to 2035, By Vehicle Type
    • Introduction / Key Findings
    • Historical Market Size Value (USD Billion) & Volume (Million Units) Analysis By Vehicle Type, 2020 to 2024
    • Current and Future Market Size Value (USD Billion) & Volume (Million Units) Analysis and Forecast By Vehicle Type, 2025 to 2035
      • Passenger Cars
        • Sedan
        • Hatchback
        • SUV
      • Commercial Vehicles
        • Light Commercial Vehicles
        • Heavy Commercial vehicles
        • Buses & Coaches
    • Y-o-Y Growth Trend Analysis By Vehicle Type, 2020 to 2024
    • Absolute $ Opportunity Analysis By Vehicle Type, 2025 to 2035
  9. Global Market Analysis 2020 to 2024 and Forecast 2025 to 2035, By Application
    • Introduction / Key Findings
    • Historical Market Size Value (USD Billion) & Volume (Million Units) Analysis By Application, 2020 to 2024
    • Current and Future Market Size Value (USD Billion) & Volume (Million Units) Analysis and Forecast By Application, 2025 to 2035
      • Cabin Air Quality Monitoring
      • HVAC System Integration
      • Real-time Driver & Passenger Health Alerts
      • Fleet Health Management
      • Others
    • Y-o-Y Growth Trend Analysis By Application, 2020 to 2024
    • Absolute $ Opportunity Analysis By Application, 2025 to 2035
  10. Global Market Analysis 2020 to 2024 and Forecast 2025 to 2035, By Region
    • Introduction
    • Historical Market Size Value (USD Billion) & Volume (Million Units) Analysis By Region, 2020 to 2024
    • Current Market Size Value (USD Billion) & Volume (Million Units) Analysis and Forecast By Region, 2025 to 2035
      • North America
      • Latin America
      • Western Europe
      • Eastern Europe
      • East Asia
      • South Asia & Pacific
      • Middle East and Africa
    • Market Attractiveness Analysis By Region
  11. North America Market Analysis 2020 to 2024 and Forecast 2025 to 2035, By Country
    • Historical Market Size Value (USD Billion) & Volume (Million Units) Trend Analysis By Market Taxonomy, 2020 to 2024
    • Market Size Value (USD Billion) & Volume (Million Units) Forecast By Market Taxonomy, 2025 to 2035
      • By Country
        • USA
        • Canada
        • Mexico
      • By Component
      • By Technology
      • By Vehicle Type
      • By Application
    • Market Attractiveness Analysis
      • By Country
      • By Component
      • By Technology
      • By Vehicle Type
      • By Application
    • Key Takeaways
  12. Latin America Market Analysis 2020 to 2024 and Forecast 2025 to 2035, By Country
    • Historical Market Size Value (USD Billion) & Volume (Million Units) Trend Analysis By Market Taxonomy, 2020 to 2024
    • Market Size Value (USD Billion) & Volume (Million Units) Forecast by Market Taxonomy, 2025 to 2035
      • By Country
        • Brazil
        • Argentina
        • Rest of LATAM
      • By Component
      • By Technology
      • By Vehicle Type
      • By Application
    • Market Attractiveness Analysis
      • By Country
      • By Component
      • By Technology
      • By Vehicle Type
      • By Application
    • Key Takeaways
  13. Western Europe Market Analysis 2020 to 2024 and Forecast 2025 to 2035, By Country
    • Historical Market Size Value (USD Billion) & Volume (Million Units) Trend Analysis By Market Taxonomy, 2020 to 2024
    • Market Size Value (USD Billion) & Volume (Million Units) Forecast By Market Taxonomy, 2025 to 2035
      • By Country
        • Germany
        • Italy
        • France
        • UK
        • Spain
        • BENELUX
        • Nordic
        • Rest of W.Europe
      • By Component
      • By Technology
      • By Vehicle Type
      • By Application
    • Market Attractiveness Analysis
      • By Country
      • By Component
      • By Technology
      • By Vehicle Type
      • By Application
    • Key Takeaways
  14. Eastern Europe Market Analysis 2020 to 2024 and Forecast 2025 to 2035, By Country
    • Historical Market Size Value (USD Billion) & Volume (Million Units) Trend Analysis By Market Taxonomy, 2020 to 2024
    • Market Size Value (USD Billion) & Volume (Million Units) Forecast by Market Taxonomy, 2025 to 2035
      • By Country
        • Russia
        • Hungary
        • Poland
        • Balkan & Baltics
        • Rest of E. Europe
      • By Component
      • By Technology
      • By Vehicle Type
      • By Application
    • Market Attractiveness Analysis
      • By Country
      • By Component
      • By Technology
      • By Vehicle Type
      • By Application
    • Key Takeaways
  15. East Asia Market Analysis 2020 to 2024 and Forecast 2025 to 2035, By Country
    • Historical Market Size Value (USD Billion) & Volume (Million Units) Trend Analysis by Market Taxonomy, 2020 to 2024
    • Market Size Value (USD Billion) & Volume (Million Units) Forecast By Market Taxonomy, 2025 to 2035
      • By Country
        • China
        • Japan
        • South Korea
      • By Component
      • By Technology
      • By Vehicle Type
      • By Application
    • Market Attractiveness Analysis
      • By Country
      • By Component
      • By Technology
      • By Vehicle Type
      • By Application
    • Key Takeaways
  16. South Asia & Pacific Market Analysis 2020 to 2024 and Forecast 2025 to 2035, By Country
    • Historical Market Size Value (USD Billion) & Volume (Million Units) Trend Analysis By Market Taxonomy, 2020 to 2024
    • Market Size Value (USD Billion) & Volume (Million Units) Forecast By Market Taxonomy, 2025 to 2035
      • By Country
        • India
        • Australia & New Zealand
        • ASEAN
        • Rest of SAP
      • By Component
      • By Technology
      • By Vehicle Type
      • By Application
    • Market Attractiveness Analysis
      • By Country
      • By Component
      • By Technology
      • By Vehicle Type
      • By Application
    • Key Takeaways
  17. Middle East and Africa Market Analysis 2020 to 2024 and Forecast 2025 to 2035, By Country
    • Historical Market Size Value (USD Billion) & Volume (Million Units) Trend Analysis By Market Taxonomy, 2020 to 2024
    • Market Size Value (USD Billion) & Volume (Million Units) Forecast By Market Taxonomy, 2025 to 2035
      • By Country
        • GCC Countries
        • Northern Africa
        • South Africa
        • Turkiye
        • Rest of MEA
      • By Component
      • By Technology
      • By Vehicle Type
      • By Application
    • Market Attractiveness Analysis
      • By Country
      • By Component
      • By Technology
      • By Vehicle Type
      • By Application
    • Key Takeaways
  18. Key Countries Market Analysis
    • USA
      • Pricing Analysis
      • Market Share Analysis, 2024
        • By Component
        • By Technology
        • By Vehicle Type
        • By Application
    • Canada
      • Pricing Analysis
      • Market Share Analysis, 2024
        • By Component
        • By Technology
        • By Vehicle Type
        • By Application
    • Brazil
      • Pricing Analysis
      • Market Share Analysis, 2024
        • By Component
        • By Technology
        • By Vehicle Type
        • By Application
    • Mexico
      • Pricing Analysis
      • Market Share Analysis, 2024
        • By Component
        • By Technology
        • By Vehicle Type
        • By Application
    • Argentina
      • Pricing Analysis
      • Market Share Analysis, 2024
        • By Component
        • By Technology
        • By Vehicle Type
        • By Application
  19. Market Structure Analysis
    • Competition Dashboard
    • Competition Benchmarking
    • Market Share Analysis of Top Players
      • By Regional
      • By Component
      • By Technology
      • By Vehicle Type
      • By Application
  20. Competition Analysis
    • Competition Deep Dive
      • DENSO
        • Overview
        • Product Portfolio
        • Profitability by Market Segments (Product/Age /Sales Channel/Region)
        • Sales Footprint
        • Strategy Overview
          • Marketing Strategy
          • Product Strategy
          • Channel Strategy
      • Eberspächer Group
        • Overview
        • Product Portfolio
        • Profitability by Market Segments (Product/Age /Sales Channel/Region)
        • Sales Footprint
        • Strategy Overview
          • Marketing Strategy
          • Product Strategy
          • Channel Strategy
      • Emerson
        • Overview
        • Product Portfolio
        • Profitability by Market Segments (Product/Age /Sales Channel/Region)
        • Sales Footprint
        • Strategy Overview
          • Marketing Strategy
          • Product Strategy
          • Channel Strategy
      • Honeywell International Inc
        • Overview
        • Product Portfolio
        • Profitability by Market Segments (Product/Age /Sales Channel/Region)
        • Sales Footprint
        • Strategy Overview
          • Marketing Strategy
          • Product Strategy
          • Channel Strategy
      • LG
        • Overview
        • Product Portfolio
        • Profitability by Market Segments (Product/Age /Sales Channel/Region)
        • Sales Footprint
        • Strategy Overview
          • Marketing Strategy
          • Product Strategy
          • Channel Strategy
      • MAHLE
        • Overview
        • Product Portfolio
        • Profitability by Market Segments (Product/Age /Sales Channel/Region)
        • Sales Footprint
        • Strategy Overview
          • Marketing Strategy
          • Product Strategy
          • Channel Strategy
      • Mechanical Simulation
        • Overview
        • Product Portfolio
        • Profitability by Market Segments (Product/Age /Sales Channel/Region)
        • Sales Footprint
        • Strategy Overview
          • Marketing Strategy
          • Product Strategy
          • Channel Strategy
      • Robert Bosch
        • Overview
        • Product Portfolio
        • Profitability by Market Segments (Product/Age /Sales Channel/Region)
        • Sales Footprint
        • Strategy Overview
          • Marketing Strategy
          • Product Strategy
          • Channel Strategy
  21. Assumptions & Acronyms Used
  22. Research Methodology

List of Tables

  • Table 1: Global Market Value (USD Billion) Forecast by Region, 2020 to 2035
  • Table 2: Global Market Volume (Million Units) Forecast by Region, 2020 to 2035
  • Table 3: Global Market Value (USD Billion) Forecast by Component, 2020 to 2035
  • Table 4: Global Market Volume (Million Units) Forecast by Component, 2020 to 2035
  • Table 5: Global Market Value (USD Billion) Forecast by Technology, 2020 to 2035
  • Table 6: Global Market Volume (Million Units) Forecast by Technology, 2020 to 2035
  • Table 7: Global Market Value (USD Billion) Forecast by Vehicle Type, 2020 to 2035
  • Table 8: Global Market Volume (Million Units) Forecast by Vehicle Type, 2020 to 2035
  • Table 9: Global Market Value (USD Billion) Forecast by Application, 2020 to 2035
  • Table 10: Global Market Volume (Million Units) Forecast by Application, 2020 to 2035
  • Table 11: North America Market Value (USD Billion) Forecast by Country, 2020 to 2035
  • Table 12: North America Market Volume (Million Units) Forecast by Country, 2020 to 2035
  • Table 13: North America Market Value (USD Billion) Forecast by Component, 2020 to 2035
  • Table 14: North America Market Volume (Million Units) Forecast by Component, 2020 to 2035
  • Table 15: North America Market Value (USD Billion) Forecast by Technology, 2020 to 2035
  • Table 16: North America Market Volume (Million Units) Forecast by Technology, 2020 to 2035
  • Table 17: North America Market Value (USD Billion) Forecast by Vehicle Type, 2020 to 2035
  • Table 18: North America Market Volume (Million Units) Forecast by Vehicle Type, 2020 to 2035
  • Table 19: North America Market Value (USD Billion) Forecast by Application, 2020 to 2035
  • Table 20: North America Market Volume (Million Units) Forecast by Application, 2020 to 2035
  • Table 21: Latin America Market Value (USD Billion) Forecast by Country, 2020 to 2035
  • Table 22: Latin America Market Volume (Million Units) Forecast by Country, 2020 to 2035
  • Table 23: Latin America Market Value (USD Billion) Forecast by Component, 2020 to 2035
  • Table 24: Latin America Market Volume (Million Units) Forecast by Component, 2020 to 2035
  • Table 25: Latin America Market Value (USD Billion) Forecast by Technology, 2020 to 2035
  • Table 26: Latin America Market Volume (Million Units) Forecast by Technology, 2020 to 2035
  • Table 27: Latin America Market Value (USD Billion) Forecast by Vehicle Type, 2020 to 2035
  • Table 28: Latin America Market Volume (Million Units) Forecast by Vehicle Type, 2020 to 2035
  • Table 29: Latin America Market Value (USD Billion) Forecast by Application, 2020 to 2035
  • Table 30: Latin America Market Volume (Million Units) Forecast by Application, 2020 to 2035
  • Table 31: Western Europe Market Value (USD Billion) Forecast by Country, 2020 to 2035
  • Table 32: Western Europe Market Volume (Million Units) Forecast by Country, 2020 to 2035
  • Table 33: Western Europe Market Value (USD Billion) Forecast by Component, 2020 to 2035
  • Table 34: Western Europe Market Volume (Million Units) Forecast by Component, 2020 to 2035
  • Table 35: Western Europe Market Value (USD Billion) Forecast by Technology, 2020 to 2035
  • Table 36: Western Europe Market Volume (Million Units) Forecast by Technology, 2020 to 2035
  • Table 37: Western Europe Market Value (USD Billion) Forecast by Vehicle Type, 2020 to 2035
  • Table 38: Western Europe Market Volume (Million Units) Forecast by Vehicle Type, 2020 to 2035
  • Table 39: Western Europe Market Value (USD Billion) Forecast by Application, 2020 to 2035
  • Table 40: Western Europe Market Volume (Million Units) Forecast by Application, 2020 to 2035
  • Table 41: Eastern Europe Market Value (USD Billion) Forecast by Country, 2020 to 2035
  • Table 42: Eastern Europe Market Volume (Million Units) Forecast by Country, 2020 to 2035
  • Table 43: Eastern Europe Market Value (USD Billion) Forecast by Component, 2020 to 2035
  • Table 44: Eastern Europe Market Volume (Million Units) Forecast by Component, 2020 to 2035
  • Table 45: Eastern Europe Market Value (USD Billion) Forecast by Technology, 2020 to 2035
  • Table 46: Eastern Europe Market Volume (Million Units) Forecast by Technology, 2020 to 2035
  • Table 47: Eastern Europe Market Value (USD Billion) Forecast by Vehicle Type, 2020 to 2035
  • Table 48: Eastern Europe Market Volume (Million Units) Forecast by Vehicle Type, 2020 to 2035
  • Table 49: Eastern Europe Market Value (USD Billion) Forecast by Application, 2020 to 2035
  • Table 50: Eastern Europe Market Volume (Million Units) Forecast by Application, 2020 to 2035
  • Table 51: East Asia Market Value (USD Billion) Forecast by Country, 2020 to 2035
  • Table 52: East Asia Market Volume (Million Units) Forecast by Country, 2020 to 2035
  • Table 53: East Asia Market Value (USD Billion) Forecast by Component, 2020 to 2035
  • Table 54: East Asia Market Volume (Million Units) Forecast by Component, 2020 to 2035
  • Table 55: East Asia Market Value (USD Billion) Forecast by Technology, 2020 to 2035
  • Table 56: East Asia Market Volume (Million Units) Forecast by Technology, 2020 to 2035
  • Table 57: East Asia Market Value (USD Billion) Forecast by Vehicle Type, 2020 to 2035
  • Table 58: East Asia Market Volume (Million Units) Forecast by Vehicle Type, 2020 to 2035
  • Table 59: East Asia Market Value (USD Billion) Forecast by Application, 2020 to 2035
  • Table 60: East Asia Market Volume (Million Units) Forecast by Application, 2020 to 2035
  • Table 61: South Asia & Pacific Market Value (USD Billion) Forecast by Country, 2020 to 2035
  • Table 62: South Asia & Pacific Market Volume (Million Units) Forecast by Country, 2020 to 2035
  • Table 63: South Asia & Pacific Market Value (USD Billion) Forecast by Component, 2020 to 2035
  • Table 64: South Asia & Pacific Market Volume (Million Units) Forecast by Component, 2020 to 2035
  • Table 65: South Asia & Pacific Market Value (USD Billion) Forecast by Technology, 2020 to 2035
  • Table 66: South Asia & Pacific Market Volume (Million Units) Forecast by Technology, 2020 to 2035
  • Table 67: South Asia & Pacific Market Value (USD Billion) Forecast by Vehicle Type, 2020 to 2035
  • Table 68: South Asia & Pacific Market Volume (Million Units) Forecast by Vehicle Type, 2020 to 2035
  • Table 69: South Asia & Pacific Market Value (USD Billion) Forecast by Application, 2020 to 2035
  • Table 70: South Asia & Pacific Market Volume (Million Units) Forecast by Application, 2020 to 2035
  • Table 71: Middle East and Africa Market Value (USD Billion) Forecast by Country, 2020 to 2035
  • Table 72: Middle East and Africa Market Volume (Million Units) Forecast by Country, 2020 to 2035
  • Table 73: Middle East and Africa Market Value (USD Billion) Forecast by Component, 2020 to 2035
  • Table 74: Middle East and Africa Market Volume (Million Units) Forecast by Component, 2020 to 2035
  • Table 75: Middle East and Africa Market Value (USD Billion) Forecast by Technology, 2020 to 2035
  • Table 76: Middle East and Africa Market Volume (Million Units) Forecast by Technology, 2020 to 2035
  • Table 77: Middle East and Africa Market Value (USD Billion) Forecast by Vehicle Type, 2020 to 2035
  • Table 78: Middle East and Africa Market Volume (Million Units) Forecast by Vehicle Type, 2020 to 2035
  • Table 79: Middle East and Africa Market Value (USD Billion) Forecast by Application, 2020 to 2035
  • Table 80: Middle East and Africa Market Volume (Million Units) Forecast by Application, 2020 to 2035

List of Figures

  • Figure 1: Global Market Volume (Million Units) Forecast 2020 to 2035
  • Figure 2: Global Market Pricing Analysis
  • Figure 3: Global Market Value (USD Billion) Forecast 2020 to 2035
  • Figure 4: Global Market Value Share and BPS Analysis by Component, 2025 and 2035
  • Figure 5: Global Market Y-o-Y Growth Comparison by Component, 2025 to 2035
  • Figure 6: Global Market Attractiveness Analysis by Component
  • Figure 7: Global Market Value Share and BPS Analysis by Technology, 2025 and 2035
  • Figure 8: Global Market Y-o-Y Growth Comparison by Technology, 2025 to 2035
  • Figure 9: Global Market Attractiveness Analysis by Technology
  • Figure 10: Global Market Value Share and BPS Analysis by Vehicle Type, 2025 and 2035
  • Figure 11: Global Market Y-o-Y Growth Comparison by Vehicle Type, 2025 to 2035
  • Figure 12: Global Market Attractiveness Analysis by Vehicle Type
  • Figure 13: Global Market Value Share and BPS Analysis by Application, 2025 and 2035
  • Figure 14: Global Market Y-o-Y Growth Comparison by Application, 2025 to 2035
  • Figure 15: Global Market Attractiveness Analysis by Application
  • Figure 16: Global Market Value (USD Billion) Share and BPS Analysis by Region, 2025 and 2035
  • Figure 17: Global Market Y-o-Y Growth Comparison by Region, 2025 to 2035
  • Figure 18: Global Market Attractiveness Analysis by Region
  • Figure 19: North America Market Incremental $ Opportunity, 2025 to 2035
  • Figure 20: Latin America Market Incremental $ Opportunity, 2025 to 2035
  • Figure 21: Western Europe Market Incremental $ Opportunity, 2025 to 2035
  • Figure 22: Eastern Europe Market Incremental $ Opportunity, 2025 to 2035
  • Figure 23: East Asia Market Incremental $ Opportunity, 2025 to 2035
  • Figure 24: South Asia & Pacific Market Incremental $ Opportunity, 2025 to 2035
  • Figure 25: Middle East and Africa Market Incremental $ Opportunity, 2025 to 2035
  • Figure 26: North America Market Value Share and BPS Analysis by Country, 2025 and 2035
  • Figure 27: North America Market Value Share and BPS Analysis by Component, 2025 and 2035
  • Figure 28: North America Market Y-o-Y Growth Comparison by Component, 2025 to 2035
  • Figure 29: North America Market Attractiveness Analysis by Component
  • Figure 30: North America Market Value Share and BPS Analysis by Technology, 2025 and 2035
  • Figure 31: North America Market Y-o-Y Growth Comparison by Technology, 2025 to 2035
  • Figure 32: North America Market Attractiveness Analysis by Technology
  • Figure 33: North America Market Value Share and BPS Analysis by Vehicle Type, 2025 and 2035
  • Figure 34: North America Market Y-o-Y Growth Comparison by Vehicle Type, 2025 to 2035
  • Figure 35: North America Market Attractiveness Analysis by Vehicle Type
  • Figure 36: North America Market Value Share and BPS Analysis by Application, 2025 and 2035
  • Figure 37: North America Market Y-o-Y Growth Comparison by Application, 2025 to 2035
  • Figure 38: North America Market Attractiveness Analysis by Application
  • Figure 39: Latin America Market Value Share and BPS Analysis by Country, 2025 and 2035
  • Figure 40: Latin America Market Value Share and BPS Analysis by Component, 2025 and 2035
  • Figure 41: Latin America Market Y-o-Y Growth Comparison by Component, 2025 to 2035
  • Figure 42: Latin America Market Attractiveness Analysis by Component
  • Figure 43: Latin America Market Value Share and BPS Analysis by Technology, 2025 and 2035
  • Figure 44: Latin America Market Y-o-Y Growth Comparison by Technology, 2025 to 2035
  • Figure 45: Latin America Market Attractiveness Analysis by Technology
  • Figure 46: Latin America Market Value Share and BPS Analysis by Vehicle Type, 2025 and 2035
  • Figure 47: Latin America Market Y-o-Y Growth Comparison by Vehicle Type, 2025 to 2035
  • Figure 48: Latin America Market Attractiveness Analysis by Vehicle Type
  • Figure 49: Latin America Market Value Share and BPS Analysis by Application, 2025 and 2035
  • Figure 50: Latin America Market Y-o-Y Growth Comparison by Application, 2025 to 2035
  • Figure 51: Latin America Market Attractiveness Analysis by Application
  • Figure 52: Western Europe Market Value Share and BPS Analysis by Country, 2025 and 2035
  • Figure 53: Western Europe Market Value Share and BPS Analysis by Component, 2025 and 2035
  • Figure 54: Western Europe Market Y-o-Y Growth Comparison by Component, 2025 to 2035
  • Figure 55: Western Europe Market Attractiveness Analysis by Component
  • Figure 56: Western Europe Market Value Share and BPS Analysis by Technology, 2025 and 2035
  • Figure 57: Western Europe Market Y-o-Y Growth Comparison by Technology, 2025 to 2035
  • Figure 58: Western Europe Market Attractiveness Analysis by Technology
  • Figure 59: Western Europe Market Value Share and BPS Analysis by Vehicle Type, 2025 and 2035
  • Figure 60: Western Europe Market Y-o-Y Growth Comparison by Vehicle Type, 2025 to 2035
  • Figure 61: Western Europe Market Attractiveness Analysis by Vehicle Type
  • Figure 62: Western Europe Market Value Share and BPS Analysis by Application, 2025 and 2035
  • Figure 63: Western Europe Market Y-o-Y Growth Comparison by Application, 2025 to 2035
  • Figure 64: Western Europe Market Attractiveness Analysis by Application
  • Figure 65: Eastern Europe Market Value Share and BPS Analysis by Country, 2025 and 2035
  • Figure 66: Eastern Europe Market Value Share and BPS Analysis by Component, 2025 and 2035
  • Figure 67: Eastern Europe Market Y-o-Y Growth Comparison by Component, 2025 to 2035
  • Figure 68: Eastern Europe Market Attractiveness Analysis by Component
  • Figure 69: Eastern Europe Market Value Share and BPS Analysis by Technology, 2025 and 2035
  • Figure 70: Eastern Europe Market Y-o-Y Growth Comparison by Technology, 2025 to 2035
  • Figure 71: Eastern Europe Market Attractiveness Analysis by Technology
  • Figure 72: Eastern Europe Market Value Share and BPS Analysis by Vehicle Type, 2025 and 2035
  • Figure 73: Eastern Europe Market Y-o-Y Growth Comparison by Vehicle Type, 2025 to 2035
  • Figure 74: Eastern Europe Market Attractiveness Analysis by Vehicle Type
  • Figure 75: Eastern Europe Market Value Share and BPS Analysis by Application, 2025 and 2035
  • Figure 76: Eastern Europe Market Y-o-Y Growth Comparison by Application, 2025 to 2035
  • Figure 77: Eastern Europe Market Attractiveness Analysis by Application
  • Figure 78: East Asia Market Value Share and BPS Analysis by Country, 2025 and 2035
  • Figure 79: East Asia Market Value Share and BPS Analysis by Component, 2025 and 2035
  • Figure 80: East Asia Market Y-o-Y Growth Comparison by Component, 2025 to 2035
  • Figure 81: East Asia Market Attractiveness Analysis by Component
  • Figure 82: East Asia Market Value Share and BPS Analysis by Technology, 2025 and 2035
  • Figure 83: East Asia Market Y-o-Y Growth Comparison by Technology, 2025 to 2035
  • Figure 84: East Asia Market Attractiveness Analysis by Technology
  • Figure 85: East Asia Market Value Share and BPS Analysis by Vehicle Type, 2025 and 2035
  • Figure 86: East Asia Market Y-o-Y Growth Comparison by Vehicle Type, 2025 to 2035
  • Figure 87: East Asia Market Attractiveness Analysis by Vehicle Type
  • Figure 88: East Asia Market Value Share and BPS Analysis by Application, 2025 and 2035
  • Figure 89: East Asia Market Y-o-Y Growth Comparison by Application, 2025 to 2035
  • Figure 90: East Asia Market Attractiveness Analysis by Application
  • Figure 91: South Asia & Pacific Market Value Share and BPS Analysis by Country, 2025 and 2035
  • Figure 92: South Asia & Pacific Market Value Share and BPS Analysis by Component, 2025 and 2035
  • Figure 93: South Asia & Pacific Market Y-o-Y Growth Comparison by Component, 2025 to 2035
  • Figure 94: South Asia & Pacific Market Attractiveness Analysis by Component
  • Figure 95: South Asia & Pacific Market Value Share and BPS Analysis by Technology, 2025 and 2035
  • Figure 96: South Asia & Pacific Market Y-o-Y Growth Comparison by Technology, 2025 to 2035
  • Figure 97: South Asia & Pacific Market Attractiveness Analysis by Technology
  • Figure 98: South Asia & Pacific Market Value Share and BPS Analysis by Vehicle Type, 2025 and 2035
  • Figure 99: South Asia & Pacific Market Y-o-Y Growth Comparison by Vehicle Type, 2025 to 2035
  • Figure 100: South Asia & Pacific Market Attractiveness Analysis by Vehicle Type
  • Figure 101: South Asia & Pacific Market Value Share and BPS Analysis by Application, 2025 and 2035
  • Figure 102: South Asia & Pacific Market Y-o-Y Growth Comparison by Application, 2025 to 2035
  • Figure 103: South Asia & Pacific Market Attractiveness Analysis by Application
  • Figure 104: Middle East and Africa Market Value Share and BPS Analysis by Country, 2025 and 2035
  • Figure 105: Middle East and Africa Market Value Share and BPS Analysis by Component, 2025 and 2035
  • Figure 106: Middle East and Africa Market Y-o-Y Growth Comparison by Component, 2025 to 2035
  • Figure 107: Middle East and Africa Market Attractiveness Analysis by Component
  • Figure 108: Middle East and Africa Market Value Share and BPS Analysis by Technology, 2025 and 2035
  • Figure 109: Middle East and Africa Market Y-o-Y Growth Comparison by Technology, 2025 to 2035
  • Figure 110: Middle East and Africa Market Attractiveness Analysis by Technology
  • Figure 111: Middle East and Africa Market Value Share and BPS Analysis by Vehicle Type, 2025 and 2035
  • Figure 112: Middle East and Africa Market Y-o-Y Growth Comparison by Vehicle Type, 2025 to 2035
  • Figure 113: Middle East and Africa Market Attractiveness Analysis by Vehicle Type
  • Figure 114: Middle East and Africa Market Value Share and BPS Analysis by Application, 2025 and 2035
  • Figure 115: Middle East and Africa Market Y-o-Y Growth Comparison by Application, 2025 to 2035
  • Figure 116: Middle East and Africa Market Attractiveness Analysis by Application
  • Figure 117: Global Market - Tier Structure Analysis
  • Figure 118: Global Market - Company Share Analysis

Frequently Asked Questions

What was the overall size of the vehicle interior air quality monitoring technology market in 2025?

The industry was valued at USD 1.3 billion in 2025.

How large is the vehicle interior air quality monitoring technology market expected to be in 2035?

It is projected to reach USD 2.6 billion by 2035.

What is the CAGR of the vehicle interior air quality monitoring technology market from 2025 to 2035?

The industry is expected to grow at a CAGR of 7.2% from 2025 to 2035.

What share will hardware hold in the vehicle interior air quality monitoring technology market in 2025?

A 65% share is projected to be held by hardware in 2025.

What market share is expected for cabin air quality monitoring in the vehicle interior air quality monitoring technology market by 2025?

Cabin air quality monitoring is anticipated to hold a 35% share in 2025.

Explore Similar Insights

Future Market Insights

Vehicle Interior Air Quality Monitoring Technology Market