The Vehicle Radar Test System Market is estimated to be valued at USD 5.8 billion in 2025 and is projected to reach USD 18.2 billion by 2035, registering a compound annual growth rate (CAGR) of 12.1% over the forecast period.
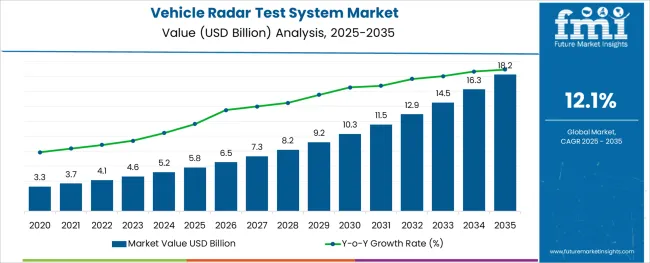
The vehicle radar test system market is expanding steadily, driven by the rapid evolution of advanced driver-assistance systems and the ongoing development of autonomous driving technologies. Automotive manufacturers and radar module suppliers are increasingly investing in test environments that simulate real-world driving conditions to validate radar functionality, frequency response, and signal accuracy. High-frequency radar testing has become a critical requirement as vehicles integrate 77 gigahertz and higher millimeter-wave radar systems, necessitating highly specialized and precise testing solutions.
Manufacturers are emphasizing hardware-software convergence and modular instrumentation to facilitate scalable, automated test setups for radar performance validation. Additionally, growing demand for over-the-air testing in controlled environments is supporting innovation in hardware configuration and vector signal processing.
As radar becomes a core sensor in automated vehicles, the need for accurate, repeatable, and high-throughput test solutions is expected to increase. Market growth will be further supported by regulatory mandates around radar safety, cross-domain compatibility, and high-fidelity simulation frameworks.
The market is segmented by Components and Application and region. By Components, the market is divided into VST (Vector Signal Transceiver), VDG (Variable Delay Generator), PXI Controller, and Antennae. In terms of Application, the market is classified into Research and Development, Radar Module Manufacturing, Vehicle Manufacturing, and Others.
Regionally, the market is classified into North America, Latin America, Western Europe, Eastern Europe, Balkan & Baltic Countries, Russia & Belarus, Central Asia, East Asia, South Asia & Pacific, and the Middle East & Africa.
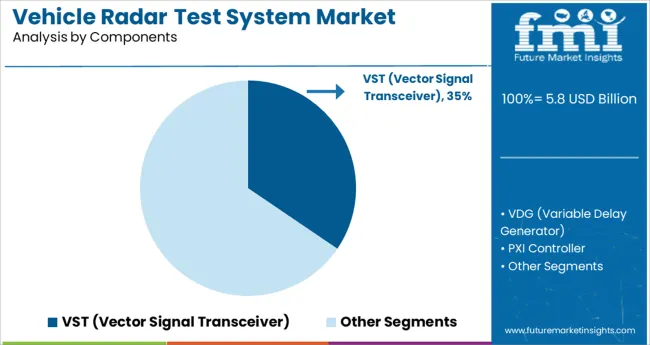
The vector signal transceiver component is projected to account for 34.5% of total market revenue in 2025, making it the leading hardware segment. This is being driven by its ability to combine signal generation and signal analysis in a single, compact architecture, which reduces test time and increases measurement accuracy for radar systems.
VSTs enable rapid switching across multiple frequency bands, which is critical in testing automotive radar modules operating in diverse conditions. Their integration with software-defined test platforms has allowed for real-time signal manipulation and dynamic scenario simulation.
Additionally, the flexibility of VSTs in supporting multi-emitter environments and hardware-in-the-loop configurations has positioned them as essential components in both development and validation workflows. As testing environments evolve to reflect high-speed, real-time traffic simulations, the VST’s performance and interoperability with radar sensors and simulation engines are expected to sustain its leading share in the component segment.
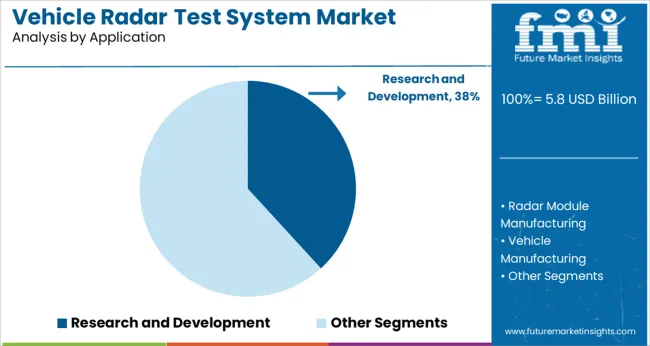
Research and development is projected to contribute 38.2% of the total revenue in 2025 within the application segment, establishing it as the dominant use case for vehicle radar test systems. This segment’s leadership is driven by continuous innovation in autonomous vehicle technologies and the need for rigorous pre-deployment validation of radar functionality.
R and D teams within OEMs and Tier 1 suppliers rely heavily on test systems to model complex radar scenarios, simulate sensor fusion outputs, and verify multi-path signal behaviors in controlled environments. The increased focus on improving radar resolution, object classification, and cross-traffic detection capabilities has necessitated specialized testing across various frequencies and modulation schemes.
Moreover, the transition from prototype development to full system integration requires advanced debugging, waveform generation, and phase coherence testing-all of which are core functions in the R and D workflow. With rapid advancements in radar technology and growing regulatory emphasis on sensor reliability, the research and development segment is expected to remain the cornerstone of system demand.
It is anticipated that the increasing demand for autonomous driving and safe commercial vehicle is the prime factor driving the growth of the vehicle radar test systems market. The expected introduction of fully automated vehicles in the upcoming years is also likely to boost the demand for this product.
Stringent government regulations regarding vehicle safety systems are likely to augment growth in the vehicle radar test systems market. Consumers are increasingly getting conscious of vehicle safety, which is leading to increased demand for features such as cruise control and blind-spot detection that can support drivers and reduce accidents.
The leading vehicle manufacturers are paying attention to developing next-generation car models that would be equipped with up to ten radar sensors, which enable a 360-degree view, projected to be essential for semi-autonomous operation, as well as advanced driver assistance. Therefore, the demand for vehicle radar test systems is leading to increased research and development activities undertaken by the market players, which is likely to bolster the market size during the forecast period.
Although there are a number of factors fueling the market growth for vehicle radar test systems, it is witnessed that some factors are likely to limit the market expansion during the forecast period. The vehicle radar test systems operate on a specific signal structure.
However, they lack any inherent authentication that makes the technology susceptible to spoofing attacks. A successful spoofing attack is likely to severely influence the integrity of vehicle occupants by potentially causing the vehicle to stop, collide by breaching the target radar, or change direction.
There are several installation complexities associated with the vehicle radar test systems, and the integration of the radar module into the vehicle’s platform adds up to the complexity. Additionally, a high cost is associated with this product, which is likely to serve as one of the prime restraining factors for the growth of the global vehicle radar test systems market.
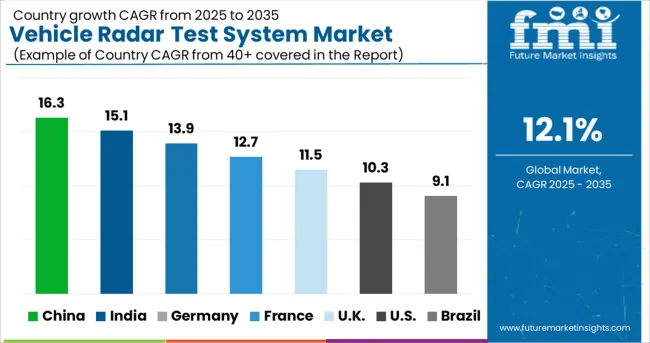
Europe is anticipated to hold the largest share of the global vehicle radar test systems market. At present, the European region is accountable for 27.3% of the total market share of vehicle radar test systems.
This expansion can be characterized by the early adoption of advanced driver assistance technologies in this region. Furthermore, compared to other regions, stringent vehicle safety regulations implemented by the government are expected to favor the demand for vehicle radar test systems in Europe. In addition to that, there is a demand for hybrid vehicles in these regions that are driving the share or market for vehicle radar test systems.
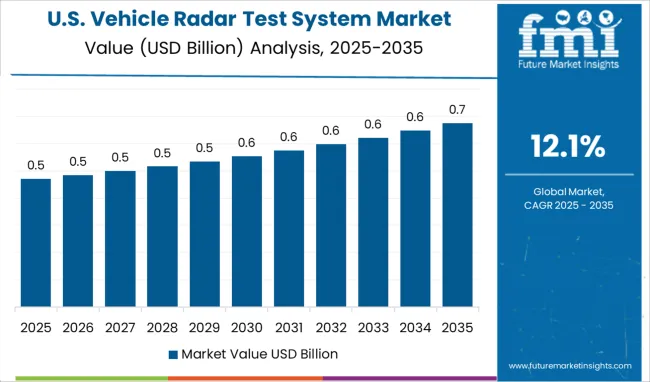
North America is projected to have significant growth at a rapid pace during the forecast period in its vehicle radar test systems market. Currently, the region is holding 25.2% of the total market share for vehicle radar test systems.
The growth can be attributed to the combination of technology in the vehicle radar systems. It has led to a surge in automobile sales in recent years. In addition to this, it is anticipated that the increasing frequency of vehicular accidents and greater awareness regarding the benefits associated with driving assistance features such as brake assist, collision warning systems, and more are fueling the demand for vehicle radar test systems in this region.
Two Start-ups to Watch for in the Vehicle Radar Test Systems Market
Start-up companies are intensifying their focus on their innovation capabilities and resorting to mergers and acquisitions to develop compact yet high-performance solutions.
Some of the other notable start-ups are Sencept, Microbrain, Spartan Radar, and others.
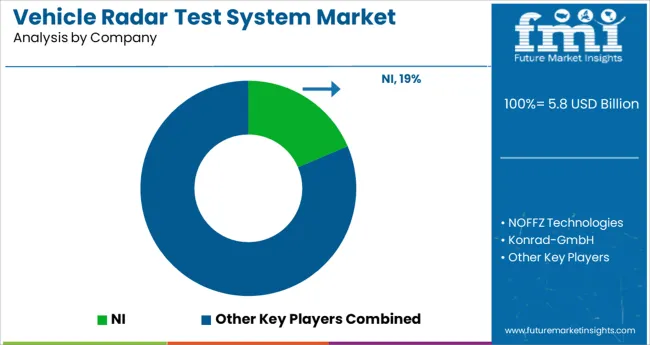
Top 3 Recent Developments Showing Fierce Competition in the Vehicle Radar Test Systems Market
The key market players constantly focusing on the reduction of cost and the greater need for enhancing the functionality by using more efficient vehicle test radar systems.
Some of the key companies in the vehicle radar test systems market are:
| Report Attribute | Details |
|---|---|
| Growth Rate | CAGR of 12.1% from 2025 to 2035 |
| Base Year for Estimation | 2024 |
| Historical Data | 2020 to 2024 |
| Forecast Period | 2025 to 2035 |
| Quantitative Units | Revenue in million and CAGR from 2025 to 2035 |
| Report Coverage | Revenue Forecast, Volume Forecast, Company Ranking, Competitive Landscape, Growth Factors, Trends, and Pricing Analysis |
| Segments Covered | Components, Applications, Region |
| Regions Covered | North America; Latin America; Europe; East Asia; South Asia; Oceania; Middle East and Africa |
| Key Countries Profiled | United States of America, Canada, Brazil, Argentina, Germany, United Kingdom, France, Spain, Italy, Nordics, BENELUX, Australia & New Zealand, China, India, ASIAN, GCC Countries, South Africa |
| Key Companies Profiled | Instruments; NOFFZ Technologies; Konrad GmbH; KEYCOM Corp.; SAE International; Anritsu Corporation.; Continental; Robert Bosch GmbH; Autoliv Inc. |
| Customization | Available Upon Request |
The global vehicle radar test system market is estimated to be valued at USD 5.8 billion in 2025.
It is projected to reach USD 18.2 billion by 2035.
The market is expected to grow at a 12.1% CAGR between 2025 and 2035.
The key product types are vst (vector signal transceiver), vdg (variable delay generator), pxi controller and antennae.
research and development segment is expected to dominate with a 38.2% industry share in 2025.


Full Research Suite comprises of:
Market outlook & trends analysis
Interviews & case studies
Strategic recommendations
Vendor profiles & capabilities analysis
5-year forecasts
8 regions and 60+ country-level data splits
Market segment data splits
12 months of continuous data updates
DELIVERED AS:
PDF EXCEL ONLINE
Vehicle Scanner Market Size and Share Forecast Outlook 2025 to 2035
Vehicle-to-grid Market Size and Share Forecast Outlook 2025 to 2035
Vehicle Transfer Case Market Size and Share Forecast Outlook 2025 to 2035
Vehicle Acoustic DSP Chips Market Size and Share Forecast Outlook 2025 to 2035
Vehicle Cargo Box Market Size and Share Forecast Outlook 2025 to 2035
Vehicle Jump Starter Market Size and Share Forecast Outlook 2025 to 2035
Vehicle Moving Services Market Size and Share Forecast Outlook 2025 to 2035
Vehicle Security Sensor Market Size and Share Forecast Outlook 2025 to 2035
Vehicle To Vehicle Communication Market Size and Share Forecast Outlook 2025 to 2035
Vehicle Roadside Assistance Market Size and Share Forecast Outlook 2025 to 2035
Vehicle as a Service Market Size and Share Forecast Outlook 2025 to 2035
Vehicle Integrated Solar Panels Market Size and Share Forecast Outlook 2025 to 2035
Vehicle Networking Market Size and Share Forecast Outlook 2025 to 2035
Vehicle-to-Everything (V2X) Cybersecurity Market Size and Share Forecast Outlook 2025 to 2035
Vehicle Armor Market Size and Share Forecast Outlook 2025 to 2035
Vehicle Conversion Market Size and Share Forecast Outlook 2025 to 2035
Vehicle Health Monitoring Market Size and Share Forecast Outlook 2025 to 2035
Vehicle Interior Air Quality Monitoring Technology Market Analysis - Size, Share, and Forecast Outlook 2025 to 2035
Vehicle Electrification Market Growth - Trends & Forecast 2025 to 2035
Vehicle Control Unit (VCU) Market Growth & Demand 2025 to 2035

Thank you!
You will receive an email from our Business Development Manager. Please be sure to check your SPAM/JUNK folder too.
Chat With
MaRIA