The Vehicle Conversion Market is estimated to be valued at USD 6.4 billion in 2025 and is projected to reach USD 15.2 billion by 2035, registering a compound annual growth rate (CAGR) of 9.0% over the forecast period.
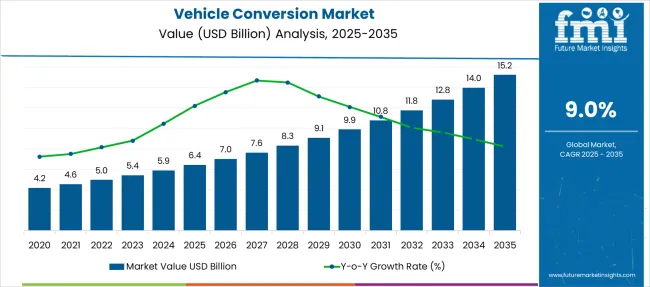
| Metric | Value |
|---|---|
| Vehicle Conversion Market Estimated Value in (2025E) | USD 6.4 billion |
| Vehicle Conversion Market Forecast Value in (2035F) | USD 15.2 billion |
| Forecast CAGR (2025 to 2035) | 9.0% |
The vehicle conversion market is expanding steadily, driven by growing demand for customized mobility solutions, regulatory shifts favoring fuel efficiency and accessibility, and increased awareness of adaptive vehicle technologies. Industries and consumers are increasingly seeking tailored vehicle modifications to enhance performance, meet functional needs, or comply with regional transportation standards.
The market is also benefiting from a rise in electric vehicle conversions and the growing availability of aftermarket services, particularly in urban and semi-urban regions. Advances in lightweight materials, digital diagnostics, and modular systems have further improved conversion efficiency, safety, and reliability.
Looking ahead, rising adoption of mobility-enhancing conversions for differently-abled individuals, along with demand from logistics, tourism, and ridesharing sectors, is expected to fuel sustainable growth. As vehicle ownership models evolve and consumer focus shifts toward utility and cost-efficiency, the conversion market is well-positioned to support emerging trends in both personal and commercial mobility.
The vehicle conversion market is segmented by type, vehicle, and conversion and geographic regions. By type, the vehicle conversion market is divided into Product and Service. In terms of vehicles, the vehicle conversion market is classified into Passenger cars and Commercial vehicles. Based on the conversion of the vehicle, the market is segmented into Mobility conversions, Commercial conversions, Recreational conversions, and Others. Regionally, the vehicle conversion industry is classified into North America, Latin America, Western Europe, Eastern Europe, Balkan & Baltic Countries, Russia & Belarus, Central Asia, East Asia, South Asia & Pacific, and the Middle East & Africa.
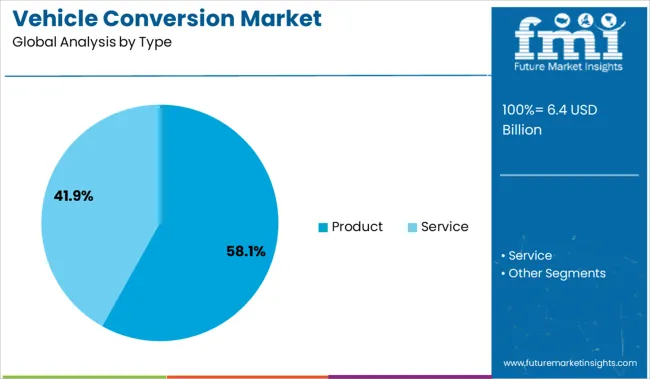
The product segment holds a leading 58.1% share in the vehicle conversion market, highlighting the increasing demand for tangible, component-based modifications that offer performance, safety, and comfort improvements. This includes physical components such as suspension upgrades, alternative fuel kits, braking systems, and accessibility add-ons, which are widely used across both personal and commercial vehicle classes.
The segment is gaining momentum as OEMs and aftermarket service providers introduce plug-and-play conversion kits, enhancing installation efficiency and customization. Regulatory support for emission-reduction technologies and energy-efficient transport solutions has further driven product-based conversions, especially in urban centers where compliance with evolving standards is mandatory.
Consumer preference for durable, high-performance vehicle modifications continues to reinforce demand within this segment, and ongoing innovations in materials and design are expected to support its sustained growth trajectory.
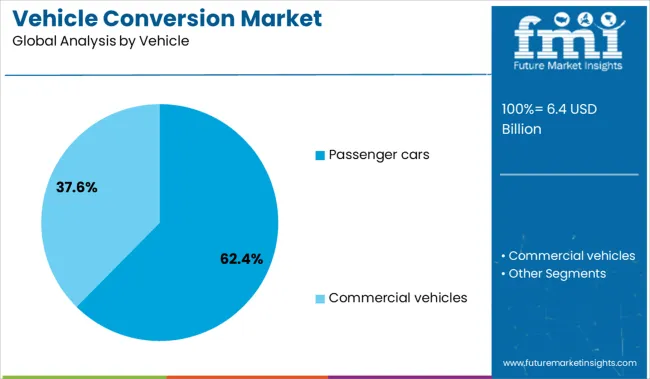
Passenger cars dominate the vehicle category with a 62.4% market share, driven by high ownership rates, frequent demand for personalization, and growing consumer interest in cost-effective alternatives to purchasing new vehicles. Vehicle conversions in this segment range from performance enhancements and fuel-type shifts to accessibility and aesthetic modifications, making it the most versatile and dynamic category in the market.
The rise of electric vehicle retrofits and mobility conversions in passenger cars has significantly contributed to this share, as consumers seek sustainable solutions without replacing existing vehicles. Additionally, the influence of ridesharing, tourism, and fleet rental industries has encouraged operators to invest in conversions that extend vehicle functionality and service life.
As urban mobility needs evolve and consumers prioritize adaptability and value, the passenger car segment is expected to remain the core focus of conversion activity across global markets.
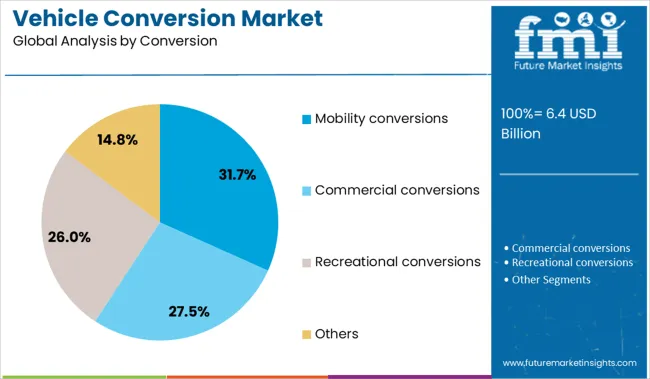
The mobility conversions segment accounts for 31.7% of the vehicle conversion market, reflecting increasing efforts to make vehicles more accessible for individuals with disabilities and mobility challenges. These conversions typically involve structural modifications such as wheelchair lifts, ramps, hand controls, lowered floors, and automated entry systems, enabling greater independence and comfort for end users.
Demand is being driven by aging populations, supportive government policies, and the rise of inclusive transportation services in public and private sectors. Automotive manufacturers and specialized mobility service providers are expanding their offerings to include both retrofit kits and purpose-built vehicle designs that comply with safety and accessibility standards.
As awareness and advocacy for mobility inclusion grow globally, the segment is expected to experience continued investment and innovation, establishing itself as a critical component of the broader vehicle conversion market.
Vehicle conversion services are expanding as consumers and businesses seek customized mobility solutions. New segments are emerging around specialty utility vans, mobile commerce units and tailored mobility platforms.
Businesses in delivery, mobile services, and event hosting are increasingly investing in vehicle conversions to optimize practicality at scale. Converting standard van or truck platforms into refrigerated delivery units, mobile coffee bars or pop-up retail showcases meets unique operational requirements. Similarly, consumers convert vans for camper van travel, hobbyist use or as mobile offices, driven by growing flexible lifestyle preference. Conversion providers offer customized layouts, built-in fixtures and utility power systems to match specific job demands. These tailored solutions reduce long term leasing and maintenance costs compared to buying ready‑built models. Vehicle conversions also enable businesses to stay agile in changing consumer demands by updating configurations as needed for new routes service styles or branding.
Growth opportunities lie in offering modular conversion kits that fit multiple vehicle models allowing easier upgrades and aftermarket adjustments. Subscription based conversion services and fleet leasing packages with updated interior designs or equipment help operators scale quickly. Collaborations with vehicle manufacturers and mobility firms enable factory pre‑integration of conversion ready features such as electrical hook ups, insulation points or service mounting rails. Partnerships with urban service providers in sectors like food truck services, mobile clinics or last mile delivery support access to conversion services through bundled packages. Regions with growing ride sharing and mobile small business demand offer potential for on‑demand mobility conversion models. Diagnostic support apps and modular toolkits also help standard conversion processes and simplify maintenance updates and regulatory certification compliance.
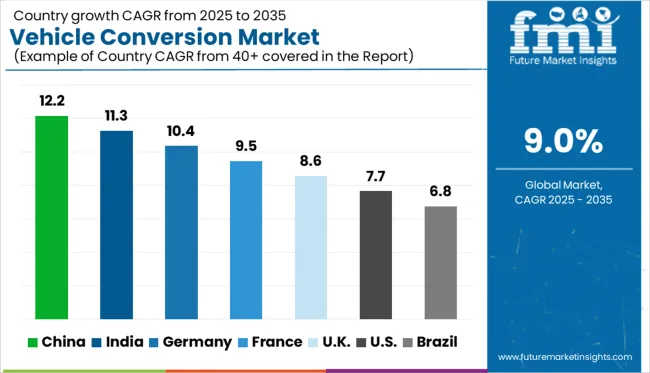
| Country | CAGR |
|---|---|
| China | 12.2% |
| India | 11.3% |
| Germany | 10.4% |
| France | 9.5% |
| UK | 8.6% |
| USA | 7.7% |
| Brazil | 6.8% |
The global market is forecast to grow at a CAGR of 9.0% from 2025 to 2035, fueled by rising demand for alternative fuel systems, electric retrofitting, and specialized vehicle applications. China leads with a robust 12.2% CAGR, supported by aggressive EV retrofitting policies and urban logistics fleet modifications. India follows at 11.3%, leveraging its strong aftermarket ecosystem and increasing adoption of dual-fuel and CNG conversions in the commercial vehicle segment. Germany, an OECD member, records a 10.4% CAGR, driven by the premium segment and regulatory push for emissions compliance. The UK, with 8.6%, and the US at 7.7%, show stable growth as mature markets pivot toward performance tuning and accessibility-focused conversions. This report covers detailed analysis of 40+ countries, and the top five countries have been shared as a reference
China is expanding at a 12.2% CAGR, with YoY gains driven by demand across logistics, mobility services, and rural transport upgrades. Conversion workshops are experiencing high volumes as light trucks and vans are modified for last-mile delivery, cold chain cargo, and ride-hailing services. Cities with heavy traffic restrictions are seeing growth in the conversion of fuel vehicles into compliant electric formats. Local firms are offering modular kits for passenger-to-cargo transformations, which are widely adopted by courier networks and local cooperatives. Aggressive price competition among converters is improving affordability across mid-tier and entry-level fleet segments.
India is advancing at a 11.3% CAGR, with strong YoY momentum coming from demand in school transport, rural mobility, and light commercial haulage. Passenger vans and three-wheelers are frequently converted to carry goods, especially in state-regulated rural logistics programs. Demand for alternative fuel retrofitting, particularly CNG and LPG, is growing across metro and tier-2 regions. Informal workshops dominate the lower end of the market, while certified conversion centers are gaining share among regulated fleets. State subsidies on alternative fuel kits are improving conversion affordability for intercity taxi operators and local delivery networks.
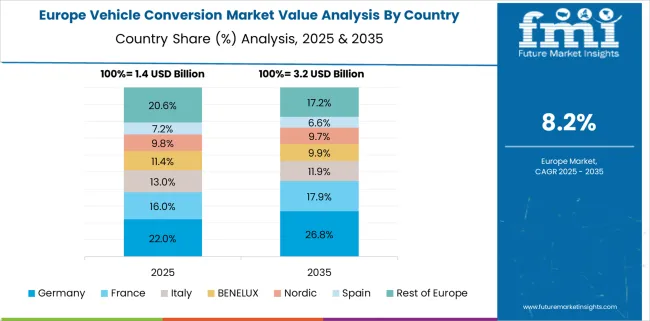
Germany is progressing at a 10.4% CAGR, with YoY gains seen in vehicle repurposing for tourism, healthcare, and service sectors. Retired utility vans are being converted into campervans, mobile clinics, and trade vehicles such as mobile workshops. Regulatory clarity has encouraged more private sector players to offer certified retrofit packages, particularly in EV adaptation and motorhome class upgrades. Demand is shifting from industrial to mixed-use vehicles, especially among self-employed tradesmen and travel operators. Leasing firms are also converting end-of-term vehicles into secondary-use formats to extend lifecycle value.
The United Kingdom is growing at a 8.6% CAGR, with YoY demand driven by commercial conversions in catering, pet care, and mobile repair services. Demand for refrigerated retrofits is up among food delivery fleets, especially in suburban areas. Consumers are showing rising interest in campervan modifications for short-haul travel, pushing builders to offer pre-designed interiors. Companies are converting aging utility vans into workshop vehicles with onboard storage and power systems. Regulations around vehicle roadworthiness and emissions are shaping retrofit decisions, especially in areas with low-emission zone restrictions.
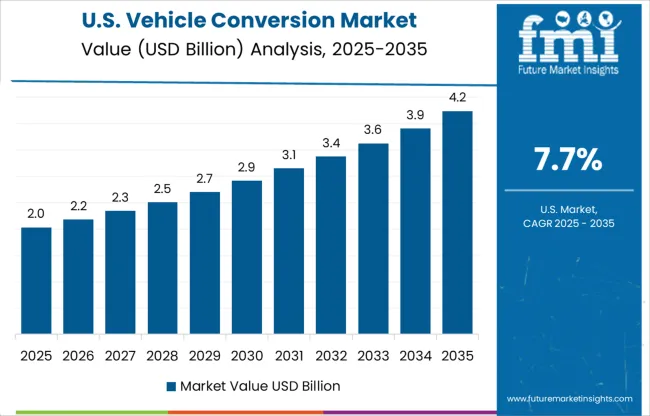
The United States is expanding at a 7.7% CAGR, with steady YoY growth across commercial, recreational, and specialized utility vehicle conversions. Conversion companies are receiving orders from telecom, maintenance, and medical transport providers seeking field-ready vehicle solutions. The RV and van-life segments continue to drive private modifications, especially among retirees and remote workers. Fuel system conversions, including propane and hybrid, are gaining traction among school districts and municipal fleets. Demand is highest in the West and Midwest, where spacious layouts enable more extensive custom builds. Regulations vary state by state, which influences regional service concentration.
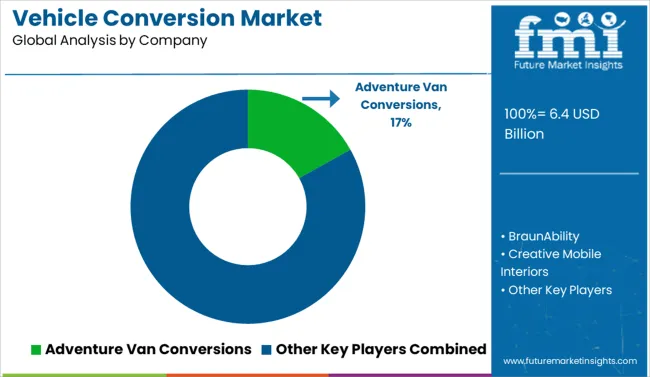
The vehicle conversion market is fragmented, driven by rising demand for custom-built mobility, camper, and electric vehicle (EV) solutions. Adventure Van Conversions leads the segment with expertise in off-grid and overlanding customization, supported by high-end craftsmanship and lifestyle-focused interiors. Companies like BraunAbility specialize in mobility-accessible conversions, while Creative Mobile Interiors and Glampervan cater to luxury and RV lifestyle markets. EV retrofit providers such as EV Source, EV4U, and DIYev Inc. focus on battery integration and drivetrain upgrades. Meanwhile, firms like Midwest Automotive Designs and Kisae Technology Inc. enhance van upfitting with smart systems. Growth is fueled by eco-conscious travel, remote work trends, and electric mobility.
Recent Industry Developments On February 24, 2025, Kia officially introduced the PV5 battery-electric van at its EV Day event in Spain, built on the E-GMP.S platform. The PV5 offers conversion models including passenger transport, leisure vans, refrigerated units, and wheelchair-accessible variants—designed from the ground up for modular upfits and retrofit flexibility in commercial and specialty vehicle segments
| Item | Value |
|---|---|
| Quantitative Units | USD 6.4 Billion |
| Type | Product and Service |
| Vehicle | Passenger cars and Commercial vehicles |
| Conversion | Mobility conversions, Commercial conversions, Recreational conversions, and Others |
| Regions Covered | North America, Europe, Asia-Pacific, Latin America, Middle East & Africa |
| Country Covered | United States, Canada, Germany, France, United Kingdom, China, Japan, India, Brazil, South Africa |
| Key Companies Profiled | Adventure Van Conversions, BraunAbility, Creative Mobile Interiors, DIYev Inc., El Kapitan Conversion Vans, EV Source, EV4U Custom Conversions, Glampervan, Kisae Technology Inc., and Midwest Automotive Designs |
| Additional Attributes | Dollar sales by conversion type, vehicle class, and end-use application; regional demand driven by mobility customization, fleet electrification, and regulatory compliance; innovation in electric powertrain retrofitting, adaptive controls, and modular kits; cost dynamics shaped by labor intensity, component sourcing, and certification requirements; environmental impact through emissions reduction and vehicle lifecycle extension; and emerging use cases in last-mile delivery, accessible transport, and recreational vehicle customization. |
The global vehicle conversion market is estimated to be valued at USD 6.4 billion in 2025.
The market size for the vehicle conversion market is projected to reach USD 15.2 billion by 2035.
The vehicle conversion market is expected to grow at a 9.0% CAGR between 2025 and 2035.
The key product types in vehicle conversion market are product and service.
In terms of vehicle, passenger cars segment to command 62.4% share in the vehicle conversion market in 2025.


Our Research Products

The "Full Research Suite" delivers actionable market intel, deep dives on markets or technologies, so clients act faster, cut risk, and unlock growth.

The Leaderboard benchmarks and ranks top vendors, classifying them as Established Leaders, Leading Challengers, or Disruptors & Challengers.

Locates where complements amplify value and substitutes erode it, forecasting net impact by horizon

We deliver granular, decision-grade intel: market sizing, 5-year forecasts, pricing, adoption, usage, revenue, and operational KPIs—plus competitor tracking, regulation, and value chains—across 60 countries broadly.

Spot the shifts before they hit your P&L. We track inflection points, adoption curves, pricing moves, and ecosystem plays to show where demand is heading, why it is changing, and what to do next across high-growth markets and disruptive tech

Real-time reads of user behavior. We track shifting priorities, perceptions of today’s and next-gen services, and provider experience, then pace how fast tech moves from trial to adoption, blending buyer, consumer, and channel inputs with social signals (#WhySwitch, #UX).

Partner with our analyst team to build a custom report designed around your business priorities. From analysing market trends to assessing competitors or crafting bespoke datasets, we tailor insights to your needs.
Supplier Intelligence
Discovery & Profiling
Capacity & Footprint
Performance & Risk
Compliance & Governance
Commercial Readiness
Who Supplies Whom
Scorecards & Shortlists
Playbooks & Docs
Category Intelligence
Definition & Scope
Demand & Use Cases
Cost Drivers
Market Structure
Supply Chain Map
Trade & Policy
Operating Norms
Deliverables
Buyer Intelligence
Account Basics
Spend & Scope
Procurement Model
Vendor Requirements
Terms & Policies
Entry Strategy
Pain Points & Triggers
Outputs
Pricing Analysis
Benchmarks
Trends
Should-Cost
Indexation
Landed Cost
Commercial Terms
Deliverables
Brand Analysis
Positioning & Value Prop
Share & Presence
Customer Evidence
Go-to-Market
Digital & Reputation
Compliance & Trust
KPIs & Gaps
Outputs
Full Research Suite comprises of:
Market outlook & trends analysis
Interviews & case studies
Strategic recommendations
Vendor profiles & capabilities analysis
5-year forecasts
8 regions and 60+ country-level data splits
Market segment data splits
12 months of continuous data updates
DELIVERED AS:
PDF EXCEL ONLINE
Vehicle-Mounted Payment Terminal Market Size and Share Forecast Outlook 2025 to 2035
Vehicle Scanner Market Size and Share Forecast Outlook 2025 to 2035
Vehicle-to-grid Market Size and Share Forecast Outlook 2025 to 2035
Vehicle Transfer Case Market Size and Share Forecast Outlook 2025 to 2035
Vehicle Barrier System Market Size and Share Forecast Outlook 2025 to 2035
Vehicle Acoustic DSP Chips Market Size and Share Forecast Outlook 2025 to 2035
Vehicle Cargo Box Market Size and Share Forecast Outlook 2025 to 2035
Vehicle Jump Starter Market Size and Share Forecast Outlook 2025 to 2035
Vehicle Moving Services Market Size and Share Forecast Outlook 2025 to 2035
Vehicle Security Sensor Market Size and Share Forecast Outlook 2025 to 2035
Vehicle To Vehicle Communication Market Size and Share Forecast Outlook 2025 to 2035
Vehicle Roadside Assistance Market Size and Share Forecast Outlook 2025 to 2035
Vehicle as a Service Market Size and Share Forecast Outlook 2025 to 2035
Vehicle Integrated Solar Panels Market Size and Share Forecast Outlook 2025 to 2035
Vehicle Networking Market Size and Share Forecast Outlook 2025 to 2035
Vehicle-to-Everything (V2X) Cybersecurity Market Size and Share Forecast Outlook 2025 to 2035
Vehicle Armor Market Size and Share Forecast Outlook 2025 to 2035
Vehicle Health Monitoring Market Size and Share Forecast Outlook 2025 to 2035
Vehicle Tracking System Market Size and Share Forecast Outlook 2025 to 2035
Vehicle Radar Test System Market Size and Share Forecast Outlook 2025 to 2035

Thank you!
You will receive an email from our Business Development Manager. Please be sure to check your SPAM/JUNK folder too.
Chat With
MaRIA