The global barcode scanner market is projected to reach USD 15.8 billion by 2035, recording an absolute increase of USD 7.4 billion over the forecast period. The market is valued at USD 8.4 billion in 2025 and is set to rise at a CAGR of 6.5% during the assessment period.
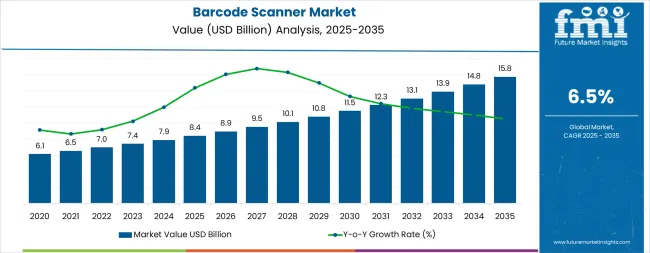
The overall market size is expected to grow by 1.9 times during the same period, supported by increasing demand for automated inventory management systems worldwide, driving demand for efficient data capture solutions and increasing investments in retail automation and warehouse modernization projects globally. However, high initial investment costs and system integration complexities may pose challenges to market expansion.
Between 2025 and 2030, the barcode scanner market is projected to expand from USD 8.4 billion to USD 11.6 billion, resulting in a value increase of USD 3.2 billion, which represents 43.2% of the total forecast growth for the decade.
This phase of development will be shaped by rising demand for retail automation and logistics optimization applications, product innovation in mobile technology and wireless connectivity systems, as well as expanding integration with IoT platforms and cloud-based management initiatives. Companies are establishing competitive positions through investment in advanced scanning technologies, rugged design solutions, and strategic market expansion across retail, healthcare, and manufacturing applications.
From 2030 to 2035, the market is forecast to grow from USD 11.6 billion to USD 15.8 billion, adding another USD 4.2 billion, which constitutes 56.8% of the overall ten-year expansion. This period is expected to be characterized by the expansion of specialized scanning systems, including advanced RFID-enabled formulations and integrated application solutions tailored for specific industry requirements, strategic collaborations between technology manufacturers and end-user industries, and an enhanced focus on operational efficiency and digital transformation optimization.
The growing emphasis on supply chain visibility and automated data capture will drive demand for advanced, high-performance barcode scanner solutions across diverse commercial and industrial applications.
| Metric | Value |
|---|---|
| Market Value (2025) | USD 8.4 billion |
| Market Forecast Value (2035) | USD 15.8 billion |
| Forecast CAGR (2025 to 2035) | 6.5% |
The barcode scanner market grows by enabling businesses to achieve superior operational efficiency and accuracy in data capture across multiple industries, ranging from small-scale retail operations to large-scale warehouse complexes. Business operators face mounting pressure to improve inventory management and operational efficiency, with barcode scanner solutions typically providing 95-99% accuracy improvement in data capture compared to manual systems, making advanced scanning technology essential for competitive business operations.
The retail and logistics industry's need for maximum operational efficiency creates demand for advanced scanner solutions that can minimize errors, enhance speed, and ensure consistent performance across diverse operational environments.
Government initiatives promoting digital transformation and automated systems drive adoption in retail, healthcare, and manufacturing applications, where operational performance has a direct impact on productivity and cost efficiency. However, high upfront investment costs and the complexity of achieving seamless integration across different operational systems may limit adoption rates among cost-sensitive businesses and regions with limited technical infrastructure.
The market is segmented by product type, end user, technology, and region. By product type, the market is divided into portable/handheld and fixed position systems. Based on end user, the market is categorized into retail & commercial, general manufacturing, healthcare, logistics & warehouse, commercial aviation, defence, and others.
By technology, the market is classified into pen type readers, laser scanners, CCD readers, camera-based readers, omnidirectional scanners, smartphone-based scanners, and RFID technology. Regionally, the market is divided into North America, Latin America, Western Europe, Eastern Europe, East Asia, South Asia Pacific, and Middle East & Africa.
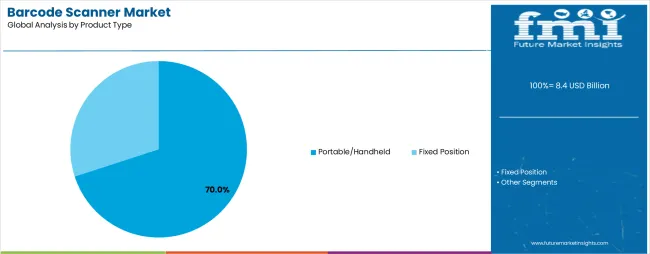
The portable/handheld segment represents the dominant force in the barcode scanner market, capturing approximately 70.0% of total market share in 2025. This advanced product category encompasses formulations featuring mobility and flexibility characteristics, including enhanced ergonomic design and wireless connectivity capabilities that enable superior operational versatility and enhanced performance characteristics.
The portable/handheld segment's market leadership stems from its exceptional adaptability capabilities in diverse operational environments, with scanners capable of handling various scanning applications while maintaining consistent performance and operational efficiency across different business conditions.
The fixed position segment maintains substantial market presence, serving businesses that require stationary scanning solutions for high-volume applications and automated processing systems. These systems offer reliable performance for specialized industrial applications while providing sufficient functionality to meet advanced operational requirements in manufacturing and logistics applications.
Key technological advantages driving the portable/handheld segment include:
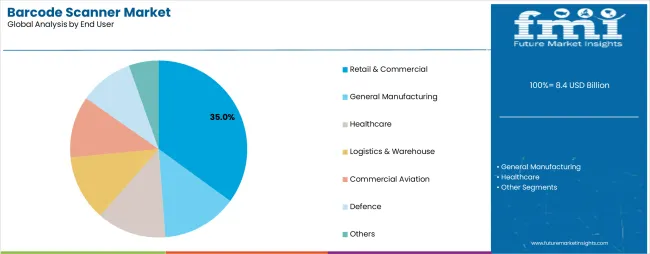
Retail & commercial applications dominate the barcode scanner market with approximately 35.0% market share in 2025, reflecting the critical role of point-of-sale systems and inventory management in driving automation demand and supporting efficient retail operations. The retail & commercial segment's market leadership is reinforced by increasing checkout automation requirements, standardized retail processes, and rising demand for real-time inventory tracking that directly correlates with operational efficiency and customer satisfaction.
The logistics & warehouse segment represents the second-largest end-user category, capturing significant market share through specialized requirements for high-volume scanning applications, automated sorting systems, and supply chain optimization operations. This segment benefits from growing demand for warehouse automation that meets efficiency, accuracy, and speed requirements in demanding operational applications.
The healthcare segment accounts for substantial market share, serving medical facilities requiring reliable asset tracking solutions. The general manufacturing segment captures market share through industrial applications, while others including commercial aviation and defence represent specialized market segments.
Key market dynamics supporting end-user growth include:
Laser scanner technology demonstrates strong performance in the barcode scanner market, driven by its proven reliability and widespread adoption across retail and industrial applications. The laser scanner segment's established position reflects the critical importance of accurate barcode reading, consistent performance characteristics, and cost-effective deployment across diverse operational environments, meeting operational requirements in commercial and industrial facilities.
Camera-based readers show growing momentum through advanced imaging capabilities and multi-dimensional scanning functionality, serving applications that require enhanced reading performance and versatility. This technology benefits from continuous advancement in imaging technology that provides superior reading capabilities for damaged or poorly printed barcodes.
The CCD readers segment maintains steady presence through reliable performance in close-range applications, while omnidirectional scanners provide hands-free operation benefits. Smartphone-based scanners represent emerging technology opportunities, and RFID-enabled systems continue expanding through advanced tracking capabilities and automated data collection systems.
Key factors supporting technology advancement include:
The market is driven by three concrete demand factors tied to operational efficiency and accuracy improvement outcomes. First, global retail automation and digital transformation create increasing demand for high-performance barcode scanning solutions, with global e-commerce projected to exceed USD 8 trillion by 2030, requiring advanced technology solutions for maximum operational efficiency. Second, modernization of inventory management systems and supply chain optimization drive the adoption of intelligent scanning technologies, with businesses seeking 95-99% improvement in data accuracy and operational efficiency enhancement.
Third, technological advancements in mobile integration and wireless connectivity enable more effective and versatile scanning solutions that reduce operational complexity while improving long-term performance and cost-effectiveness.
Market restraints include high initial capital investment that can impact project feasibility and return on investment calculations, particularly during periods of economic uncertainty or budget constraints affecting key technology adoption. System integration complexity poses another significant challenge, as achieving seamless operation across different business systems and legacy infrastructure requires specialized expertise and comprehensive planning systems, potentially causing implementation delays and increased deployment costs.
Technical support requirements in scanning system maintenance and optimization create additional challenges for businesses, demanding ongoing investment in training capabilities and compliance with varying industry operational standards.
Key trends indicate accelerated adoption in emerging markets, particularly China, India, and Brazil, where rapid retail expansion and logistics infrastructure development drive comprehensive barcode scanning system deployment.
Technology advancement trends toward AI integration with enhanced pattern recognition, mobile connectivity capabilities, and multi-functional scanning systems enable next-generation product development that addresses multiple operational requirements simultaneously. However, the market could face disruption if alternative identification technologies or significant changes in inventory management practices minimize reliance on traditional barcode scanning solutions.
| Country | CAGR (2025 to 2035) |
|---|---|
| United States | 7% |
| China | 6.8% |
| Germany | 6.2% |
| Japan | 5.9% |
| India | 5.7% |
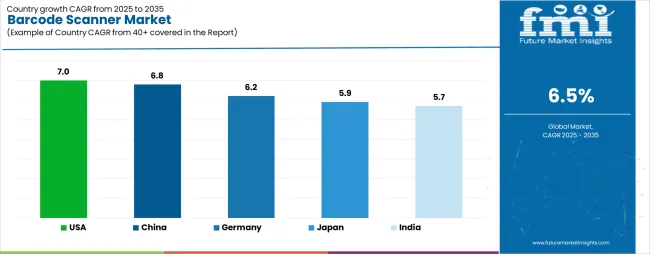
The barcode scanner market is gaining momentum worldwide, with the USA taking the lead thanks to comprehensive retail automation initiatives and advanced warehouse management systems, growing at a CAGR of 7.0%. Close behind, China benefits from rapid e-commerce expansion and manufacturing digitization programs, positioning itself as a strategic growth hub in the Asian region with a CAGR of 6.8%.
Germany shows steady advancement, where integration of Industry 4.0 technologies strengthens its role in the European automation and logistics development, reflecting a CAGR of 6.2%. Japan is focusing on technological innovation and operational efficiency optimization, signaling an ambition to capitalize on growing opportunities in advanced scanning technology markets with a CAGR of 5.9%.
Meanwhile, India stands out for its expanding retail infrastructure and digital transformation initiatives, recording consistent progress in automated inventory management adoption at a CAGR of 5.7%. Together, the USA and China anchor the global expansion story, while the rest build stability and diversity into the market's growth path.
The report covers an in-depth analysis of 40+ countries, the top-performing countries are highlighted below.
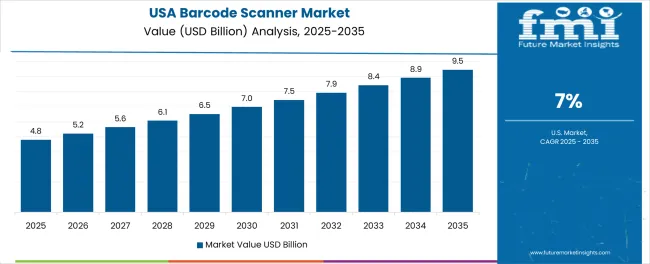
The United States demonstrates the strongest growth potential in the Barcode Scanner Market with a CAGR of 7.0% through 2035. The country's leadership position stems from comprehensive retail automation projects, government-backed digital infrastructure programs, and aggressive e-commerce optimization targets, driving the adoption of high-performance barcode scanning systems.
Growth is concentrated in major commercial regions, including California, Texas, New York, and Florida, where retailers and logistics companies are implementing advanced scanning solutions for enhanced operational performance and competitive advantage.
Distribution channels through established technology integrators and direct manufacturer relationships expand deployment across retail stores, warehouse facilities, and healthcare institutions. The country's technology leadership strategy provides policy support for automated systems development, including high-performance scanning platform adoption.
Key market factors:
In Beijing, Shanghai, Guangzhou, and Shenzhen, the adoption of barcode scanning systems is accelerating across retail facilities and manufacturing centers, driven by e-commerce growth targets and comprehensive industrial modernization initiatives.
The market demonstrates strong growth momentum with a CAGR of 6.8% through 2035, linked to comprehensive digital transformation programs and increasing focus on operational efficiency solutions. Chinese businesses are implementing advanced scanning systems and inventory management platforms to enhance operational performance while meeting growing consumer expectations in domestic and international markets.
The country's manufacturing excellence programs create demand for high-performance scanning solutions, while increasing emphasis on supply chain optimization drives adoption of advanced wireless technologies and mobile integration systems.
Germany's advanced manufacturing industry demonstrates sophisticated implementation of barcode scanning systems, with documented case studies showing efficiency improvements in industrial applications through optimized inventory management solutions.
The country's technology infrastructure in major industrial centers, including Bavaria, North Rhine-Westphalia, Baden-Württemberg, and Lower Saxony, showcases integration of advanced scanning technologies with existing production systems, leveraging expertise in precision engineering and automated manufacturing.
German manufacturers emphasize quality standards and operational reliability, creating demand for high-performance scanning solutions that support Industry 4.0 initiatives and regulatory requirements. The market maintains steady growth through focus on technological innovation and operational excellence, with a CAGR of 6.2% through 2035.
Key development areas:
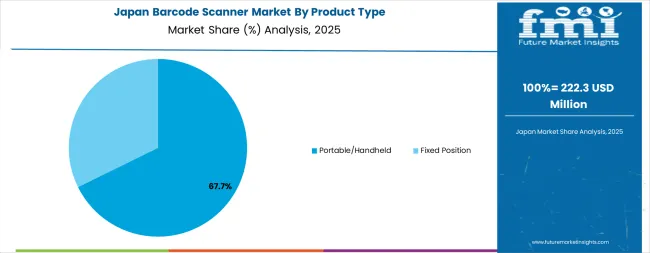
Japan's market expansion is driven by diverse retail applications, including scanning automation in Tokyo and Osaka regions, logistics development in Nagoya and Yokohama, and comprehensive technology modernization across multiple commercial areas. The country demonstrates promising growth potential with a CAGR of 5.9% through 2035, supported by national efficiency programs and regional innovation initiatives.
Japanese businesses face implementation challenges related to system integration and legacy infrastructure compatibility, requiring technology upgrade approaches and comprehensive support systems. However, growing operational efficiency targets and customer service requirements create compelling business cases for barcode scanning system adoption, particularly in retail and healthcare sectors where performance optimization has a direct impact on service quality.
Market characteristics:
India's market leads in retail infrastructure development based on integration with e-commerce expansion and digital payment systems for enhanced operational characteristics. The country shows solid potential with a CAGR of 5.7% through 2035, driven by retail modernization programs and digital transformation initiatives across major urban regions, including Maharashtra, Karnataka, Tamil Nadu, and Delhi. Indian retailers are adopting advanced scanning systems for inventory optimization and customer service enhancement, particularly in regions with organized retail expansion and modern supply chain facilities requiring superior operational efficiency. Technology deployment channels through established distributors and system integrators expand coverage across retail chains and logistics facilities.
Leading market segments:
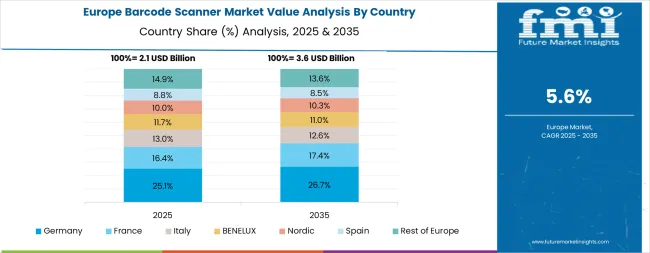
The barcode scanner market in Europe is projected to grow from USD 2.1 billion in 2025 to USD 3.8 billion by 2035, registering a CAGR of 6.1% over the forecast period. Germany is expected to maintain its leadership position with a 35.2% market share in 2025, declining slightly to 34.8% by 2035, supported by its extensive manufacturing infrastructure and major industrial centers, including Bavaria, North Rhine-Westphalia, and Baden-Württemberg technology hubs.
The United Kingdom follows with a 18.3% share in 2025, projected to reach 18.7% by 2035, driven by comprehensive retail modernization programs and advanced logistics initiatives implementing scanning technologies. France holds a 16.1% share in 2025, expected to maintain 15.8% by 2035 through ongoing retail automation and supply chain development.
Italy commands a 12.7% share, while Spain accounts for 9.2% in 2025. The Rest of Europe region is anticipated to gain momentum, expanding its collective share from 8.5% to 9.2% by 2035, attributed to increasing barcode scanner adoption in Nordic countries and emerging Eastern European retail markets implementing advanced inventory management programs.
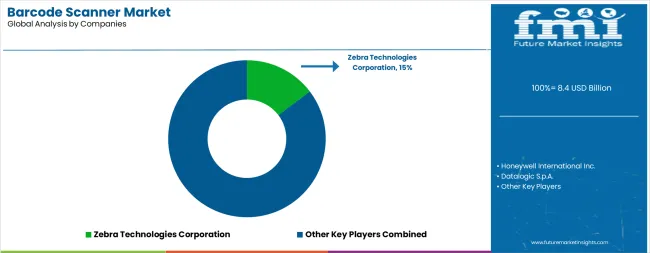
The barcode scanner market features approximately 20-25 meaningful players with moderate concentration, where the top three companies control roughly 35-40% of global market share through established technology platforms and extensive distribution relationships. Competition centers on technological innovation, product reliability, and comprehensive solution offerings rather than price competition alone.
Market leaders include Honeywell International Inc., Zebra Technologies Corporation, and Datalogic S.p.A., which maintain competitive advantages through comprehensive scanning solution portfolios, global service networks, and deep expertise in the data capture and automation sectors, creating high switching costs for customers. These companies leverage research and development capabilities and ongoing technical support relationships to defend market positions while expanding into adjacent IoT and mobile technology applications.
Challengers encompass Wasp Barcode Technologies and Symbol Technologies Inc., which compete through specialized scanning solutions and strong regional presence in key commercial markets. Technology specialists, including SATO Holdings Corporation, CipherLab Co. Ltd., and Microscan Systems Inc., focus on specific applications or vertical markets, offering differentiated capabilities in industrial scanning, mobile computing, and specialized data capture systems.
Regional players and emerging technology providers create competitive pressure through innovative solutions and rapid customization capabilities, particularly in high-growth markets including China, India, and Brazil, where local presence provides advantages in customer service and regulatory compliance. Market dynamics favor companies that combine advanced scanning technologies with comprehensive service offerings that address the complete solution lifecycle from system design through ongoing performance optimization.
Barcode scanners represent advanced technology solutions that enable businesses to achieve 95-99% improvement in data capture accuracy compared to manual systems, delivering superior operational performance and efficiency enhancement with enhanced speed capabilities in demanding retail and industrial applications.
With the market projected to grow from USD 8.4 billion in 2025 to USD 15.8 billion by 2035 at a 6.5% CAGR, these technology systems offer compelling advantages - enhanced operational accuracy, customizable scanning configurations, and real-time data integration - making them essential for retail facilities, logistics operations, and healthcare institutions seeking alternatives to manual data entry systems that compromise efficiency through human error and slower processing.
Scaling market adoption and technological advancement requires coordinated action across industry standards, technology development policies, equipment manufacturers, end-user industries, and automation infrastructure investment capital.
How Governments Could Spur Local Production and Adoption?
How Industry Bodies Could Support Market Development?
How OEMs and Technology Players Could Strengthen the Ecosystem?
How Suppliers Could Navigate the Shift?
How Investors and Financial Enablers Could Unlock Value?
| Items | Values |
|---|---|
| Quantitative Units | USD 8.4 billion |
| Product Type | Portable/Handheld (Rugged Scanners, PDA Scanners, Automatic Readers, Others), Fixed Position (Stationary Scanners, Presentation Scanners, Automatic Readers, Others) |
| End User | Retail & Commercial, General Manufacturing, Healthcare, Logistics & Warehouse, Commercial Aviation, Defence, Others |
| Technology | Pen Type Reader, Laser Scanner, CCD Readers, Camera-Based Reader, Omnidirectional Scanners, Smartphone-Based Scanner, RFID Technology |
| Regions Covered | North America, Latin America, Western Europe, Eastern Europe, East Asia, South Asia Pacific, Middle East & Africa |
| Country Covered | USA, China, Germany, Japan, India, and 40+ countries |
| Key Companies Profiled | Honeywell International Inc., Zebra Technologies Corporation, Datalogic S.p.A., Wasp Barcode Technologies, Symbol Technologies Inc., SATO Holdings Corporation, CipherLab Co. Ltd., Microscan Systems Inc. |
| Additional Attributes | Dollar sales by product type, end user, and technology categories, regional adoption trends across North America, East Asia, and Western Europe, competitive landscape with technology providers and system integrators, operational requirements and specifications, integration with retail automation initiatives and inventory management systems, innovations in scanning technology and connectivity solutions, and development of specialized configurations with accuracy and reliability capabilities. |
The global barcode scanner market is estimated to be valued at USD 8.4 billion in 2025.
The market size for the barcode scanner market is projected to reach USD 15.8 billion by 2035.
The barcode scanner market is expected to grow at a 6.5% CAGR between 2025 and 2035.
The key product types in barcode scanner market are portable/handheld and fixed position .
In terms of end user, retail & commercial segment to command 35.0% share in the barcode scanner market in 2025.


Our Research Products

The "Full Research Suite" delivers actionable market intel, deep dives on markets or technologies, so clients act faster, cut risk, and unlock growth.

The Leaderboard benchmarks and ranks top vendors, classifying them as Established Leaders, Leading Challengers, or Disruptors & Challengers.

Locates where complements amplify value and substitutes erode it, forecasting net impact by horizon

We deliver granular, decision-grade intel: market sizing, 5-year forecasts, pricing, adoption, usage, revenue, and operational KPIs—plus competitor tracking, regulation, and value chains—across 60 countries broadly.

Spot the shifts before they hit your P&L. We track inflection points, adoption curves, pricing moves, and ecosystem plays to show where demand is heading, why it is changing, and what to do next across high-growth markets and disruptive tech

Real-time reads of user behavior. We track shifting priorities, perceptions of today’s and next-gen services, and provider experience, then pace how fast tech moves from trial to adoption, blending buyer, consumer, and channel inputs with social signals (#WhySwitch, #UX).

Partner with our analyst team to build a custom report designed around your business priorities. From analysing market trends to assessing competitors or crafting bespoke datasets, we tailor insights to your needs.
Supplier Intelligence
Discovery & Profiling
Capacity & Footprint
Performance & Risk
Compliance & Governance
Commercial Readiness
Who Supplies Whom
Scorecards & Shortlists
Playbooks & Docs
Category Intelligence
Definition & Scope
Demand & Use Cases
Cost Drivers
Market Structure
Supply Chain Map
Trade & Policy
Operating Norms
Deliverables
Buyer Intelligence
Account Basics
Spend & Scope
Procurement Model
Vendor Requirements
Terms & Policies
Entry Strategy
Pain Points & Triggers
Outputs
Pricing Analysis
Benchmarks
Trends
Should-Cost
Indexation
Landed Cost
Commercial Terms
Deliverables
Brand Analysis
Positioning & Value Prop
Share & Presence
Customer Evidence
Go-to-Market
Digital & Reputation
Compliance & Trust
KPIs & Gaps
Outputs
Full Research Suite comprises of:
Market outlook & trends analysis
Interviews & case studies
Strategic recommendations
Vendor profiles & capabilities analysis
5-year forecasts
8 regions and 60+ country-level data splits
Market segment data splits
12 months of continuous data updates
DELIVERED AS:
PDF EXCEL ONLINE
In-Counter Barcode Scanners Market Size and Share Forecast Outlook 2025 to 2035
Industrial Barcode Scanners Market Analysis - Size and Share Forecast Outlook 2025 to 2035
Fixed 2D Industrial Barcode Scanner Market Size and Share Forecast Outlook 2025 to 2035
Barcode Printers & Consumables Market Growth - Trends & Forecast 2025 to 2035
Barcode Printers Market Growth - Trends & Forecast 2025 to 2035
Barcode Labeller Machine Market
Barcode Label Market
2D Barcode Reader Market Size and Share Forecast Outlook 2025 to 2035
3D Scanners Market Size and Share Forecast Outlook 2025 to 2035
UK Barcode Printer Market Analysis – Demand, Growth & Forecast 2025-2035
DXA Scanner Market Size and Share Forecast Outlook 2025 to 2035
USA Barcode Printer Market Trends – Size, Share & Industry Growth 2025-2035
ASEAN Barcode Printer Market Insights – Size, Share & Industry Growth 2025-2035
Japan Barcode Printer Market Growth – Innovations, Trends & Forecast 2025-2035
Vehicle Scanner Market Size and Share Forecast Outlook 2025 to 2035
Mineral Scanner Market Size and Share Forecast Outlook 2025 to 2035
Baggage Scanner Market Growth, Trends & Forecast 2025 to 2035
Germany Barcode Printer Market Analysis – Growth, Applications & Outlook 2025-2035
Thermal Scanner Market Growth – Trends & Forecast 2020-2030
3D Laser Scanner Market Growth - Trends & Forecast 2025 to 2035

Thank you!
You will receive an email from our Business Development Manager. Please be sure to check your SPAM/JUNK folder too.
Chat With
MaRIA