Reports

- Global Locations -

Headquarters

Future Market Insights, Inc.

Christiana Corporate, 200
Continental Drive, Suite 401,
Newark, Delaware - 19713,
United States

T: +1-845-579-5705

Americas

Future Market Insights, Inc.

616 Corporate Way, Suite 2-9018,
Valley Cottage, NY 10989, United States

T: +1-347-918-3531

MEA

Future Market Insights

1602-6 Jumeirah Bay X2 Tower, Plot No: JLT-PH2-X2A,
Jumeirah Lakes Towers, Dubai,
United Arab Emirates

Europe

Future Market Insights

3rd Floor, 207 Regent Street,
W1B 3HH London
United Kingdom

T: + 44 (0) 20 8123 9659
D: +44 (0) 20 3287 4268

Asia Pacific

Future Market Insights

IndiaLand Global Tech Park, Unit UG-1, Behind Grand HighStreet, Phase 1, Hinjawadi, MH, Pune – 411057, India

In-Counter Barcode Scanners Market Outlook (2022 to 2032)

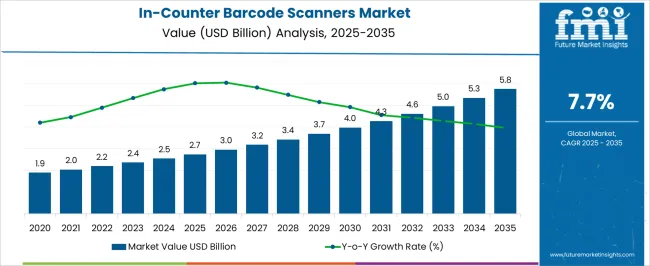
The global in-counter barcode scanners market size is expected to be valued at US$ 2,194.5 Million in 2022. With growing penetration of e-commerce and simplification of payment routes, coupled with streamlining of warehouse inventory and growing presence in public distribution systems, are factors for overall demand for in-counter barcode scanners is projected to grow at a CAGR of 7.7% between 2022 and 2032, totaling around US$ 4,587.9 Million by 2032.

Data Points Key Statistics
In-counter barcode scanners Market Value 2022 US$ 2194.5 Million
In-counter barcode scanners Market Projected Value (2032) US$ 4587.9 Million
In-counter barcode scanners Market CAGR (2022 to 2032) 7.7%

In-Counter Barcode Scanners Market growth is on an upswing with almost all retail outlets employing bar-code scanners in authenticating sales of products purchased. Almost all products carry nowadays the bar code on them, are printed on them, and are read or scanned by bar-code scanners. Thus there is no dearth of in-counter bar-code scanners in retail outlets which amply bolsters product growth.

The growth of the best QR code scanner is also promptly ascertained with its state-of-the-art features and appended technological features that act in favor of the product.

Don't pay for what you don't need

Customize your report by selecting specific countries or regions and save 30%!

In-Counter Barcode Scanners Demand Analysis (2016 to 2021) Vs Market Outlook (2022 to 2032)

There is a spate of improvements taking place on the product front in favor of bar-code scanners that keep it abreast of supply and product tracking thus adding to its popularity. Almost all products coming into the market have barcodes printed on them, paving the way for scanners to do the rest. With mobile penetration, the bar-code scanners make the check-out process acutely simple and hence are on a fast track to growth.

Today, in-counter barcode scanners are being heavily depended on for recording and managing product information without making any major manual effort. In-counter barcode scanners are also used to make quick check-outs at cash counters, for easy and precise account keeping, and for better inventory control for manufacturers and retailers.

The escalating need for reducing human errors in terms of keeping track of the inventory may serve as an important growth factor for the barcode readers market.

Which Drivers underpin In-Counter Barcode Scanners Industry Expansion?

Public Distribution Systems are orienting at a fast growth rate in the in-counter barcode scanners market

The fast emerging technologies in the public distribution system are the primary growth drivers in the in-counter bar-code scanners market. Public distribution systems across various countries are also implementing barcode readers, thus boosting the growth prospects of the barcode readers market. A paramount growth factor for industries to rely on handheld scanners in remote settings is fuelling product development.

With the logistics arm of many multinational service providers working in the foreground, the growth of the in-counter bar code scanners market takes on immense proportions. In this errors are minimized grossly, and product inventory is on-track with infinite time savings, thus giving to the growth of the in-counter barcode scanners market.

The flourishing e-commerce sector may also enjoy expansive growth opportunities for the barcode readers market. Penetration of advanced technology such as AI (Artificial Intelligence) may help the barcode readers market to harness surplus growth

Sudip Saha
Sudip Saha

Principal Consultant

Talk to Analyst

Find your sweet spots for generating winning opportunities in this market.

Which Factors are limiting the Growth of In-counter barcode scanners Market?

The significant cost of in-counter barcode scanners deterrent to market growth

The cost of in-counter barcode scanners does not help the growth of the market which acts as a market restraint coupled with its immobility, which makes a dent in the progress of the in-counter barcode scanners market. Furthermore, the lack of awareness among a considerable populace is also a prominent growth obstacle that may dampen the growth of the barcode readers market.

Any task from point of sale to backroom inventory is streamlined when associates have full-shift battery power, can read multiple codes at once, and are provided actionable insights to resolve issues faster. Scale this new scanning experience easily with remote fleet management and ongoing support from experts in the field.

The growing preference for online shopping and the concurrent growth in e-commerce and logistics is expected to drive the growth of the market.

Businesses in several industries and industry verticals, including retail and manufacturing, are steadfastly using barcodes and allied systems to keep a check on inventory and follow individual products or product batches remotely in a large facility. Thus, a barcode scanner becomes a vital component for decoding and interpreting the data stored by the barcode. Barcode scanners ensure transparent inventory control management with accuracy paramount.
Region-wise Insights

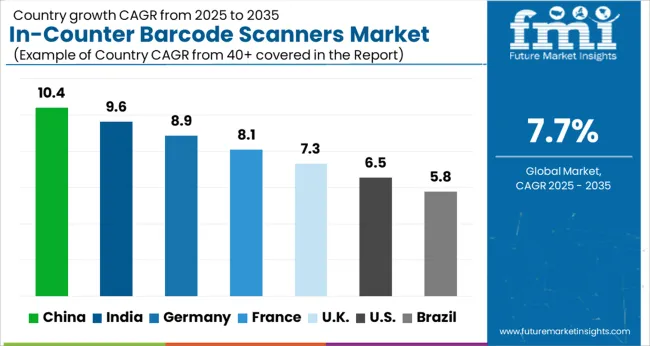
Will North America Continue Dominance in the Global In-counter barcode scanners market?

North American adoption of Public distribution system is rapid and instrumental to the growth

On a geographic basis, North America will be the largest market for In-counter barcode scanners market due to the rapid adoption of advanced technologies in the public distribution system.

E-commerce growth in North America has a robust flavor, particularly in the USA, due to a large number of Internet-abound shoppers there, as well as the world's prolific technical experts. The North American e-commerce boom has experienced an unprecedented level of funding, available from a variety of sources. Moreover, many analysts believed that the time savings offered by shopping online appealed to USA residents, who were considered more time conscious than individuals in other parts of the world, such as Europe or Asia.
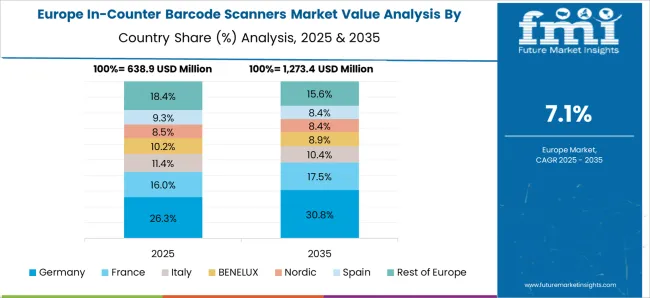
How Will Growth unfold in the European In-counter barcode scanners market?

Europe's e-commerce industry growing at a fearsome pace to stake a claim in the in-counter barcode scanners market

Europe’s e-commerce industry is expanding at a fiery pace. Business to Business (B2B) dominated the e-commerce growth industry in Europe in terms of revenue in 2019, with an enormous share in the range of 60 to 70 % percent, and is predicted to grow at the quickest rate in the forecast period. This can be due to businesses' increasing preference for online selling and purchasing of goods and services. Furthermore, the B2B e-commerce segment is expected to be driven by increased smartphone adoption and internet usage over the projection period. This provides explosive growth for the in-counter barcode scanners market.

Banks and other e-commerce businesses are mandating a safe and secure online platform for customers to transact with a payment gateway. In order to enable sellers and customers to trade online, market players are focusing on making innovative improvements to their business modules. The market's top retailers are attempting to supplement their traditional selling with e-commerce by partnering with other significant e-commerce companies. This brings the in-counter barcode scanners market into significant growth.

Get the data you need at a Fraction of the cost

Personalize your report by choosing insights you need
and save 40%!

Category-wise Insights

By Product Type, which In-counter barcode scanners category will remain prominent?

Warehousing segment to display linear growth in the industry with importance to streamlining of processes

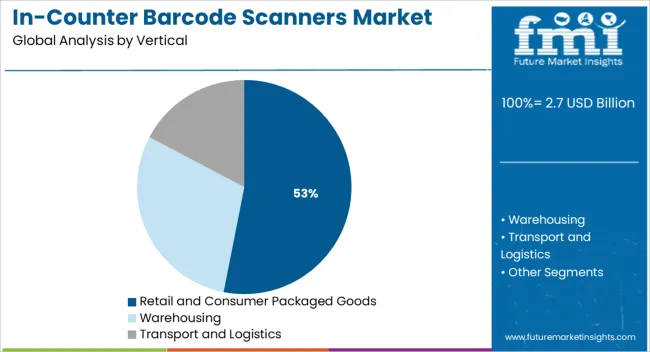
The warehousing segment in the in-counter barcode scanner industry is expected to post impressive figures in its development. Even the smallest of retail companies will need to rely on the technology of some kind to streamline their warehouse processes. The larger you grow - and the faster the rate - the more vital your technology stack becomes.

Depending on your individual needs, you’ll likely want to invest in some level of heavy-duty equipment and machinery to better enable your warehouse team to physically move, store, and deliver products. As your inventory grows - and your warehouse processes grow more complex - you’ll also want to invest in technology that allows you to easily track your products from receipt to delivery. Here the in-counter barcode scanner has a large role to play.

The Start-up Ecosystem How key Players are opening Frontiers for Future Growth?

Manufacturers are adopting various marketing strategies such as new product launches, geographical expansion, mergers and acquisitions, partnerships, and collaboration to identify the interest of potential buyers and create a larger customer base. For instance,

In Jul 2022, Socket Mobile Announces SocketScan S720, Linear Barcode Plus QR Code Reader. Socket Mobile, Inc. a leading provider of data capture and delivery solutions designed to streamline workplace productivity, is excited to announce the launch of their linear barcode and QR code reader, SocketScan S720. Socket Mobile is continuously inventing to provide data capture solutions that meet or expect altering market needs.

Who are the Leading Players in In-Counter Barcode Scanners Market?

The prominent players in the In-counter barcode scanners market are Honeywell International Inc., Zebra Technologies Corporation, Cognex Corporation, SATO Holdings Corporation, Toshiba TEC Corporation, Wasp Barcode Technologies, Datalogic S.P.A, Scandit AG, and others.

  • In June 2022, Zebra Technologies Corporation, an innovator at the front line of business with solutions and partners that deliver a performance edge, today announced it has completed its acquisition of Matrox Imaging (Matrox Electronic Systems Ltd.), a proven developer of advanced machine vision components, software, and systems. This acquisition further expands Zebra’s offerings in the fast-growing automation and vision technology solution space following the launch of its fixed industrial scanning and machine vision portfolio and recent acquisitions of Adaptive Vision and Fetch Robotics.
  • In November 2020, Datalogic S.p.A. announced the launch of the new Gryphon 4200 linear imager series. The new product is ideal for healthcare applications, retail POS checkout, ticketing, entertainment access control, order processing, and manufacturing work-in-progress applications.

Report Scope

Report Attribute Details
Growth Rate CAGR of 6.5% from 2022 to 2032
Market Value in 2022 US$ 2194.5 Million
Market Value in 2032 US$ 4587.9 Million
Base Year for Estimation 2021
Historical Data 2016 to 2021
Forecast Period 2022 to 2032
Quantitative Units Revenue in US$ Million and CAGR from 2022 to 2032
Report Coverage Revenue Forecast, Company Ranking, Competitive Landscape, Growth Factors, Trends, and Pricing Analysis
Segments Covered
  • Vertical
  • Region
Regions Covered
  • North America
  • Latin America
  • Europe
  • Asia Pacific
  • Middle East and Africa
Key Countries Profiled
  • United States of America
  • Canada
  • Brazil
  • Mexico
  • Germany
  • United Kingdom
  • France
  • Italy
  • China
  • India
  • Japan
  • ASIAN
  • GCC Countries
  • South Africa
Key Companies Profiled
  • Honeywell International Inc.
  • Zebra Technologies Corporation
  • Cognex Corporation
  • SATO Holdings Corporation
  • Toshiba TEC Corporation
  • Wasp Barcode Technologies
  • Datalogic S.P.A
  • Scandit AG

Key Segments Covered in the In-Counter Barcode Scanners Industry Report

By Vertical:

  • Retail and Consumer Packaged Goods
  • Warehousing
  • Transport and Logistics

By Region:

  • North America
  • Latin America
  • Europe
  • Asia Pacific
  • Middle East and Africa

Frequently Asked Questions

What is the expected market value for in-counter barcode scanners in 2022?

As of 2022, the in-counter barcode scanners market is slated to reach a valuation of US$ 2194.5 Million

At what rate will the in-counter barcode scanners market flourish from 2022 to 2032?

From 2022 to 2032, sales of in-counter barcode scanners are expected to grow at a 6.5% CAGR

What is the expected market value for in-counter barcode scanners in 2032?

By 2032, Future Market Insights expects the in-counter barcode scanners market to reach US$ 4587.9 Million

Table of Content

1. Executive Summary | In-Counter Barcode Scanners Market

    1.1. Global Market Snapshot

    1.2. Key Market Trends

    1.3. Current Market & Future Potential

    1.4. FMI Recommendations

2. Market Overview

    2.1. Market Segmentation

    2.2. Market Indicators

    2.3. Market Definitions

    2.4. Market Dynamics

        2.4.1. Drivers

        2.4.2. Restraints

        2.4.3. Opportunities

    2.5. Porter’s Five Forces Analysis

    2.6. Value Chain Analysis

        2.6.1. List of Potential Customers

    2.7. Global Market Analysis and Forecast, 2022 to 2032

3. Market Outlook, by Region

4. Market Trend Analysis, 2022 to 2032

    4.1. By Region

5. Global Market Analysis and Forecast, by Vertical, 2022 to 2032

    5.1. Introduction & Definitions

    5.2. Global Market Value (Million) Forecast, by Vertical, 2022 to 2032

        5.2.1. Retail and Consumer Packaged Goods

        5.2.2. Warehousing

        5.2.3. Transport and Logistics

    5.3. Global Market Attractiveness, by Vertical

6. Global Market Analysis and Forecast, by Region, 2022 to 2032

    6.1. Key Findings

    6.2. Global Market Value (Million) Forecast, by Region, 2022 to 2032

        6.2.1. North America

        6.2.2. Europe

        6.2.3. Asia Pacific

        6.2.4. Middle East & Africa

        6.2.5. Latin America

    6.3. Global Market Attractiveness, by Region

7. North America Market Analysis and Forecast, 2022 to 2032

    7.1. Key Findings

    7.2. North America Market Value (Million) Forecast, by Vertical, 2022 to 2032

    7.3. North America Market Value (Million) Analysis, 2022 to 2032

        7.3.1. United States of America Market Value (Million) Forecast, by Vertical, 2022 to 2032

        7.3.2. United States of America Market Value (Million) Analysis, 2022 to 2032

        7.3.3. Canada Market Value (Million) Forecast, by Vertical, 2022 to 2032

        7.3.4. Canada Market Value (Million) Analysis, 2022 to 2032

    7.4. North America Market Attractiveness Analysis

8. Europe Market Analysis and Forecast, 2022 to 2032

    8.1. Key Findings

    8.2. Europe Market Value (Million) Forecast, by Vertical, 2022 to 2032

    8.3. Europe Market Value (Million) Analysis, 2022 to 2032

        8.3.1. Germany Market Value (Million) Forecast, by Vertical, 2022 to 2032

        8.3.2. Germany Market Value (Million) Analysis, 2022 to 2032

        8.3.3. France Market Value (Million) Forecast, by Vertical, 2022 to 2032

        8.3.4. France Market Value (Million) Analysis, 2022 to 2032

        8.3.5. United Kingdom Market Value (Million) Forecast, by Vertical, 2022 to 2032

        8.3.6. United Kingdom Market Value (Million) Analysis, 2022 to 2032

        8.3.7. Italy Market Value (Million) Forecast, by Vertical, 2022 to 2032

        8.3.8. Italy Market Value (Million) Analysis, 2022 to 2032

        8.3.9. Rest of Europe Market Value (Million) Forecast, by Vertical, 2022 to 2032

        8.3.10. Rest of Europe Market Value (Million) Analysis, 2022 to 2032

    8.4. Europe Market Attractiveness Analysis

9. Asia Pacific Market Analysis and Forecast, 2022 to 2032

    9.1. Key Findings

    9.2. Asia Pacific Market Value (Million) Forecast, by Vertical, 2022 to 2032

    9.3. Asia Pacific Market Value (Million) Analysis, 2022 to 2032

        9.3.1. China Market Value (Million) Forecast, by Vertical, 2022 to 2032

        9.3.2. China Market Value (Million) Analysis, 2022 to 2032

        9.3.3. India Market Value (Million) Forecast, by Vertical, 2022 to 2032

        9.3.4. India Market Value (Million) Analysis, 2022 to 2032

        9.3.5. Japan Market Value (Million) Forecast, by Vertical, 2022 to 2032

        9.3.6. Japan Market Value (Million) Analysis, 2022 to 2032

        9.3.7. ASEAN Market Value (Million) Forecast, by Vertical, 2022 to 2032

        9.3.8. ASEAN Market Value (Million) Analysis, 2022 to 2032

        9.3.9. Rest of Asia Pacific Market Value (Million) Forecast, by Vertical, 2022 to 2032

        9.3.10. Rest of Asia Pacific Market Value (Million) Analysis, 2022 to 2032

    9.4. Asia Pacific Market Attractiveness Analysis

10. Latin America Market Analysis and Forecast, 2022 to 2032

    10.1. Key Findings

    10.2. Latin America Market Value (Million) Forecast, by Vertical, 2022 to 2032

    10.3. Latin America Market Value (Million) Analysis, 2022 to 2032

        10.3.1. Brazil Market Value (Million) Forecast, by Vertical, 2022 to 2032

        10.3.2. Brazil Market Value (Million) Analysis, 2022 to 2032

        10.3.3. Mexico Market Value (Million) Forecast, by Vertical, 2022 to 2032

        10.3.4. Mexico Market Value (Million) Analysis, 2022 to 2032

        10.3.5. Rest of Latin America Market Value (Million) Forecast, by Vertical, 2022 to 2032

        10.3.6. Rest of Latin America Market Value (Million) Analysis, 2022 to 2032

    10.4. Latin America Market Attractiveness Analysis

11. Middle East & Africa Market Analysis and Forecast, 2022 to 2032

    11.1. Key Findings

    11.2. Middle East & Africa Market Value (Million) Forecast, by Vertical, 2022 to 2032

    11.3. Middle East & Africa Market Value (Million) Analysis, 2022 to 2032

        11.3.1. GCC Countries Market Value (Million) Forecast, by Vertical, 2022 to 2032

        11.3.2. GCC Countries Market Value (Million) Analysis, 2022 to 2032

        11.3.3. South Africa Market Value (Million) Forecast, by Vertical, 2022 to 2032

        11.3.4. South Africa Market Value (Million) Analysis, 2022 to 2032

        11.3.5. Rest of Middle East & Africa Market Value (Million) Forecast, by Vertical, 2022 to 2032

        11.3.6. Rest of Middle East & Africa Market Value (Million) Analysis, 2022 to 2032

    11.4. Middle East & Africa Market Attractiveness Analysis

12. Competition Landscape

    12.1. Global Market Share Analysis, by Company (2020)

    12.2. Competition Matrix

        12.2.1. Vertical Mapping

    12.3. Company Profiles (Details - Overview, Financials, Recent Developments, and Strategy)

        12.3.1. Bobcat

            12.3.1.1. Headquarters, Year of Establishment, Revenue, Key Management, Number of Employees

            12.3.1.2. Company Description

            12.3.1.3. Business Overview

            12.3.1.4. Financial Overview

            12.3.1.5. Strategic Overview

        12.3.2. AGCO Corporation

            12.3.2.1. Headquarters, Year of Establishment, Revenue, Key Management, Number of Employees

            12.3.2.2. Company Description

            12.3.2.3. Business Overview

            12.3.2.4. Financial Overview

            12.3.2.5. Strategic Overview

        12.3.3. John Deere

            12.3.3.1. Headquarters, Year of Establishment, Revenue, Key Management, Number of Employees

            12.3.3.2. Company Description

            12.3.3.3. Business Overview

            12.3.3.4. Financial Overview

            12.3.3.5. Strategic Overview

        12.3.4. Case IH

            12.3.4.1. Headquarters, Year of Establishment, Revenue, Key Management, Number of Employees

            12.3.4.2. Company Description

            12.3.4.3. Business Overview

            12.3.4.4. Financial Overview

            12.3.4.5. Strategic Overview

        12.3.5. Yanmar

            12.3.5.1. Headquarters, Year of Establishment, Revenue, Key Management, Number of Employees

            12.3.5.2. Company Description

            12.3.5.3. Business Overview

            12.3.5.4. Financial Overview

            12.3.5.5. Strategic Overview

        12.3.6. D Robotix

            12.3.6.1. Headquarters, Year of Establishment, Revenue, Key Management, Number of Employees

            12.3.6.2. Company Description

            12.3.6.3. Business Overview

            12.3.6.4. Financial Overview

            12.3.6.5. Strategic Overview

        12.3.7. Agribotix

            12.3.7.1. Headquarters, Year of Establishment, Revenue, Key Management, Number of Employees

            12.3.7.2. Company Description

            12.3.7.3. Business Overview

            12.3.7.4. Financial Overview

            12.3.7.5. Strategic Overview

        12.3.8. ADAMA Agricultural Solution Ltd.

            12.3.8.1. Headquarters, Year of Establishment, Revenue, Key Management, Number of Employees

            12.3.8.2. Company Description

            12.3.8.3. Business Overview

            12.3.8.4. Financial Overview

            12.3.8.5. Strategic Overview

        12.3.9. Mahindra

            12.3.9.1. Headquarters, Year of Establishment, Revenue, Key Management, Number of Employees

            12.3.9.2. Company Description

            12.3.9.3. Business Overview

            12.3.9.4. Financial Overview

            12.3.9.5. Strategic Overview

        12.3.10. Rowbot

            12.3.10.1. Headquarters, Year of Establishment, Revenue, Key Management, Number of Employees

            12.3.10.2. Company Description

            12.3.10.3. Business Overview

            12.3.10.4. Financial Overview

            12.3.10.5. Strategic Overview

        12.3.11. Clearpath Robotics

            12.3.11.1. Headquarters, Year of Establishment, Revenue, Key Management, Number of Employees

            12.3.11.2. Company Description

            12.3.11.3. Business Overview

            12.3.11.4. Financial Overview

            12.3.11.5. Strategic Overview

13. Assumptions & Acronyms Used

14. Research Methodology

List of Tables

Table 1: Global Market Value (Million) Forecast, by Vertical, 2022 to 2032

Table 2: Global Market Value (Million) Forecast, by Vertical, 2022 to 2032

Table 3: Global Market Value (Million) Analysis, 2022 to 2032

Table 4: Global Market Value (Million) Analysis, 2022 to 2032

Table 5: Global Market Value (Million) Forecast, by Region, 2022 to 2032

Table 6: Global Market Value (Million) Forecast, by Region, 2022 to 2032

Table 7: North America Market Value (Million) Forecast, by Vertical, 2022 to 2032

Table 8: North America Market Value (Million) Forecast, by Vertical, 2022 to 2032

Table 9: North America Market Value (Million) Analysis, 2022 to 2032

Table 10: North America Market Value (Million) Analysis, 2022 to 2032

Table 11: North America Market Value (Million) Forecast, by Country, 2022 to 2032

Table 12: North America Market Value (Million) Forecast, by Country, 2022 to 2032

Table 13: United States of America Market Value (Million) Forecast, by Vertical, 2022 to 2032

Table 14: United States of America Market Value (Million) Forecast, by Vertical, 2022 to 2032

Table 15: United States of America Market Value (Million) Analysis, 2022 to 2032

Table 16: United States of America Market Value (Million) Analysis, 2022 to 2032

Table 17: Canada Market Value (Million) Forecast, by Vertical, 2022 to 2032

Table 18: Canada Market Value (Million) Forecast, by Vertical, 2022 to 2032

Table 19: Canada Market Value (Million) Analysis, 2022 to 2032

Table 20: Canada Market Value (Million) Analysis, 2022 to 2032

Table 21: Europe Market Value (Million) Forecast, by Vertical, 2022 to 2032

Table 22: Europe Market Value (Million) Forecast, by Vertical, 2022 to 2032

Table 23: Europe Market Value (Million) Analysis, 2022 to 2032

Table 24: Europe Market Value (Million) Analysis, 2022 to 2032

Table 25: Europe Market Value (Million) Forecast, by Country and Sub-region, 2022 to 2032

Table 26: Europe Market Value (Million) Forecast, by Country and Sub-region, 2022 to 2032

Table 27: Germany Market Value (Million) Forecast, by Vertical, 2022 to 2032

Table 28: Germany Market Value (Million) Forecast, by Vertical, 2022 to 2032

Table 29: Germany Market Value (Million) Analysis, 2022 to 2032

Table 30: Germany Market Value (Million) Analysis, 2022 to 2032

Table 31: United Kingdom Market Value (Million) Forecast, by Vertical, 2022 to 2032

Table 32: United Kingdom Market Value (Million) Forecast, by Vertical, 2022 to 2032

Table 33: United Kingdom Market Value (Million) Analysis, 2022 to 2032

Table 34: United Kingdom Market Value (Million) Analysis, 2022 to 2032

Table 35: France Market Value (Million) Forecast, by Vertical, 2022 to 2032

Table 36: France Market Value (Million) Forecast, by Vertical, 2022 to 2032

Table 37: France Market Value (Million) Analysis, 2022 to 2032

Table 38: France Market Value (Million) Analysis, 2022 to 2032

Table 39: Italy Market Value (Million) Forecast, by Vertical, 2022 to 2032

Table 40: Italy Market Value (Million) Forecast, by Vertical, 2022 to 2032

Table 41: Italy Market Value (Million) Analysis, 2022 to 2032

Table 42: Italy Market Value (Million) Analysis, 2022 to 2032

Table 43: Spain Market Value (Million) Forecast, by Vertical, 2022 to 2032

Table 44: Spain Market Value (Million) Forecast, by Vertical, 2022 to 2032

Table 45: Spain Market Value (Million) Analysis, 2022 to 2032

Table 46: Spain Market Value (Million) Analysis, 2022 to 2032

Table 47: Russia & CIS Market Value (Million) Forecast, by Vertical, 2022 to 2032

Table 48: Russia & CIS Market Value (Million) Forecast, by Vertical, 2022 to 2032

Table 49: Russia & CIS Market Value (Million) Analysis, 2022 to 2032

Table 50: Russia & CIS Market Value (Million) Analysis, 2022 to 2032

Table 51: Rest of Europe Market Value (Million) Forecast, by Vertical, 2022 to 2032

Table 52: Rest of Europe Market Value (Million) Forecast, by Vertical, 2022 to 2032

Table 53: Rest of Europe Market Value (Million) Analysis, 2022 to 2032

Table 54: Rest of Europe Market Value (Million) Analysis, 2022 to 2032

Table 55: Asia Pacific Market Value (Million) Forecast, by Vertical, 2022 to 2032

Table 56: Asia Pacific Market Value (Million) Forecast, by Vertical, 2022 to 2032

Table 57: Asia Pacific Market Value (Million) Analysis, 2022 to 2032

Table 58: Asia Pacific Market Value (Million) Analysis, 2022 to 2032

Table 59: Asia Pacific Market Value (Million) Forecast, by Country and Sub-region, 2022 to 2032

Table 60: Asia Pacific Market Value (Million) Forecast, by Country and Sub-region, 2022 to 2032

Table 61: China Market Value (Million) Forecast, by Vertical, 2022 to 2032

Table 62: China Market Value (Million) Forecast, by Vertical, 2022 to 2032

Table 63: China Market Value (Million) Analysis, 2022 to 2032

Table 64: China Market Value (Million) Analysis, 2022 to 2032

Table 65: Japan Market Value (Million) Forecast, by Vertical, 2022 to 2032

Table 66: Japan Market Value (Million) Forecast, by Vertical, 2022 to 2032

Table 67: Japan Market Value (Million) Analysis, 2022 to 2032

Table 68: Japan Market Value (Million) Analysis, 2022 to 2032

Table 69: India Market Value (Million) Forecast, by Vertical, 2022 to 2032

Table 70: India Market Value (Million) Forecast, by Vertical, 2022 to 2032

Table 71: India Market Value (Million) Analysis, 2022 to 2032

Table 72: India Market Value (Million) Analysis, 2022 to 2032

Table 73: ASEAN Market Value (Million) Forecast, by Vertical, 2022 to 2032

Table 74: ASEAN Market Value (Million) Forecast, by Vertical, 2022 to 2032

Table 75: ASEAN Market Value (Million) Analysis, 2022 to 2032

Table 76: ASEAN Market Value (Million) Analysis, 2022 to 2032

Table 77: Rest of Asia Pacific Market Value (Million) Forecast, by Vertical, 2022 to 2032

Table 78: Rest of Asia Pacific Market Value (Million) Forecast, by Vertical, 2022 to 2032

Table 79: Rest of Asia Pacific Market Value (Million) Analysis, 2022 to 2032

Table 80: Rest of Asia Pacific Market Value (Million) Analysis, 2022 to 2032

Table 81: Latin America Market Value (Million) Forecast, by Vertical, 2022 to 2032

Table 82: Latin America Market Value (Million) Forecast, by Vertical, 2022 to 2032

Table 83: Latin America Market Value (Million) Analysis, 2022 to 2032

Table 84: Latin America Market Value (Million) Analysis, 2022 to 2032

Table 85: Latin America Market Value (Million) Forecast, by Country and Sub-region, 2022 to 2032

Table 86: Latin America Market Value (Million) Forecast, by Country and Sub-region, 2022 to 2032

Table 87: Brazil Market Value (Million) Forecast, by Vertical, 2022 to 2032

Table 88: Brazil Market Value (Million) Forecast, by Vertical, 2022 to 2032

Table 89: Brazil Market Value (Million) Analysis, 2022 to 2032

Table 90: Brazil Market Value (Million) Analysis, 2022 to 2032

Table 91: Mexico Market Value (Million) Forecast, by Vertical, 2022 to 2032

Table 92: Mexico Market Value (Million) Forecast, by Vertical, 2022 to 2032

Table 93: Mexico Market Value (Million) Analysis, 2022 to 2032

Table 94: Mexico Market Value (Million) Analysis, 2022 to 2032

Table 95: Rest of Latin America Market Value (Million) Forecast, by Vertical, 2022 to 2032

Table 96: Rest of Latin America Market Value (Million) Forecast, by Vertical, 2022 to 2032

Table 97: Rest of Latin America Market Value (Million) Analysis, 2022 to 2032

Table 98: Rest of Latin America Market Value (Million) Analysis, 2022 to 2032

Table 99: Middle East & Africa Market Value (Million) Forecast, by Vertical, 2022 to 2032

Table 100: Middle East & Africa Market Value (Million) Forecast, by Vertical, 2022 to 2032

Table 101: Middle East & Africa Market Value (Million) Analysis, 2022 to 2032

Table 102: Middle East & Africa Market Value (Million) Analysis, 2022 to 2032

Table 103: Middle East & Africa Market Value (Million) Forecast, by Country and Sub-region, 2022 to 2032

Table 104: Middle East & Africa Market Value (Million) Forecast, by Country and Sub-region, 2022 to 2032

Table 105: GCC Countries Market Value (Million) Forecast, by Vertical, 2022 to 2032

Table 106: GCC Countries Market Value (Million) Forecast, by Vertical, 2022 to 2032

Table 107: GCC Countries Market Value (Million) Analysis, 2022 to 2032

Table 108: GCC Countries Market Value (Million) Analysis, 2022 to 2032

Table 109: South Africa Market Value (Million) Forecast, by Vertical, 2022 to 2032

Table 110: South Africa Market Value (Million) Forecast, by Vertical, 2022 to 2032

Table 111: South Africa Market Value (Million) Analysis, 2022 to 2032

Table 112: South Africa Market Value (Million) Analysis, 2022 to 2032

Table 113: Rest of Middle East & Africa Market Value (Million) Forecast, by Vertical, 2022 to 2032

Table 114: Rest of Middle East & Africa Market Value (Million) Forecast, by Vertical, 2022 to 2032

Table 115: Rest of Middle East & Africa Market Value (Million) Analysis, 2022 to 2032

Table 116: Rest of Middle East & Africa Market Value (Million) Analysis, 2022 to 2032

List of Charts

Figure 1: Global Market Price Trend, by Region, 2022 to 2032 (US$/Ton)

Figure 2: Global Market Value Share, by Vertical, 2020, 2026, and 2031

Figure 3: Global Market Attractiveness, by Vertical

Figure 4: Global Market Value Share, Analysis, 2020, 2026, and 2031

Figure 5: Global Market Attractiveness, Analysis

Figure 6: Global Market Value Share, by Region, 2020, 2026, and 2031

Figure 7: Global Market Attractiveness, by Region

Figure 8: North America Market Value Share, by Vertical, 2020, 2026, and 2031

Figure 9: North America Market Attractiveness, by Vertical

Figure 10: North America Market Value Share, Analysis, 2020, 2026, and 2031

Figure 11: North America Market Attractiveness, Analysis

Figure 12: North America Market Value Share, by Country, 2020, 2026, and 2031

Figure 13: North America Market Attractiveness, by Country

Figure 14: Europe Market Value Share, by Vertical, 2020, 2026, and 2031

Figure 15: Europe Market Attractiveness, by Vertical

Figure 16: Europe Market Value Share, Analysis, 2020, 2026, and 2031

Figure 17: Europe Market Attractiveness, Analysis

Figure 18: Europe Market Value Share, by Country and Sub-region, 2020, 2026, and 2031

Figure 19: Europe Market Attractiveness, by Country and Sub-region

Figure 20: Asia Pacific Market Value Share, by Vertical, 2020, 2026, and 2031

Figure 21: Asia Pacific Market Attractiveness, by Vertical

Figure 22: Asia Pacific Market Value Share, Analysis, 2020, 2026, and 2031

Figure 23: Asia Pacific Market Attractiveness, Analysis

Figure 24: Asia Pacific Market Value Share, by Country and Sub-region, 2020, 2026, and 2031

Figure 25: Asia Pacific Market Attractiveness, by Country and Sub-region

Figure 26: Latin America Market Value Share, by Vertical, 2020, 2026, and 2031

Figure 27: Latin America Market Attractiveness, by Vertical

Figure 28: Latin America Market Value Share, Analysis, 2020, 2026, and 2031

Figure 29: Latin America Market Attractiveness, Analysis

Figure 30: Latin America Market Value Share, by Country and Sub-region, 2020, 2026, and 2031

Figure 31: Latin America Market Attractiveness, by Country and Sub-region

Figure 32: Middle East & Africa Market Value Share, by Vertical, 2020, 2026, and 2031

Figure 33: Middle East & Africa Market Attractiveness, by Vertical

Figure 34: Middle East & Africa Market Value Share, Analysis, 2020, 2026, and 2031

Figure 35: Middle East & Africa Market Attractiveness, Analysis

Figure 36: Middle East & Africa Market Value Share, by Country and Sub-region, 2020, 2026, and 2031

Figure 37: Middle East & Africa Market Attractiveness, by Country and Sub-region

Figure 38: Global Market Share Analysis, by Company, 2020

Recommendations

Industrial Automation

Barcode Scanner Market

Published : March 2024

Technology

Industrial Barcode Scanners Market

Published : July 2022

Industrial Automation

Image Based Barcode Reader Market

Published : July 2020

Explore Technology Insights

View Reports

In-Counter Barcode Scanners Market