Workout Clothes Market
Market Insights on Workout Clothes covering sales outlook, demand forecast & up-to-date key trends
Workout Clothes Market by Product Type, Material Type & Region - Forecast 2022 – 2032
Workout Clothes Market Outlook (2022-2032)
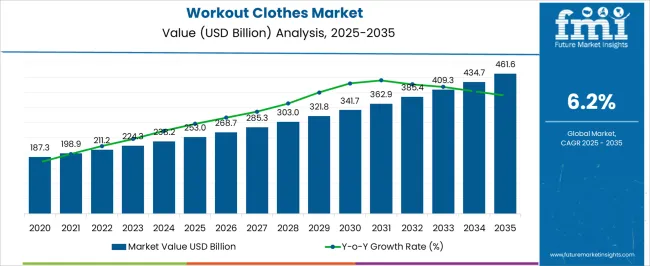
[306 Pages Report] The workout clothes market is garnering an average growth momentum with an estimated CAGR of 6.2% from 2022 to 2032. The workout clothes market share was worth US$ 210.8 Bn in 2022.
Given the growing proclivity towards physical activities among the urban populace, workout clothes manufacturers are likely to receive revenue potential as high as US$ 384.8 Bn by 2032.
“The distinction between traditional casual clothes and workout clothes is widening, thereby reflecting on latter’s sales. As hectic work schedules impose a sedentary lifestyle, the awareness pertaining to physical activity is growing in parallel with the demand for workout clothes.”
As per the FMI study on the workout clothes market, new trends reach the shore of the industry in the form of fast-dry technology for providing added comfort to consumers. Since heat accumulation during a workout makes it difficult for consumers to push their limits, workout clothes manufacturers are refining their products with cooling technology at a higher cost, of course.
The innovation in workout clothes surfaces as a cost-intensive affair, which burns a huge hole in the pockets of consumers. Hence, the frequency of buying active wear is low among the consumers with average income, which could challenge the otherwise high revenue-potential of the workout clothes market.
Attributes |
Details |
Workout Clothes Market CAGR |
6.2% |
Workout Clothes Market Size (2022) |
US$ 210.8 Bn |
Workout Clothes Market Share (2032) |
US$ 384.2 Bn |
Let us know your requirement to get
100% FREE customization
How Resilient Has The Workout Clothes Market Remained Under COVID-19’s Influence?
While the waves of COVID-19 crashed the shores of almost all industries, the workout clothes industry actually garnered more strength, and so speak the numbers. During the historical estimation of the workout clothes market, it grew at a CAGR of 5.2% from 2017 to 2021.
The backdrop of this favorable shift in the growth momentum lies in the fashion aspect. Previously, the buying criteria that impacted the demand for workout clothes used to be their functions—material type, drying ability, brand, etc. which has changed dramatically under the influence of the COVID-19 era.
The workout clothes market share is anticipated to grow due to rise in the number of celebrity yoga channels on different social media platforms. This became a new source of entertainment for consumers locked in during quarantine, which provided the opportunity to inject fashion into the workout clothes market and boosted the demand for workout clothes.
As a result, fashion and function altogether are boosting the sales of workout clothes. Hence, consumers are doing away with their boring pajamas and sweatshirts for a more glamorous outfit, creating a conducive environment for the workout clothes market growth.
All-in-all, the workout clothes market outlook is witnessing numerous growth factors and opportunities, thereby estimated to secure a CAGR of 6.2% during 2022-2032.
What Are The Key Workout Clothes Market Dynamics?
Over the projection period, the rising passion for sports and outdoor recreational activities among the country's young population is expected to fuelthe demand for workout clothes.
Growth in consumer fitness and health consciousness is fuelingsales of workout clothesthat are comfortable and trendy. This is one of the key factors driving theworkout clothes market trends.
Theworkout clothes market sharehas grown due to the increased participation of women and children in sporting activities and the promotion ofworkout clothes. The growing popularity of online retail channels as distribution channel has accelerated theworkout clothes market expansion.
The prevalence of counterfeit workout products, on the other hand, is a major restraint forworkout clothes market share.Fashionable workout clothesare in high demand as they are adaptable, practical, fashionable, and can be worn for a number of events.
To meet this risingdemand for workout clothes, prominent players in theworkout clothes markethave produced creative, technically advanced products that are both pleasant and useful, increasing their profitability.
Another factor propelling theworkout clothes market's growthis the demand for attractive color combinations in various sports activities. As traditional black and white colors are being phased out, demand for pastel colors has spread beyond workout clothes into thegreater workout clothes market.
Theglobal workout clothes marketis growing as disposable income rises, and people become more fitness conscious. Furthermore, an increase in the participation of the youth and elderly in physical activities drivesdemand for sports products, resulting inworkout clothes market growth.
However, the surge in counterfeit items is causing customer safety and quality concerns, as well as brand damage for importantkey players in the workout clothes market.
For example, at Dulles International Airport in Virginia in January 2018, Nike discovered counterfeit workout clothes valued at more than $50,000. These challenges are causing key industry players'sales of workout clothesto decline, negatively impacting theworkout clothes market growth.
Furthermore, unpredictable raw material costs and high design costs result in high-end product costs. As a result of the high cost of workout clothes,sales of workout clothesamong price-sensitive consumers are dropping.
On the contrary, many organizations such as the Women's Sports Foundation, Boxgirls, Feminist Majority Foundation, and others are promoting sports participation through women empowerment projects and campaigns, which are expected to boost theworkout clothes market dynamics.
The increased use of green textiles and the production of workout clothesusing sustainable methods are projected to fuelthe workout clothesmarket growthduring the forecast period.
Find your sweet spots for generating winning opportunities in this market.
Talk to AnalystWhich Segment Dominates The Workout Clothes Market, By Product Type?
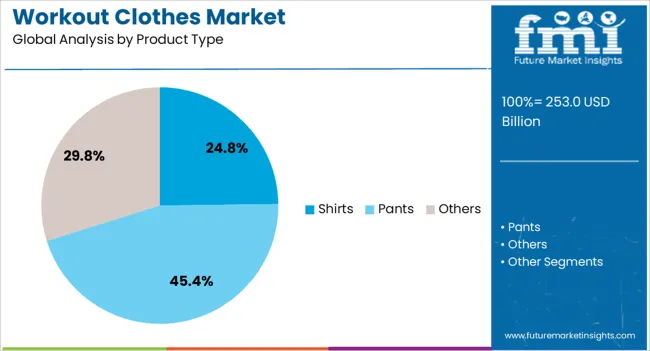
By product type segment, other workout clothes such as shorts, sweatshirts, and hoodies, tank tops are anticipated to dominate the workout clothes market. The other workout clothes segment is projected to register a CAGR of 4.0% during the forecast period 2022-2032.
During the forecast period, the shirts segment is anticipated to hold t considerable revenue share of 30 percent in the workout clothes market. Apart from this, the pants category is predicted to hold the second-largest revenue share, and it is predicted to expand at the quickest rate during the forecast period.
Yoga's growing popularity as a mind-body wellness practice, especially since COVID-19, has resulted in an increase in yoga devotees all over the world.
Furthermore, the adoption of workout clothes is rising as consumers are becoming more concerned about their health as the pandemic spreads over the world, and they are adopting healthier lifestyle choices.
As a result of the lockdown, yoga studios, gyms, health clubs, and other locations where in-person group yoga classes were held was shut down or temporarily closed, encouraging exercise aficionados to enroll in online/live workout programs.
Which Segment Is Likely To Lead The Workout Clothes Market, By Consumer Orientation?
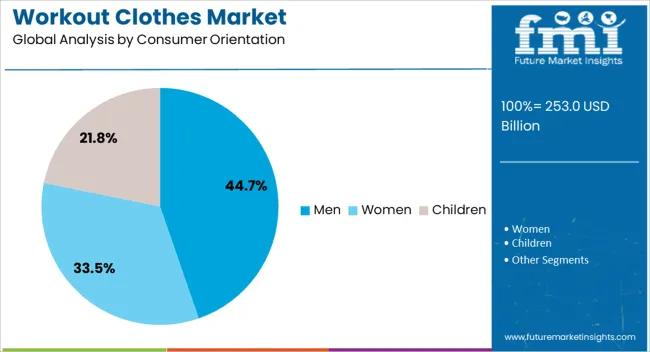
During the forecast period, the women's category is predicted to hold the highest revenue share of almost 40.0 percent in the workout clothes market. The workout clothes market is developing as a result of an increasing number of women joining physical activities and increasing involvement in fitness clubs.
The Sasakawa Sports Foundation (SSF) estimates that 72.4 percent of Japan's population participates in sports at least once a year. Furthermore, nearly 70% of the country's female population participates in sports at least once a year. This element is boosting the country's demand for workout clothes.
Workout clothes market participants are also using collaborations and partnerships with athletes, particularly female athletes, to raise demand for workout clothes in the women's category.

A unified Market Research Subscription Platform, built for today's disparate research needs.
What Is The Regional Analysis For The Workout Clothes Market?
The U.S. workout clothes market is anticipated to hold the greatest revenue share of more than 30.0 percent during the forecast period. More people are working from home than ever before as a result of the coronavirus outbreak in the United States.
The demand for workout clothes rose as Consumers were more likely to work in sweatpants, pajamas, and athleisure as they didn't have to dress up for work. According to the consumer survey, 14 percent of customers have purchased comfortable clothes, such as pajamas or other workout clothes, online since the start of COVID-19.
According to the National Council of Textile Organizations (NCTO), the US textile and clothing market was valued at USD 64.4 Bn in 2020 based on the value of industry shipments, while US fiber, textiles, and apparel exports were valued at USD 25.4 Bn.
Due to nations like China and India having a higher number of young people, Asia-Pacific is the fastest-growing area in the global workout clothes market. The expanding demand for foreign brands like (Under Armour, Nike, and Puma, as well as rising disposable income and a desire to live healthier lifestyles, are likely to boost sales of workout clothes in the region.
China leads the workout clothes market in the APAC region and has the potential to overtake the United States as the world's leading workout clothes market in the future, thanks to government measures encouraging active engagement in sports.
How Is The Competition In The Workout Clothes Market?
Manufacturers are releasing new products that are built of sturdy, long-lasting, and high-quality materials. Consumers are interested in workout clothes with enhanced features such as temperature control, moisture management, and other performance-enhancing characteristics that reduce injury and pain.
Consumers are willing to pay more for such additional benefits due to all of these unique qualities. As a result, consumers are increasingly wearing workout clothes during their free time. Moreover, to support workout clothes, athletic footwear from major companies increases user comfort and promotes athletic performance while lowering the chance of injury.
Companies are developing sports shoes and socks with specialized features in response to the rising incidence of foot disorders and allergies. While some manufacturers in the workout products market offer extra padding in their sports socks to reduce the risk of food allergies, others are progressively putting sophisticated technology into their hosiery.
Recent Developments in the Workout Clothes Market
- As part of a three-year strategic collaboration agreement inked with the franchise in March 2021, global sports brand PUMA introduced the Royal Challenger Bangalore (RCB) athleisure range in September 2021.
- Eastbay and Champs Sports announced the debut of a new garment line, Eastbay Performance, in September 2021. Compression tops, tanks, and tights are available, as well as tees, jackets, and shorts for training and fleece pants and hoodies for casual use.
- Kappa, a leading Italian fashion sports brand, and Hyosung, a global fiber manufacturer that produces world-class products and provides value chain solutions from textile mill to brand to consumer, announced their collaboration to launch Kappa's new K-Spirit e-sports apparel collection at the Tencent Global E-Sports Arena in October 2020. (TGA).
Key Players in the Workout Clothes Market
- Adidas AG
- ASICS Corporation
- Columbia Sportswear Company
- DICK'S Sporting Goods, Inc
- Gap Inc
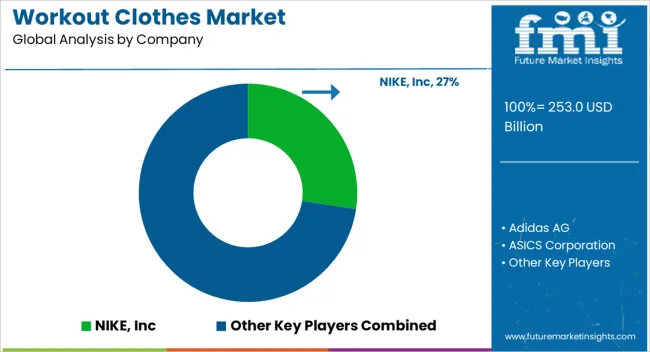
- NIKE, Inc
- PVH Corp
- PUMA SE
- Skechers U.S.A., Inc
- Under Armour, Inc
- V. F. Corporation (North Face, Inc.)
Segments
By Product Type:
- Shirts
- Pants
- Others (Shorts, Sweatshirts & Hoodies, Tank-Top),
By Consumer Orientation:
- Men
- Women
- Children
By Material Type:
- Nylon
- Wool
- Polyester
- Others
By Sales Channel:
- Direct Sales
- Franchised Stores
- Speciality Stores
- Online Retailers
- Other Sales Channel (Mono Brand Stores, Wholesalers/Retailers)
By Region:
- North America
- Europe
- Asia Pacific
- Middle East & Africa
- Latin America
Frequently Asked Questions
What is the CAGR of the Workout Clothes Market?
The workout clothes market is projected to register a CAGR of 6.2%, during the forecast period (2022 - 2032).
Which is the Leading Region in the Workout Clothes Market?
During the projected period, the U.S. is expected to lead the workout clothes market by 2032.
Which Segment Leads in the Workout Clothes Market by Product Type?
Others segment is expected to dominate the workout clothes market over the forecast period.
What is the Growth Estimated for the Workout Clothes Market by 2032?
The workout clothes market is expected to be valued at US$ 384.8 Billion by 2032.
Which was the Historical Size of the Workout Clothes Market?
The workout clothes market size accounted for around US$ 204.5 Billion in 2021.
Table of Content
1. Executive Summary 1.1. Global Market Outlook 1.2. Demand-side Trends 1.3. Supply-side Trends 1.4. Technology Roadmap Analysis 1.5. Analysis and Recommendations 2. Market Overview 2.1. Market Coverage / Taxonomy 2.2. Market Definition / Scope / Limitations 3. Market Background 3.1. Market Dynamics 3.1.1. Drivers 3.1.2. Restraints 3.1.3. Opportunity 3.1.4. Trends 3.2. Scenario Forecast 3.2.1. Demand in Optimistic Scenario 3.2.2. Demand in Likely Scenario 3.2.3. Demand in Conservative Scenario 3.3. Opportunity Map Analysis 3.4. Supply Chain Analysis 3.5. Investment Feasibility Matrix 3.6. Value Chain Analysis 3.6.1. Profit Margin Analysis 3.6.2. Wholesalers and Distributors 3.6.3. Retailers 3.7. PESTLE and Porter’s Analysis 4. Global Workout Clothes Market Analysis 2017-2021 and Forecast, 2022-2032 4.1. Historical Market Size Value (US$ Mn) & Volume (Units) Analysis, 2017-2021 4.2. Current and Future Market Size Value (US$ Mn) & Volume (Units) Projections, 2022-2032 4.2.1. Y-o-Y Growth Trend Analysis 4.2.2. Absolute $ Opportunity Analysis 5. Global Workout Clothes Market Analysis 2017-2021 and Forecast 2022-2032, By Product Type 5.1. Introduction / Key Findings 5.2. Historical Market Size Value (US$ Mn) & Volume (Units) Analysis By Product Type, 2017-2021 5.3. Current and Future Market Size Value (US$ Mn) & Volume (Units) Analysis and Forecast By Product Type, 2022-2032 5.3.1. Shirts 5.3.2. Pants 5.3.3. Others 5.4. Y-o-Y Growth Trend Analysis By Product Type, 2017-2021 5.5. Absolute $ Opportunity Analysis By Product Type, 2022-2032 6. Global Workout Clothes Market Analysis 2017-2021 and Forecast 2022-2032, By Material Type 6.1. Introduction / Key Findings 6.2. Historical Market Size Value (US$ Mn) & Volume (Units) Analysis By Material Type, 2017-2021 6.3. Current and Future Market Size Value (US$ Mn) & Volume (Units) Analysis and Forecast By Material Type, 2022-2032 6.3.1. Nylon 6.3.2. Wool 6.3.3. Polyester 6.3.4. Others 6.4. Y-o-Y Growth Trend Analysis By Material Type, 2017-2021 6.5. Absolute $ Opportunity Analysis By Material Type, 2022-2032 7. Global Workout Clothes Market Analysis 2017-2021 and Forecast 2022-2032, By Consumer Orientation 7.1. Introduction / Key Findings 7.2. Historical Market Size Value (US$ Mn) & Volume (Units) Analysis By Consumer Orientation, 2017-2021 7.3. Current and Future Market Size Value (US$ Mn) & Volume (Units) Analysis and Forecast By Consumer Orientation, 2022-2032 7.3.1. Men 7.3.2. Women 7.3.3. Children 7.4. Y-o-Y Growth Trend Analysis By Consumer Orientation, 2017-2021 7.5. Absolute $ Opportunity Analysis By Consumer Orientation, 2022-2032 8. Global Workout Clothes Market Analysis 2017-2021 and Forecast 2022-2032, By Sales Channel 8.1. Introduction / Key Findings 8.2. Historical Market Size Value (US$ Mn) & Volume (Units) Analysis By Sales Channel, 2017-2021 8.3. Current and Future Market Size Value (US$ Mn) & Volume (Units) Analysis and Forecast By Sales Channel, 2022-2032 8.3.1. Direct Sales 8.3.2. Franchise Stores 8.3.3. Specialty Stores 8.3.4. Online Retailers 8.3.5. Other Sales Channel 8.4. Y-o-Y Growth Trend Analysis By Sales Channel, 2017-2021 8.5. Absolute $ Opportunity Analysis By Sales Channel, 2022-2032 9. Global Workout Clothes Market Analysis 2017-2021 and Forecast 2022-2032, By Region 9.1. Introduction 9.2. Historical Market Size Value (US$ Mn) & Volume (Units) Analysis By Region, 2017-2021 9.3. Current Market Size Value (US$ Mn) & Volume (Units) Analysis and Forecast By Region, 2022-2032 9.3.1. North America 9.3.2. Latin America 9.3.3. Europe 9.3.4. East Asia 9.3.5. South Asia 9.3.6. Oceania 9.3.7. MEA 9.4. Market Attractiveness Analysis By Region 10. North America Workout Clothes Market Analysis 2017-2021 and Forecast 2022-2032, By Country 10.1. Historical Market Size Value (US$ Mn) & Volume (Units) Trend Analysis By Market Taxonomy, 2017-2021 10.2. Market Size Value (US$ Mn) & Volume (Units) Forecast By Market Taxonomy, 2022-2032 10.2.1. By Country 10.2.1.1. U.S. 10.2.1.2. Canada 10.2.2. By Product Type 10.2.3. By Material Type 10.2.4. By Consumer Orientation 10.2.5. By Sales Channel 10.3. Market Attractiveness Analysis 10.3.1. By Country 10.3.2. By Product Type 10.3.3. By Material Type 10.3.4. By Consumer Orientation 10.3.5. By Sales Channel 10.4. Key Takeaways 11. Latin America Workout Clothes Market Analysis 2017-2021 and Forecast 2022-2032, By Country 11.1. Historical Market Size Value (US$ Mn) & Volume (Units) Trend Analysis By Market Taxonomy, 2017-2021 11.2. Market Size Value (US$ Mn) & Volume (Units) Forecast By Market Taxonomy, 2022-2032 11.2.1. By Country 11.2.1.1. Brazil 11.2.1.2. Mexico 11.2.1.3. Argentina 11.2.1.4. Rest of Latin America 11.2.2. By Product Type 11.2.3. By Material Type 11.2.4. By Consumer Orientation 11.2.5. By Sales Channel 11.3. Market Attractiveness Analysis 11.3.1. By Country 11.3.2. By Product Type 11.3.3. By Material Type 11.3.4. By Consumer Orientation 11.3.5. By Sales Channel 11.4. Key Takeaways 12. Europe Workout Clothes Market Analysis 2017-2021 and Forecast 2022-2032, By Country 12.1. Historical Market Size Value (US$ Mn) & Volume (Units) Trend Analysis By Market Taxonomy, 2017-2021 12.2. Market Size Value (US$ Mn) & Volume (Units) Forecast By Market Taxonomy, 2022-2032 12.2.1. By Country 12.2.1.1. Germany 12.2.1.2. Italy 12.2.1.3. France 12.2.1.4. U.K. 12.2.1.5. Spain 12.2.1.6. Russia 12.2.1.7. BENELUX 12.2.1.8. Rest of Europe 12.2.2. By Product Type 12.2.3. By Material Type 12.2.4. By Consumer Orientation 12.2.5. By Sales Channel 12.3. Market Attractiveness Analysis 12.3.1. By Country 12.3.2. By Product Type 12.3.3. By Material Type 12.3.4. By Consumer Orientation 12.3.5. By Sales Channel 12.4. Key Takeaways 13. East Asia Workout Clothes Market Analysis 2017-2021 and Forecast 2022-2032, By Country 13.1. Historical Market Size Value (US$ Mn) & Volume (Units) Trend Analysis By Market Taxonomy, 2017-2021 13.2. Market Size Value (US$ Mn) & Volume (Units) Forecast By Market Taxonomy, 2022-2032 13.2.1. By Country 13.2.1.1. China 13.2.1.2. Japan 13.2.1.3. South Korea 13.2.2. By Product Type 13.2.3. By Material Type 13.2.4. By Consumer Orientation 13.2.5. By Sales Channel 13.3. Market Attractiveness Analysis 13.3.1. By Country 13.3.2. By Product Type 13.3.3. By Material Type 13.3.4. By Consumer Orientation 13.3.5. By Sales Channel 13.4. Key Takeaways 14. South Asia Workout Clothes Market Analysis 2017-2021 and Forecast 2022-2032, By Country 14.1. Historical Market Size Value (US$ Mn) & Volume (Units) Trend Analysis By Market Taxonomy, 2017-2021 14.2. Market Size Value (US$ Mn) & Volume (Units) Forecast By Market Taxonomy, 2022-2032 14.2.1. By Country 14.2.1.1. India 14.2.1.2. Thailand 14.2.1.3. Malaysia 14.2.1.4. Indonesia 14.2.1.5. Rest of South Asia 14.2.2. By Product Type 14.2.3. By Material Type 14.2.4. By Consumer Orientation 14.2.5. By Sales Channel 14.3. Market Attractiveness Analysis 14.3.1. By Country 14.3.2. By Product Type 14.3.3. By Material Type 14.3.4. By Consumer Orientation 14.3.5. By Sales Channel 14.4. Key Takeaways 15. Oceania Workout Clothes Market Analysis 2017-2021 and Forecast 2022-2032, By Country 15.1. Historical Market Size Value (US$ Mn) & Volume (Units) Trend Analysis By Market Taxonomy, 2017-2021 15.2. Market Size Value (US$ Mn) & Volume (Units) Forecast By Market Taxonomy, 2022-2032 15.2.1. By Country 15.2.1.1. Australia 15.2.1.2. New Zealand 15.2.2. By Product Type 15.2.3. By Material Type 15.2.4. By Consumer Orientation 15.2.5. By Sales Channel 15.3. Market Attractiveness Analysis 15.3.1. By Country 15.3.2. By Product Type 15.3.3. By Material Type 15.3.4. By Consumer Orientation 15.3.5. By Sales Channel 15.4. Key Takeaways 16. MEA Workout Clothes Market Analysis 2017-2021 and Forecast 2022-2032, By Country 16.1. Historical Market Size Value (US$ Mn) & Volume (Units) Trend Analysis By Market Taxonomy, 2017-2021 16.2. Market Size Value (US$ Mn) & Volume (Units) Forecast By Market Taxonomy, 2022-2032 16.2.1. By Country 16.2.1.1. GCC 16.2.1.2. South Africa 16.2.1.3. North Africa 16.2.1.4. Rest of MEA 16.2.2. By Product Type 16.2.3. By Material Type 16.2.4. By Consumer Orientation 16.2.5. By Sales Channel 16.3. Market Attractiveness Analysis 16.3.1. By Country 16.3.2. By Product Type 16.3.3. By Material Type 16.3.4. By Consumer Orientation 16.3.5. By Sales Channel 16.4. Key Takeaways 17. Key Countries Workout Clothes Market Analysis 17.1. U.S. 17.1.1. Pricing Analysis 17.1.2. Market Share Analysis, 2021 17.1.2.1. By Product Type 17.1.2.2. By Material Type 17.1.2.3. By Consumer Orientation 17.1.2.4. By Sales Channel 17.2. Canada 17.2.1. Pricing Analysis 17.2.2. Market Share Analysis, 2021 17.2.2.1. By Product Type 17.2.2.2. By Material Type 17.2.2.3. By Consumer Orientation 17.2.2.4. By Sales Channel 17.3. Brazil 17.3.1. Pricing Analysis 17.3.2. Market Share Analysis, 2021 17.3.2.1. By Product Type 17.3.2.2. By Material Type 17.3.2.3. By Consumer Orientation 17.3.2.4. By Sales Channel 17.4. Mexico 17.4.1. Pricing Analysis 17.4.2. Market Share Analysis, 2021 17.4.2.1. By Product Type 17.4.2.2. By Material Type 17.4.2.3. By Consumer Orientation 17.4.2.4. By Sales Channel 17.5. Argentina 17.5.1. Pricing Analysis 17.5.2. Market Share Analysis, 2021 17.5.2.1. By Product Type 17.5.2.2. By Material Type 17.5.2.3. By Consumer Orientation 17.5.2.4. By Sales Channel 17.6. UK 17.6.1. Pricing Analysis 17.6.2. Market Share Analysis, 2021 17.6.2.1. By Product Type 17.6.2.2. By Material Type 17.6.2.3. By Consumer Orientation 17.6.2.4. By Sales Channel 17.7. Germany 17.7.1. Pricing Analysis 17.7.2. Market Share Analysis, 2021 17.7.2.1. By Product Type 17.7.2.2. By Material Type 17.7.2.3. By Consumer Orientation 17.7.2.4. By Sales Channel 17.8. Italy 17.8.1. Pricing Analysis 17.8.2. Market Share Analysis, 2021 17.8.2.1. By Product Type 17.8.2.2. By Material Type 17.8.2.3. By Consumer Orientation 17.8.2.4. By Sales Channel 17.9. Spain 17.9.1. Pricing Analysis 17.9.2. Market Share Analysis, 2021 17.9.2.1. By Product Type 17.9.2.2. By Material Type 17.9.2.3. By Consumer Orientation 17.9.2.4. By Sales Channel 17.10. France 17.10.1. Pricing Analysis 17.10.2. Market Share Analysis, 2021 17.10.2.1. By Product Type 17.10.2.2. By Material Type 17.10.2.3. By Consumer Orientation 17.10.2.4. By Sales Channel 17.11. Australia 17.11.1. Pricing Analysis 17.11.2. Market Share Analysis, 2021 17.11.2.1. By Product Type 17.11.2.2. By Material Type 17.11.2.3. By Consumer Orientation 17.11.2.4. By Sales Channel 17.12. New Zealand 17.12.1. Pricing Analysis 17.12.2. Market Share Analysis, 2021 17.12.2.1. By Product Type 17.12.2.2. By Material Type 17.12.2.3. By Consumer Orientation 17.12.2.4. By Sales Channel 17.13. India 17.13.1. Pricing Analysis 17.13.2. Market Share Analysis, 2021 17.13.2.1. By Product Type 17.13.2.2. By Material Type 17.13.2.3. By Consumer Orientation 17.13.2.4. By Sales Channel 17.14. Thailand 17.14.1. Pricing Analysis 17.14.2. Market Share Analysis, 2021 17.14.2.1. By Product Type 17.14.2.2. By Material Type 17.14.2.3. By Consumer Orientation 17.14.2.4. By Sales Channel 17.15. Indonesia 17.15.1. Pricing Analysis 17.15.2. Market Share Analysis, 2021 17.15.2.1. By Product Type 17.15.2.2. By Material Type 17.15.2.3. By Consumer Orientation 17.15.2.4. By Sales Channel 17.16. China 17.16.1. Pricing Analysis 17.16.2. Market Share Analysis, 2021 17.16.2.1. By Product Type 17.16.2.2. By Material Type 17.16.2.3. By Consumer Orientation 17.16.2.4. By Sales Channel 17.17. Japan 17.17.1. Pricing Analysis 17.17.2. Market Share Analysis, 2021 17.17.2.1. By Product Type 17.17.2.2. By Material Type 17.17.2.3. By Consumer Orientation 17.17.2.4. By Sales Channel 17.18. South Korea 17.18.1. Pricing Analysis 17.18.2. Market Share Analysis, 2021 17.18.2.1. By Product Type 17.18.2.2. By Material Type 17.18.2.3. By Consumer Orientation 17.18.2.4. By Sales Channel 17.19. GCC Countries 17.19.1. Pricing Analysis 17.19.2. Market Share Analysis, 2021 17.19.2.1. By Product Type 17.19.2.2. By Material Type 17.19.2.3. By Consumer Orientation 17.19.2.4. By Sales Channel 18. Market Structure Analysis 18.1. Competition Dashboard 18.2. Competition Benchmarking 18.3. Market Share Analysis of Top Players 18.3.1. By Regional 18.3.2. By Product Type 18.3.3. By Material Type 18.3.4. By Consumer Orientation 18.3.5. By Sales Channel 19. Competition Analysis 19.1. Competition Deep Dive 19.1.1. Nike Inc 19.1.1.1. Overview 19.1.1.2. Product Portfolio 19.1.1.3. Sales Footprint 19.1.1.4. Strategy Overview 19.1.1.4.1. Marketing Strategy 19.1.1.4.2. Product Strategy 19.1.1.4.3. Channel Strategy 19.1.2. Adidas AG 19.1.2.1. Overview 19.1.2.2. Product Portfolio 19.1.2.3. Sales Footprint 19.1.2.4. Strategy Overview 19.1.2.4.1. Marketing Strategy 19.1.2.4.2. Product Strategy 19.1.2.4.3. Channel Strategy 19.1.3. Dick's Sports Goods 19.1.3.1. Overview 19.1.3.2. Product Portfolio 19.1.3.3. Sales Footprint 19.1.3.4. Strategy Overview 19.1.3.4.1. Marketing Strategy 19.1.3.4.2. Product Strategy 19.1.3.4.3. Channel Strategy 19.1.4. PUMA SE 19.1.4.1. Overview 19.1.4.2. Product Portfolio 19.1.4.3. Sales Footprint 19.1.4.4. Strategy Overview 19.1.4.4.1. Marketing Strategy 19.1.4.4.2. Product Strategy 19.1.4.4.3. Channel Strategy 19.1.5. Columbia Sports 19.1.5.1. Overview 19.1.5.2. Product Portfolio 19.1.5.3. Sales Footprint 19.1.5.4. Strategy Overview 19.1.5.4.1. Marketing Strategy 19.1.5.4.2. Product Strategy 19.1.5.4.3. Channel Strategy 19.1.6. ASICS Corp 19.1.6.1. Overview 19.1.6.2. Product Portfolio 19.1.6.3. Sales Footprint 19.1.6.4. Strategy Overview 19.1.6.4.1. Marketing Strategy 19.1.6.4.2. Product Strategy 19.1.6.4.3. Channel Strategy 19.1.7. VF Corporation 19.1.7.1. Overview 19.1.7.2. Product Portfolio 19.1.7.3. Sales Footprint 19.1.7.4. Strategy Overview 19.1.7.4.1. Marketing Strategy 19.1.7.4.2. Product Strategy 19.1.7.4.3. Channel Strategy 19.1.8. PVH Corporation 19.1.8.1. Overview 19.1.8.2. Product Portfolio 19.1.8.3. Sales Footprint 19.1.8.4. Strategy Overview 19.1.8.4.1. Marketing Strategy 19.1.8.4.2. Product Strategy 19.1.8.4.3. Channel Strategy 19.1.9. G-III Apparel Group Limited 19.1.9.1. Overview 19.1.9.2. Product Portfolio 19.1.9.3. Sales Footprint 19.1.9.4. Strategy Overview 19.1.9.4.1. Marketing Strategy 19.1.9.4.2. Product Strategy 19.1.9.4.3. Channel Strategy 19.1.10. Gildan Activewear Inc 19.1.10.1. Overview 19.1.10.2. Product Portfolio 19.1.10.3. Sales Footprint 19.1.10.4. Strategy Overview 19.1.10.4.1. Marketing Strategy 19.1.10.4.2. Product Strategy 19.1.10.4.3. Channel Strategy 19.1.11. Hanes Brands Inc 19.1.11.1. Overview 19.1.11.2. Product Portfolio 19.1.11.3. Sales Footprint 19.1.11.4. Strategy Overview 19.1.11.4.1. Marketing Strategy 19.1.11.4.2. Product Strategy 19.1.11.4.3. Channel Strategy 19.1.12. Patagonia Inc 19.1.12.1. Overview 19.1.12.2. Product Portfolio 19.1.12.3. Sales Footprint 19.1.12.4. Strategy Overview 19.1.12.4.1. Marketing Strategy 19.1.12.4.2. Product Strategy 19.1.12.4.3. Channel Strategy 20. Assumptions & Acronyms Used 21. Research Methodology
Let us know your requirement to get
100% FREE customization
List of Tables
Table 01: Global Workout Clothes Market Value (US$ Mn) Forecast by Region, 2017-2032 Table 02: Global Workout Clothes Market Volume (Units) Forecast by Region, 2017-2032 Table 03: Global Workout Clothes Market Value (US$ Mn) Forecast by Product Type, 2017-2032 Table 04: Global Workout Clothes Market Volume (Units) Forecast by Product Type, 2017-2032 Table 05: Global Workout Clothes Market Value (US$ Mn) Forecast by Material Type, 2017-2032 Table 06: Global Workout Clothes Market Volume (Units) Forecast by Material Type, 2017-2032 Table 07: Global Workout Clothes Market Value (US$ Mn) Forecast by Consumer Orientation, 2017-2032 Table 08: Global Workout Clothes Market Volume (Units) Forecast by Consumer Orientation, 2017-2032 Table 09: Global Workout Clothes Market Value (US$ Mn) Forecast by Sales Channel, 2017-2032 Table 10: Global Workout Clothes Market Volume (Units) Forecast by Sales Channel, 2017-2032 Table 11: North America Workout Clothes Market Value (US$ Mn) Forecast by Country, 2017-2032 Table 12: North America Workout Clothes Market Volume (Units) Forecast by Country, 2017-2032 Table 13: North America Workout Clothes Market Value (US$ Mn) Forecast by Product Type, 2017-2032 Table 14: North America Workout Clothes Market Volume (Units) Forecast by Product Type, 2017-2032 Table 15: North America Workout Clothes Market Value (US$ Mn) Forecast by Material Type, 2017-2032 Table 16: North America Workout Clothes Market Volume (Units) Forecast by Material Type, 2017-2032 Table 17: North America Workout Clothes Market Value (US$ Mn) Forecast by Consumer Orientation, 2017-2032 Table 18: North America Workout Clothes Market Volume (Units) Forecast by Consumer Orientation, 2017-2032 Table 19: North America Workout Clothes Market Value (US$ Mn) Forecast by Sales Channel, 2017-2032 Table 20: North America Workout Clothes Market Volume (Units) Forecast by Sales Channel, 2017-2032 Table 21: Latin America Workout Clothes Market Value (US$ Mn) Forecast by Country, 2017-2032 Table 22: Latin America Workout Clothes Market Volume (Units) Forecast by Country, 2017-2032 Table 23: Latin America Workout Clothes Market Value (US$ Mn) Forecast by Product Type, 2017-2032 Table 24: Latin America Workout Clothes Market Volume (Units) Forecast by Product Type, 2017-2032 Table 25: Latin America Workout Clothes Market Value (US$ Mn) Forecast by Material Type, 2017-2032 Table 26: Latin America Workout Clothes Market Volume (Units) Forecast by Material Type, 2017-2032 Table 27: Latin America Workout Clothes Market Value (US$ Mn) Forecast by Consumer Orientation, 2017-2032 Table 28: Latin America Workout Clothes Market Volume (Units) Forecast by Consumer Orientation, 2017-2032 Table 29: Latin America Workout Clothes Market Value (US$ Mn) Forecast by Sales Channel, 2017-2032 Table 30: Latin America Workout Clothes Market Volume (Units) Forecast by Sales Channel, 2017-2032 Table 31: Europe Workout Clothes Market Value (US$ Mn) Forecast by Country, 2017-2032 Table 32: Europe Workout Clothes Market Volume (Units) Forecast by Country, 2017-2032 Table 33: Europe Workout Clothes Market Value (US$ Mn) Forecast by Product Type, 2017-2032 Table 34: Europe Workout Clothes Market Volume (Units) Forecast by Product Type, 2017-2032 Table 35: Europe Workout Clothes Market Value (US$ Mn) Forecast by Material Type, 2017-2032 Table 36: Europe Workout Clothes Market Volume (Units) Forecast by Material Type, 2017-2032 Table 37: Europe Workout Clothes Market Value (US$ Mn) Forecast by Consumer Orientation, 2017-2032 Table 38: Europe Workout Clothes Market Volume (Units) Forecast by Consumer Orientation, 2017-2032 Table 39: Europe Workout Clothes Market Value (US$ Mn) Forecast by Sales Channel, 2017-2032 Table 40: Europe Workout Clothes Market Volume (Units) Forecast by Sales Channel, 2017-2032 Table 41: East Asia Workout Clothes Market Value (US$ Mn) Forecast by Country, 2017-2032 Table 42: East Asia Workout Clothes Market Volume (Units) Forecast by Country, 2017-2032 Table 43: East Asia Workout Clothes Market Value (US$ Mn) Forecast by Product Type, 2017-2032 Table 44: East Asia Workout Clothes Market Volume (Units) Forecast by Product Type, 2017-2032 Table 45: East Asia Workout Clothes Market Value (US$ Mn) Forecast by Material Type, 2017-2032 Table 46: East Asia Workout Clothes Market Volume (Units) Forecast by Material Type, 2017-2032 Table 47: East Asia Workout Clothes Market Value (US$ Mn) Forecast by Consumer Orientation, 2017-2032 Table 48: East Asia Workout Clothes Market Volume (Units) Forecast by Consumer Orientation, 2017-2032 Table 49: East Asia Workout Clothes Market Value (US$ Mn) Forecast by Sales Channel, 2017-2032 Table 50: East Asia Workout Clothes Market Volume (Units) Forecast by Sales Channel, 2017-2032 Table 51: South Asia Workout Clothes Market Value (US$ Mn) Forecast by Country, 2017-2032 Table 52: South Asia Workout Clothes Market Volume (Units) Forecast by Country, 2017-2032 Table 53: South Asia Workout Clothes Market Value (US$ Mn) Forecast by Product Type, 2017-2032 Table 54: South Asia Workout Clothes Market Volume (Units) Forecast by Product Type, 2017-2032 Table 55: South Asia Workout Clothes Market Value (US$ Mn) Forecast by Material Type, 2017-2032 Table 56: South Asia Workout Clothes Market Volume (Units) Forecast by Material Type, 2017-2032 Table 57: South Asia Workout Clothes Market Value (US$ Mn) Forecast by Consumer Orientation, 2017-2032 Table 58: South Asia Workout Clothes Market Volume (Units) Forecast by Consumer Orientation, 2017-2032 Table 59: South Asia Workout Clothes Market Value (US$ Mn) Forecast by Sales Channel, 2017-2032 Table 60: South Asia Workout Clothes Market Volume (Units) Forecast by Sales Channel, 2017-2032 Table 61: Oceania Workout Clothes Market Value (US$ Mn) Forecast by Country, 2017-2032 Table 62: Oceania Workout Clothes Market Volume (Units) Forecast by Country, 2017-2032 Table 63: Oceania Workout Clothes Market Value (US$ Mn) Forecast by Product Type, 2017-2032 Table 64: Oceania Workout Clothes Market Volume (Units) Forecast by Product Type, 2017-2032 Table 65: Oceania Workout Clothes Market Value (US$ Mn) Forecast by Material Type, 2017-2032 Table 66: Oceania Workout Clothes Market Volume (Units) Forecast by Material Type, 2017-2032 Table 67: Oceania Workout Clothes Market Value (US$ Mn) Forecast by Consumer Orientation, 2017-2032 Table 68: Oceania Workout Clothes Market Volume (Units) Forecast by Consumer Orientation, 2017-2032 Table 69: Oceania Workout Clothes Market Value (US$ Mn) Forecast by Sales Channel, 2017-2032 Table 70: Oceania Workout Clothes Market Volume (Units) Forecast by Sales Channel, 2017-2032 Table 71: MEA Workout Clothes Market Value (US$ Mn) Forecast by Country, 2017-2032 Table 72: MEA Workout Clothes Market Volume (Units) Forecast by Country, 2017-2032 Table 73: MEA Workout Clothes Market Value (US$ Mn) Forecast by Product Type, 2017-2032 Table 74: MEA Workout Clothes Market Volume (Units) Forecast by Product Type, 2017-2032 Table 75: MEA Workout Clothes Market Value (US$ Mn) Forecast by Material Type, 2017-2032 Table 76: MEA Workout Clothes Market Volume (Units) Forecast by Material Type, 2017-2032 Table 77: MEA Workout Clothes Market Value (US$ Mn) Forecast by Consumer Orientation, 2017-2032 Table 78: MEA Workout Clothes Market Volume (Units) Forecast by Consumer Orientation, 2017-2032 Table 79: MEA Workout Clothes Market Value (US$ Mn) Forecast by Sales Channel, 2017-2032 Table 80: MEA Workout Clothes Market Volume (Units) Forecast by Sales Channel, 2017-2032
Find your sweet spots for generating winning opportunities in this market.
Talk to AnalystList of Charts
Figure 01: Global Workout Clothes Market Value (US$ Mn) by Product Type, 2022-2032 Figure 02: Global Workout Clothes Market Value (US$ Mn) by Material Type, 2022-2032 Figure 03: Global Workout Clothes Market Value (US$ Mn) by Consumer Orientation, 2022-2032 Figure 04: Global Workout Clothes Market Value (US$ Mn) by Sales Channel, 2022-2032 Figure 05: Global Workout Clothes Market Value (US$ Mn) by Region, 2022-2032 Figure 06: Global Workout Clothes Market Value (US$ Mn) Analysis by Region, 2017-2032 Figure 07: Global Workout Clothes Market Volume (Units) Analysis by Region, 2017-2032 Figure 08: Global Workout Clothes Market Value Share (%) and BPS Analysis by Region, 2022-2032 Figure 09: Global Workout Clothes Market Y-o-Y Growth (%) Projections by Region, 2022-2032 Figure 10: Global Workout Clothes Market Value (US$ Mn) Analysis by Product Type, 2017-2032 Figure 11: Global Workout Clothes Market Volume (Units) Analysis by Product Type, 2017-2032 Figure 12: Global Workout Clothes Market Value Share (%) and BPS Analysis by Product Type, 2022-2032 Figure 13: Global Workout Clothes Market Y-o-Y Growth (%) Projections by Product Type, 2022-2032 Figure 14: Global Workout Clothes Market Value (US$ Mn) Analysis by Material Type, 2017-2032 Figure 15: Global Workout Clothes Market Volume (Units) Analysis by Material Type, 2017-2032 Figure 16: Global Workout Clothes Market Value Share (%) and BPS Analysis by Material Type, 2022-2032 Figure 17: Global Workout Clothes Market Y-o-Y Growth (%) Projections by Material Type, 2022-2032 Figure 18: Global Workout Clothes Market Value (US$ Mn) Analysis by Consumer Orientation, 2017-2032 Figure 19: Global Workout Clothes Market Volume (Units) Analysis by Consumer Orientation, 2017-2032 Figure 20: Global Workout Clothes Market Value Share (%) and BPS Analysis by Consumer Orientation, 2022-2032 Figure 21: Global Workout Clothes Market Y-o-Y Growth (%) Projections by Consumer Orientation, 2022-2032 Figure 22: Global Workout Clothes Market Value (US$ Mn) Analysis by Sales Channel, 2017-2032 Figure 23: Global Workout Clothes Market Volume (Units) Analysis by Sales Channel, 2017-2032 Figure 24: Global Workout Clothes Market Value Share (%) and BPS Analysis by Sales Channel, 2022-2032 Figure 25: Global Workout Clothes Market Y-o-Y Growth (%) Projections by Sales Channel, 2022-2032 Figure 26: Global Workout Clothes Market Attractiveness by Product Type, 2022-2032 Figure 27: Global Workout Clothes Market Attractiveness by Material Type, 2022-2032 Figure 28: Global Workout Clothes Market Attractiveness by Consumer Orientation, 2022-2032 Figure 29: Global Workout Clothes Market Attractiveness by Sales Channel, 2022-2032 Figure 30: Global Workout Clothes Market Attractiveness by Region, 2022-2032 Figure 31: North America Workout Clothes Market Value (US$ Mn) by Product Type, 2022-2032 Figure 32: North America Workout Clothes Market Value (US$ Mn) by Material Type, 2022-2032 Figure 33: North America Workout Clothes Market Value (US$ Mn) by Consumer Orientation, 2022-2032 Figure 34: North America Workout Clothes Market Value (US$ Mn) by Sales Channel, 2022-2032 Figure 35: North America Workout Clothes Market Value (US$ Mn) by Country, 2022-2032 Figure 36: North America Workout Clothes Market Value (US$ Mn) Analysis by Country, 2017-2032 Figure 37: North America Workout Clothes Market Volume (Units) Analysis by Country, 2017-2032 Figure 38: North America Workout Clothes Market Value Share (%) and BPS Analysis by Country, 2022-2032 Figure 39: North America Workout Clothes Market Y-o-Y Growth (%) Projections by Country, 2022-2032 Figure 40: North America Workout Clothes Market Value (US$ Mn) Analysis by Product Type, 2017-2032 Figure 41: North America Workout Clothes Market Volume (Units) Analysis by Product Type, 2017-2032 Figure 42: North America Workout Clothes Market Value Share (%) and BPS Analysis by Product Type, 2022-2032 Figure 43: North America Workout Clothes Market Y-o-Y Growth (%) Projections by Product Type, 2022-2032 Figure 44: North America Workout Clothes Market Value (US$ Mn) Analysis by Material Type, 2017-2032 Figure 45: North America Workout Clothes Market Volume (Units) Analysis by Material Type, 2017-2032 Figure 46: North America Workout Clothes Market Value Share (%) and BPS Analysis by Material Type, 2022-2032 Figure 47: North America Workout Clothes Market Y-o-Y Growth (%) Projections by Material Type, 2022-2032 Figure 48: North America Workout Clothes Market Value (US$ Mn) Analysis by Consumer Orientation, 2017-2032 Figure 49: North America Workout Clothes Market Volume (Units) Analysis by Consumer Orientation, 2017-2032 Figure 50: North America Workout Clothes Market Value Share (%) and BPS Analysis by Consumer Orientation, 2022-2032 Figure 51: North America Workout Clothes Market Y-o-Y Growth (%) Projections by Consumer Orientation, 2022-2032 Figure 52: North America Workout Clothes Market Value (US$ Mn) Analysis by Sales Channel, 2017-2032 Figure 53: North America Workout Clothes Market Volume (Units) Analysis by Sales Channel, 2017-2032 Figure 54: North America Workout Clothes Market Value Share (%) and BPS Analysis by Sales Channel, 2022-2032 Figure 55: North America Workout Clothes Market Y-o-Y Growth (%) Projections by Sales Channel, 2022-2032 Figure 56: North America Workout Clothes Market Attractiveness by Product Type, 2022-2032 Figure 57: North America Workout Clothes Market Attractiveness by Material Type, 2022-2032 Figure 58: North America Workout Clothes Market Attractiveness by Consumer Orientation, 2022-2032 Figure 59: North America Workout Clothes Market Attractiveness by Sales Channel, 2022-2032 Figure 60: North America Workout Clothes Market Attractiveness by Country, 2022-2032 Figure 61: Latin America Workout Clothes Market Value (US$ Mn) by Product Type, 2022-2032 Figure 62: Latin America Workout Clothes Market Value (US$ Mn) by Material Type, 2022-2032 Figure 63: Latin America Workout Clothes Market Value (US$ Mn) by Consumer Orientation, 2022-2032 Figure 64: Latin America Workout Clothes Market Value (US$ Mn) by Sales Channel, 2022-2032 Figure 65: Latin America Workout Clothes Market Value (US$ Mn) by Country, 2022-2032 Figure 66: Latin America Workout Clothes Market Value (US$ Mn) Analysis by Country, 2017-2032 Figure 67: Latin America Workout Clothes Market Volume (Units) Analysis by Country, 2017-2032 Figure 68: Latin America Workout Clothes Market Value Share (%) and BPS Analysis by Country, 2022-2032 Figure 69: Latin America Workout Clothes Market Y-o-Y Growth (%) Projections by Country, 2022-2032 Figure 70: Latin America Workout Clothes Market Value (US$ Mn) Analysis by Product Type, 2017-2032 Figure 71: Latin America Workout Clothes Market Volume (Units) Analysis by Product Type, 2017-2032 Figure 72: Latin America Workout Clothes Market Value Share (%) and BPS Analysis by Product Type, 2022-2032 Figure 73: Latin America Workout Clothes Market Y-o-Y Growth (%) Projections by Product Type, 2022-2032 Figure 74: Latin America Workout Clothes Market Value (US$ Mn) Analysis by Material Type, 2017-2032 Figure 75: Latin America Workout Clothes Market Volume (Units) Analysis by Material Type, 2017-2032 Figure 76: Latin America Workout Clothes Market Value Share (%) and BPS Analysis by Material Type, 2022-2032 Figure 77: Latin America Workout Clothes Market Y-o-Y Growth (%) Projections by Material Type, 2022-2032 Figure 78: Latin America Workout Clothes Market Value (US$ Mn) Analysis by Consumer Orientation, 2017-2032 Figure 79: Latin America Workout Clothes Market Volume (Units) Analysis by Consumer Orientation, 2017-2032 Figure 80: Latin America Workout Clothes Market Value Share (%) and BPS Analysis by Consumer Orientation, 2022-2032 Figure 81: Latin America Workout Clothes Market Y-o-Y Growth (%) Projections by Consumer Orientation, 2022-2032 Figure 82: Latin America Workout Clothes Market Value (US$ Mn) Analysis by Sales Channel, 2017-2032 Figure 83: Latin America Workout Clothes Market Volume (Units) Analysis by Sales Channel, 2017-2032 Figure 84: Latin America Workout Clothes Market Value Share (%) and BPS Analysis by Sales Channel, 2022-2032 Figure 85: Latin America Workout Clothes Market Y-o-Y Growth (%) Projections by Sales Channel, 2022-2032 Figure 86: Latin America Workout Clothes Market Attractiveness by Product Type, 2022-2032 Figure 87: Latin America Workout Clothes Market Attractiveness by Material Type, 2022-2032 Figure 88: Latin America Workout Clothes Market Attractiveness by Consumer Orientation, 2022-2032 Figure 89: Latin America Workout Clothes Market Attractiveness by Sales Channel, 2022-2032 Figure 90: Latin America Workout Clothes Market Attractiveness by Country, 2022-2032 Figure 91: Europe Workout Clothes Market Value (US$ Mn) by Product Type, 2022-2032 Figure 92: Europe Workout Clothes Market Value (US$ Mn) by Material Type, 2022-2032 Figure 93: Europe Workout Clothes Market Value (US$ Mn) by Consumer Orientation, 2022-2032 Figure 94: Europe Workout Clothes Market Value (US$ Mn) by Sales Channel, 2022-2032 Figure 95: Europe Workout Clothes Market Value (US$ Mn) by Country, 2022-2032 Figure 96: Europe Workout Clothes Market Value (US$ Mn) Analysis by Country, 2017-2032 Figure 97: Europe Workout Clothes Market Volume (Units) Analysis by Country, 2017-2032 Figure 98: Europe Workout Clothes Market Value Share (%) and BPS Analysis by Country, 2022-2032 Figure 99: Europe Workout Clothes Market Y-o-Y Growth (%) Projections by Country, 2022-2032 Figure 100: Europe Workout Clothes Market Value (US$ Mn) Analysis by Product Type, 2017-2032 Figure 101: Europe Workout Clothes Market Volume (Units) Analysis by Product Type, 2017-2032 Figure 102: Europe Workout Clothes Market Value Share (%) and BPS Analysis by Product Type, 2022-2032 Figure 103: Europe Workout Clothes Market Y-o-Y Growth (%) Projections by Product Type, 2022-2032 Figure 104: Europe Workout Clothes Market Value (US$ Mn) Analysis by Material Type, 2017-2032 Figure 105: Europe Workout Clothes Market Volume (Units) Analysis by Material Type, 2017-2032 Figure 106: Europe Workout Clothes Market Value Share (%) and BPS Analysis by Material Type, 2022-2032 Figure 107: Europe Workout Clothes Market Y-o-Y Growth (%) Projections by Material Type, 2022-2032 Figure 108: Europe Workout Clothes Market Value (US$ Mn) Analysis by Consumer Orientation, 2017-2032 Figure 109: Europe Workout Clothes Market Volume (Units) Analysis by Consumer Orientation, 2017-2032 Figure 110: Europe Workout Clothes Market Value Share (%) and BPS Analysis by Consumer Orientation, 2022-2032 Figure 111: Europe Workout Clothes Market Y-o-Y Growth (%) Projections by Consumer Orientation, 2022-2032 Figure 112: Europe Workout Clothes Market Value (US$ Mn) Analysis by Sales Channel, 2017-2032 Figure 113: Europe Workout Clothes Market Volume (Units) Analysis by Sales Channel, 2017-2032 Figure 114: Europe Workout Clothes Market Value Share (%) and BPS Analysis by Sales Channel, 2022-2032 Figure 115: Europe Workout Clothes Market Y-o-Y Growth (%) Projections by Sales Channel, 2022-2032 Figure 116: Europe Workout Clothes Market Attractiveness by Product Type, 2022-2032 Figure 117: Europe Workout Clothes Market Attractiveness by Material Type, 2022-2032 Figure 118: Europe Workout Clothes Market Attractiveness by Consumer Orientation, 2022-2032 Figure 119: Europe Workout Clothes Market Attractiveness by Sales Channel, 2022-2032 Figure 120: Europe Workout Clothes Market Attractiveness by Country, 2022-2032 Figure 121: East Asia Workout Clothes Market Value (US$ Mn) by Product Type, 2022-2032 Figure 122: East Asia Workout Clothes Market Value (US$ Mn) by Material Type, 2022-2032 Figure 123: East Asia Workout Clothes Market Value (US$ Mn) by Consumer Orientation, 2022-2032 Figure 124: East Asia Workout Clothes Market Value (US$ Mn) by Sales Channel, 2022-2032 Figure 125: East Asia Workout Clothes Market Value (US$ Mn) by Country, 2022-2032 Figure 126: East Asia Workout Clothes Market Value (US$ Mn) Analysis by Country, 2017-2032 Figure 127: East Asia Workout Clothes Market Volume (Units) Analysis by Country, 2017-2032 Figure 128: East Asia Workout Clothes Market Value Share (%) and BPS Analysis by Country, 2022-2032 Figure 129: East Asia Workout Clothes Market Y-o-Y Growth (%) Projections by Country, 2022-2032 Figure 130: East Asia Workout Clothes Market Value (US$ Mn) Analysis by Product Type, 2017-2032 Figure 131: East Asia Workout Clothes Market Volume (Units) Analysis by Product Type, 2017-2032 Figure 132: East Asia Workout Clothes Market Value Share (%) and BPS Analysis by Product Type, 2022-2032 Figure 133: East Asia Workout Clothes Market Y-o-Y Growth (%) Projections by Product Type, 2022-2032 Figure 134: East Asia Workout Clothes Market Value (US$ Mn) Analysis by Material Type, 2017-2032 Figure 135: East Asia Workout Clothes Market Volume (Units) Analysis by Material Type, 2017-2032 Figure 136: East Asia Workout Clothes Market Value Share (%) and BPS Analysis by Material Type, 2022-2032 Figure 137: East Asia Workout Clothes Market Y-o-Y Growth (%) Projections by Material Type, 2022-2032 Figure 138: East Asia Workout Clothes Market Value (US$ Mn) Analysis by Consumer Orientation, 2017-2032 Figure 139: East Asia Workout Clothes Market Volume (Units) Analysis by Consumer Orientation, 2017-2032 Figure 140: East Asia Workout Clothes Market Value Share (%) and BPS Analysis by Consumer Orientation, 2022-2032 Figure 141: East Asia Workout Clothes Market Y-o-Y Growth (%) Projections by Consumer Orientation, 2022-2032 Figure 142: East Asia Workout Clothes Market Value (US$ Mn) Analysis by Sales Channel, 2017-2032 Figure 143: East Asia Workout Clothes Market Volume (Units) Analysis by Sales Channel, 2017-2032 Figure 144: East Asia Workout Clothes Market Value Share (%) and BPS Analysis by Sales Channel, 2022-2032 Figure 145: East Asia Workout Clothes Market Y-o-Y Growth (%) Projections by Sales Channel, 2022-2032 Figure 146: East Asia Workout Clothes Market Attractiveness by Product Type, 2022-2032 Figure 147: East Asia Workout Clothes Market Attractiveness by Material Type, 2022-2032 Figure 148: East Asia Workout Clothes Market Attractiveness by Consumer Orientation, 2022-2032 Figure 149: East Asia Workout Clothes Market Attractiveness by Sales Channel, 2022-2032 Figure 150: East Asia Workout Clothes Market Attractiveness by Country, 2022-2032 Figure 151: South Asia Workout Clothes Market Value (US$ Mn) by Product Type, 2022-2032 Figure 152: South Asia Workout Clothes Market Value (US$ Mn) by Material Type, 2022-2032 Figure 153: South Asia Workout Clothes Market Value (US$ Mn) by Consumer Orientation, 2022-2032 Figure 154: South Asia Workout Clothes Market Value (US$ Mn) by Sales Channel, 2022-2032 Figure 155: South Asia Workout Clothes Market Value (US$ Mn) by Country, 2022-2032 Figure 156: South Asia Workout Clothes Market Value (US$ Mn) Analysis by Country, 2017-2032 Figure 157: South Asia Workout Clothes Market Volume (Units) Analysis by Country, 2017-2032 Figure 158: South Asia Workout Clothes Market Value Share (%) and BPS Analysis by Country, 2022-2032 Figure 159: South Asia Workout Clothes Market Y-o-Y Growth (%) Projections by Country, 2022-2032 Figure 160: South Asia Workout Clothes Market Value (US$ Mn) Analysis by Product Type, 2017-2032 Figure 161: South Asia Workout Clothes Market Volume (Units) Analysis by Product Type, 2017-2032 Figure 162: South Asia Workout Clothes Market Value Share (%) and BPS Analysis by Product Type, 2022-2032 Figure 163: South Asia Workout Clothes Market Y-o-Y Growth (%) Projections by Product Type, 2022-2032 Figure 164: South Asia Workout Clothes Market Value (US$ Mn) Analysis by Material Type, 2017-2032 Figure 165: South Asia Workout Clothes Market Volume (Units) Analysis by Material Type, 2017-2032 Figure 166: South Asia Workout Clothes Market Value Share (%) and BPS Analysis by Material Type, 2022-2032 Figure 167: South Asia Workout Clothes Market Y-o-Y Growth (%) Projections by Material Type, 2022-2032 Figure 168: South Asia Workout Clothes Market Value (US$ Mn) Analysis by Consumer Orientation, 2017-2032 Figure 169: South Asia Workout Clothes Market Volume (Units) Analysis by Consumer Orientation, 2017-2032 Figure 170: South Asia Workout Clothes Market Value Share (%) and BPS Analysis by Consumer Orientation, 2022-2032 Figure 171: South Asia Workout Clothes Market Y-o-Y Growth (%) Projections by Consumer Orientation, 2022-2032 Figure 172: South Asia Workout Clothes Market Value (US$ Mn) Analysis by Sales Channel, 2017-2032 Figure 173: South Asia Workout Clothes Market Volume (Units) Analysis by Sales Channel, 2017-2032 Figure 174: South Asia Workout Clothes Market Value Share (%) and BPS Analysis by Sales Channel, 2022-2032 Figure 175: South Asia Workout Clothes Market Y-o-Y Growth (%) Projections by Sales Channel, 2022-2032 Figure 176: South Asia Workout Clothes Market Attractiveness by Product Type, 2022-2032 Figure 177: South Asia Workout Clothes Market Attractiveness by Material Type, 2022-2032 Figure 178: South Asia Workout Clothes Market Attractiveness by Consumer Orientation, 2022-2032 Figure 179: South Asia Workout Clothes Market Attractiveness by Sales Channel, 2022-2032 Figure 180: South Asia Workout Clothes Market Attractiveness by Country, 2022-2032 Figure 181: Oceania Workout Clothes Market Value (US$ Mn) by Product Type, 2022-2032 Figure 182: Oceania Workout Clothes Market Value (US$ Mn) by Material Type, 2022-2032 Figure 183: Oceania Workout Clothes Market Value (US$ Mn) by Consumer Orientation, 2022-2032 Figure 184: Oceania Workout Clothes Market Value (US$ Mn) by Sales Channel, 2022-2032 Figure 185: Oceania Workout Clothes Market Value (US$ Mn) by Country, 2022-2032 Figure 186: Oceania Workout Clothes Market Value (US$ Mn) Analysis by Country, 2017-2032 Figure 187: Oceania Workout Clothes Market Volume (Units) Analysis by Country, 2017-2032 Figure 188: Oceania Workout Clothes Market Value Share (%) and BPS Analysis by Country, 2022-2032 Figure 189: Oceania Workout Clothes Market Y-o-Y Growth (%) Projections by Country, 2022-2032 Figure 190: Oceania Workout Clothes Market Value (US$ Mn) Analysis by Product Type, 2017-2032 Figure 191: Oceania Workout Clothes Market Volume (Units) Analysis by Product Type, 2017-2032 Figure 192: Oceania Workout Clothes Market Value Share (%) and BPS Analysis by Product Type, 2022-2032 Figure 193: Oceania Workout Clothes Market Y-o-Y Growth (%) Projections by Product Type, 2022-2032 Figure 194: Oceania Workout Clothes Market Value (US$ Mn) Analysis by Material Type, 2017-2032 Figure 195: Oceania Workout Clothes Market Volume (Units) Analysis by Material Type, 2017-2032 Figure 196: Oceania Workout Clothes Market Value Share (%) and BPS Analysis by Material Type, 2022-2032 Figure 197: Oceania Workout Clothes Market Y-o-Y Growth (%) Projections by Material Type, 2022-2032 Figure 198: Oceania Workout Clothes Market Value (US$ Mn) Analysis by Consumer Orientation, 2017-2032 Figure 199: Oceania Workout Clothes Market Volume (Units) Analysis by Consumer Orientation, 2017-2032 Figure 200: Oceania Workout Clothes Market Value Share (%) and BPS Analysis by Consumer Orientation, 2022-2032 Figure 201: Oceania Workout Clothes Market Y-o-Y Growth (%) Projections by Consumer Orientation, 2022-2032 Figure 202: Oceania Workout Clothes Market Value (US$ Mn) Analysis by Sales Channel, 2017-2032 Figure 203: Oceania Workout Clothes Market Volume (Units) Analysis by Sales Channel, 2017-2032 Figure 204: Oceania Workout Clothes Market Value Share (%) and BPS Analysis by Sales Channel, 2022-2032 Figure 205: Oceania Workout Clothes Market Y-o-Y Growth (%) Projections by Sales Channel, 2022-2032 Figure 206: Oceania Workout Clothes Market Attractiveness by Product Type, 2022-2032 Figure 207: Oceania Workout Clothes Market Attractiveness by Material Type, 2022-2032 Figure 208: Oceania Workout Clothes Market Attractiveness by Consumer Orientation, 2022-2032 Figure 209: Oceania Workout Clothes Market Attractiveness by Sales Channel, 2022-2032 Figure 210: Oceania Workout Clothes Market Attractiveness by Country, 2022-2032 Figure 211: MEA Workout Clothes Market Value (US$ Mn) by Product Type, 2022-2032 Figure 212: MEA Workout Clothes Market Value (US$ Mn) by Material Type, 2022-2032 Figure 213: MEA Workout Clothes Market Value (US$ Mn) by Consumer Orientation, 2022-2032 Figure 214: MEA Workout Clothes Market Value (US$ Mn) by Sales Channel, 2022-2032 Figure 215: MEA Workout Clothes Market Value (US$ Mn) by Country, 2022-2032 Figure 216: MEA Workout Clothes Market Value (US$ Mn) Analysis by Country, 2017-2032 Figure 217: MEA Workout Clothes Market Volume (Units) Analysis by Country, 2017-2032 Figure 218: MEA Workout Clothes Market Value Share (%) and BPS Analysis by Country, 2022-2032 Figure 219: MEA Workout Clothes Market Y-o-Y Growth (%) Projections by Country, 2022-2032 Figure 220: MEA Workout Clothes Market Value (US$ Mn) Analysis by Product Type, 2017-2032 Figure 221: MEA Workout Clothes Market Volume (Units) Analysis by Product Type, 2017-2032 Figure 222: MEA Workout Clothes Market Value Share (%) and BPS Analysis by Product Type, 2022-2032 Figure 223: MEA Workout Clothes Market Y-o-Y Growth (%) Projections by Product Type, 2022-2032 Figure 224: MEA Workout Clothes Market Value (US$ Mn) Analysis by Material Type, 2017-2032 Figure 225: MEA Workout Clothes Market Volume (Units) Analysis by Material Type, 2017-2032 Figure 226: MEA Workout Clothes Market Value Share (%) and BPS Analysis by Material Type, 2022-2032 Figure 227: MEA Workout Clothes Market Y-o-Y Growth (%) Projections by Material Type, 2022-2032 Figure 228: MEA Workout Clothes Market Value (US$ Mn) Analysis by Consumer Orientation, 2017-2032 Figure 229: MEA Workout Clothes Market Volume (Units) Analysis by Consumer Orientation, 2017-2032 Figure 230: MEA Workout Clothes Market Value Share (%) and BPS Analysis by Consumer Orientation, 2022-2032 Figure 231: MEA Workout Clothes Market Y-o-Y Growth (%) Projections by Consumer Orientation, 2022-2032 Figure 232: MEA Workout Clothes Market Value (US$ Mn) Analysis by Sales Channel, 2017-2032 Figure 233: MEA Workout Clothes Market Volume (Units) Analysis by Sales Channel, 2017-2032 Figure 234: MEA Workout Clothes Market Value Share (%) and BPS Analysis by Sales Channel, 2022-2032 Figure 235: MEA Workout Clothes Market Y-o-Y Growth (%) Projections by Sales Channel, 2022-2032 Figure 236: MEA Workout Clothes Market Attractiveness by Product Type, 2022-2032 Figure 237: MEA Workout Clothes Market Attractiveness by Material Type, 2022-2032 Figure 238: MEA Workout Clothes Market Attractiveness by Consumer Orientation, 2022-2032 Figure 239: MEA Workout Clothes Market Attractiveness by Sales Channel, 2022-2032 Figure 240: MEA Workout Clothes Market Attractiveness by Country, 2022-2032
Need specific information?
Request CustomizationExplore Consumer Product Insights
View Reports