Peripheral Intravenous Catheters Market
Explore How Adoption of Peripheral Intravenous Catheters is Enhancing Patient Care! Find Out More in FMI’s Latest Study
Peripheral Intravenous Catheters Market by Product Type, Technology End User, End Use & Region- Forecast 2022 – 2032
High Incidence of Needlestick Injuries is Persuading Healthcare Professionals to Use Peripherals Intravenous Catheters
A summary of Peripheral Intravenous Catheters Market development:
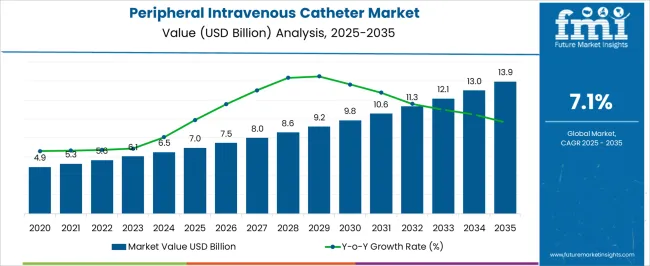
[269 Pages Report] Global demand for peripheral intravenous catheters is expected to rise at a yearly growth rate of 7.2% Y-o-Y to $11.03 billion by 2032, supported by:
- The global increase in the prevalence of chronic diseases and the rise in the population ageing
- Rise in the number of hospitalizations
- Growth in focus on curtailing needle-stick injuries and high healthcare expenditure
- High adoption of safety-ported short peripheral intravenous catheters
Peripheral intravenous catheters are novel drug delivery systems used for therapeutic purposes such as the administration of medications, fluids or blood products, as well as blood sampling. They are the most frequently used vascular access in medicine, placed in a vein on the arm or hand. The intravenous catheter is inserted into a peripheral vein to deliver medicines and nutritional supplements. It is widely helpful in the collection of blood samples for diagnostic purposes.
The high incidence of needlestick injuries is persuading healthcare professionals to use drug delivery devices that reduce such a risk and increase patient comfort. Thus, the rise in needlestick injuries promotes the use of safer devices, thereby surging the market's growth of peripheral intravenous catheters.
Attribute |
Key Statistics |
Peripheral Intravenous Catheters Market Base Value (2021) |
US$ 5.3 Bn |
Estimated Market Size (2022) |
US$ 5.7 Bn |
Projected Market Size (2032) |
US$ 11.3 Bn |
Value-based CAGR (2022-2032) |
7.2% |
Market Share of Top 5 Countries |
56.4% |
Let us know your requirement to get
100% FREE customization
Development of Peripheral Intravenous Catheters in North America Region Drives Global Growth
Needlestick injuries due to injection needles are a key concern for patients that require regular injections. Percutaneous wound injury can be caused by needle tips during handling, disassembling, or even during the disposal of needles and syringes. According to the Centers for Disease Control and Prevention (CDC), USA approximately 385,000 needlestick injuries occur in the U.S. each year.
North America held the majority of the market share. The region suffers from rising chronic diseases and a growing geriatric population. North America has sophisticated healthcare facilities, and the reimbursement coverage contributes to the large market share of the region. According to the National Center for Chronic Disease Prevention and Health, 6 in 10 adults in the US have a chronic disease at some point in their lives. Chronic disease is the leading cause of death and disability and the Leading Driver of the Nation’s $3.5 Trillion in Annual Health Care Costs. The factors above are expected to boost regional growth.
The target population comprising individuals with chronic conditions such as neurological disorders, diabetes, and infectious disorders is rising in North America. This provides avenues for players in this vertical to carry out campaigns and awareness programs with regard to disease treatment thereby increasing product penetration in the regional verticals.
Opportunities in the Peripheral Intravenous Catheters Market
Integrated peripheral intravenous catheters reduce internal pressures on the vein incurred when staff manipulate the catheter to connect the extension set. Postinsertion the use of integrated catheters provides additional fluid tubing connection or direct injections are undertaken via the dedicated port, slightly upstream of the catheter itself and reducing movement of the catheter body against the internal vein wall. Less movement may therefore be key in reducing irritation of the tunica intima of the vessels, which in turn decreases vessel swelling and consequently painful oedema, occlusion or infiltration.
The integrated peripheral intravenous catheters also reduce the risk of contamination and infection by reducing disconnection and manipulation, as well as accidental disconnection since the extension tubing is a built-in feature. These catheters have a flat/rectangular face on the surface placed against the skin and a round/half-cylindrical shape at the top. Moreover, as compared to traditional fully cylindrical-shaped catheters, integrated peripheral catheters reduce external pressure on the vein, causing less irritation and subsequent phlebitis, internal swelling and occlusion.
Peripheral intravenous catheters are novel drug delivery systems used for therapeutic purposes such as administration of medications, fluids or blood products, as well as blood sampling. They are the most frequently used vascular access in medicine, placed in a vein on the arm or hand.
The most common practice in hospitals is the insertion of peripheral intravenous catheters (PIVC). 33-67% of hospitalized patients need at least one implantation of a peripheral vein. Parenteral nutrition, infuscate solutions, blood products, and intravenous medication administration all need the use of peripheral vein catheters.
Additionally, they are required for access to vascular treatments. Every year, hospitalized patients worldwide have more than one billion peripheral intravenous catheters (PIVCs) implanted. The need for peripheral intravenous catheters in hospitals is rising as more patients are admitted, and the trend is likely to continue during the next ten years.
Similarly, the development of advanced monitoring products is expected to bolster the market's growth of peripheral intravenous catheters. Various companies are constantly investing in research and development to introduce novel medical devices that can improve patient care and minimize errors. For instance, in July 2018, EchoNous received the U.S. Food and Drug Administration (FDA) 510(k) clearance for the EchoNous Vein™, an ultrasound-based tool designed specifically for nurses to improve peripheral IV (PIV) catheter placements.
The market value for peripheral intravenous catheters was approximately 23.3% of the overall ~US$ 22.7 Bn catheters market in 2021.
Find your sweet spots for generating winning opportunities in this market.
Talk to AnalystSales Analysis of Peripheral Intravenous Catheter from 2015 to 2021 Vs Demand Outlook for 2022 to 2032
The global sales of peripheral intravenous catheters are projected to rise at 7.2% CAGR between 2022 and 2032, compared to the 6.3% CAGR registered from 2015 to 2021. The rising prevalence of chronic diseases, the growing need for better drug delivery systems, and an increase in the number of patients in hospitals are driving growth in the global peripheral intravenous catheters market.
The three most common causes of mortality and morbidity worldwide during the past three decades are cardiovascular, urological, and neurological diseases. Throughout the forecast period, the market is expected to be driven by an increase in the use of peripheral intravenous catheters to treat certain chronic diseases that need hospitalization.
Peripheral intravenous (IV) catheter demand is also driven by the ageing population and improvements in surgical and therapeutic methods. A significant market trend is the introduction of closed catheters to inject tracers during computed tomography. These polyurethane-based catheters are strong enough to endure pressures of more than 300 pounds per square inch. As a result of their high-pressure resistance, they are being used more frequently in CT imaging applications.
Similarly, increasing the usage of a peripheral intravenous catheter for blood sampling will further aid in the expansion of the peripheral intravenous catheter market during the forecast period.
What are the Key Trends Driving the Peripheral Intravenous Catheters Market?
“Rising Needle-stick Injuries Encouraging the Adoption of Peripheral Intravenous Catheters”
For patients who require frequent injections, needle stick injuries from injection needles are a major problem. Handling, disassembling, or even disposal of needles and syringes can result in percutaneous wound injuries from needle tips. The Centers for Disease Control and Prevention (CDC), US, reports that there are about 385,000 needle stick injuries annually.
Healthcare professionals are being influenced by the high rate of needle stick injuries to utilize drug delivery systems that lower this risk and improve patient comfort. As a result, the market for peripheral intravenous catheters is expanding since the prevalence of needle stick injuries encourages using safer devices like catheters.
Similarly, the development of novel surgical techniques increased knowledge of cutting-edge therapeutic options, and advancements in catheters will open up new growth opportunities for leading peripheral intravenous catheter manufacturers over the next ten years.

A unified Market Research Subscription Platform, built for today's disparate research needs.
What are the Factors Restraining Growth of Peripheral Intravenous Catheters Market?
The use of a peripheral intravenous catheter (PIVC) is a common invasive procedure in healthcare settings, but 35–50% of these catheters do not reach their targeted dwell time, leading to difficulties that might delay treatment or even result in patient discharge, impeding the market growth.
Similarly, the difficulty of inserting a peripheral intravenous catheter and a lack of experience are two main barriers to market expansion. According to estimates, 70% of individuals with PIVCs will experience comorbid conditions such as infections. Best practices, according to consensus, could reduce the risk of such complications and shorten hospital stays. However, the high price of peripheral intravenous (IV) catheters is anticipated to restrain market expansion.
Country-wise Insights
Will the USA Retain its Dominance over the Global Peripheral Intravenous Catheters Market?
“Increasing Hospitalizations in the USA Propelling Demand for Peripheral Intravenous Catheters”
As per FMI, the USA will continue to dominate the global peripheral intravenous with a total market share of about 85.3% in 2021 and is expected to continue to experience the same growth throughout the forecast period. The rising prevalence of chronic diseases, availability of improved catheters, high levels of health awareness among people, and an increase in surgical procedures are some of the key factors expected to fuel growth in the U.S. peripheral intravenous catheters market.
Similarly, a sharp rise in the number of hospitalizations is playing a crucial role in pushing the demand for peripheral intravenous catheters in the country and the trend is likely to continue during the forecast period. For instance, as per the 2020 AHA Annual Survey (FY 2020), total admission in all USA hospitals reached 33,356,853
In addition, reimbursement practices for catheters, such as those offered by the Centers for Medicare and Medicaid in the U.S., aid in market expansion.
What is the Demand Outlook for Peripheral Intravenous Catheters Market in China?
“Rising Incidence of Chronic Diseases Fuelling Market Growth in China”
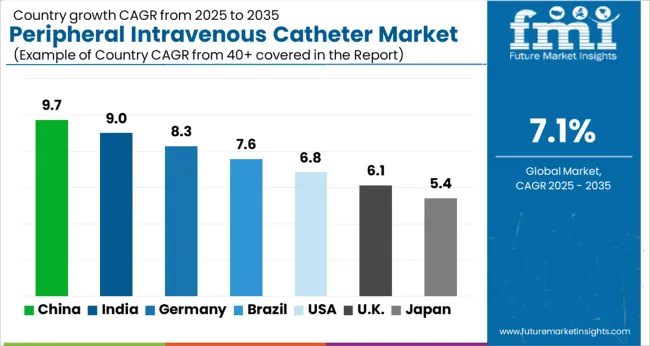
The peripheral intravenous catheters market in China is set to exhibit a CAGR of nearly 7.2% during the forecast period of 2022 and 2032. The increased need for intravenous catheters is fuelled by factors of rapidly rising cases of chronic diseases, increasing healthcare spending, advancing medical technology, and accelerating growth of the medical tourism sector.
Since China has the greatest population in the world, there will likely be more patients there in the future. This will further elevate the demand for peripheral intravenous catheters in the coming years.
Why is the UK Expected to Dominate the European Peripheral Intravenous Catheters Market in the Coming Years?
“Rise in Medical Tourism to Support Market Growth in the UK”
The UK held approximately 14.1% share in the European market in 2021 and is projected to display growth at a lucrative CAGR of 7.4% during the forecast period. Factors such as high hospital administration, the presence of reimbursement policies, and the consolidation of the healthcare industry are driving growth in the U.K. peripheral intravenous catheters.
Besides this, flourishing medical tourism due to the presence of sophisticated medical technology and well-trained professionals will further boost the market growth in the country during the assessment period.
What makes India a Highly Lucrative Market for Peripheral Intravenous Catheters?
“Rise in Patient Pool and Rapidly Expanding Healthcare Industry Generating Demand in India”
India held approximately 39.0% share in the South Asia peripheral intravenous catheters market in 2021 and is expected to grow at a steady CAGR of 5.8% through 2032. Growth in the Indian market is driven by an increasing patient pool, expanding healthcare industry, favourable government support, and an increase in local manufacturers selling goods at reduced prices.
Category-wise Insights
Which is the Most Preferred Product Type in Peripheral Intravenous Catheters Market?
“Demand to Remain High for Short Peripheral IV Catheter in the Market”
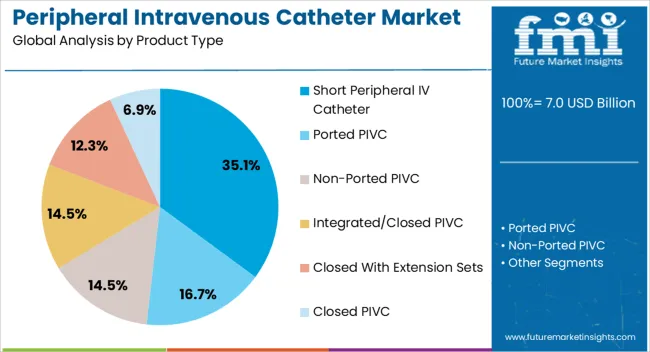
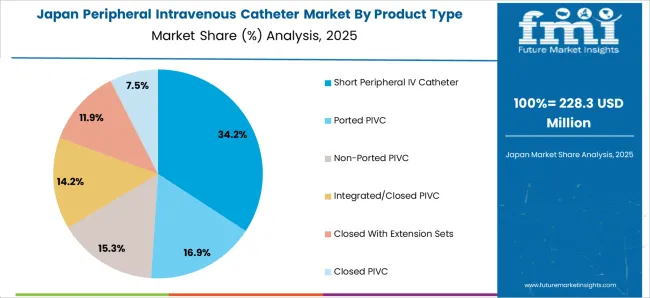
Short peripheral IV catheter segment held the highest market share of about 67.4% in the global peripheral intravenous catheters market in 2021 and it is expected to grow at a CAGR of 6.5% during the forecast period. This can be attributed to the rising prevalence of chronic diseases like cancer and the increasing usage of short peripherals for treatments like chemotherapy.
Chemotherapy is routinely administered in oncology treatment using a short peripheral intravenous catheter (PIVC). There is a need for more consistency in the selection, insertion, and management of short PIVCs even though peripheral catheterization is an invasive procedure. This is especially true in the oncology setting where patients are increasingly receiving a variety of IV treatments over a long period, sometimes with only temporary remissions.
Which Technology is Trending in the Peripheral Intravenous Catheters Market?
“Risk-Free Nature of Safety PIVC Making it Highly Sought-After Technology”
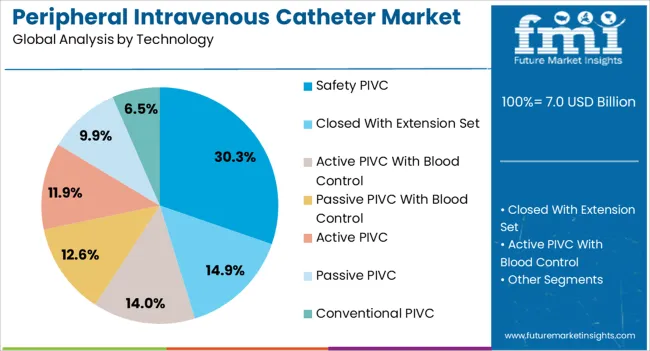
The safety PIVC segment held a revenue share of around 71.2% in the global peripheral intravenous catheters market in 2021 and it is expected to grow at the highest CAGR of 8.0%. throughout the forecast period. This can be attributed to the rising end-user preference for safe PIVC due to its safe and risk-free nature.
Safety intravenous catheters offer control of the blood and decrease the hazard of blood exposure and contamination. When the patient is first venepuncture, a special valve inside the catheter hub restricts blood flow from the vein. The transmission of blood-borne pathogens from the patient to the caregiver via contaminated gloves, bedding, clothing, and dressings is reduced by maintaining a clean access site.
Which is the Leading End User of Peripheral Intravenous Catheters Globally?
“Majority of Peripheral Intravenous Catheter Sales to Remain Concentrated in Hospitals”
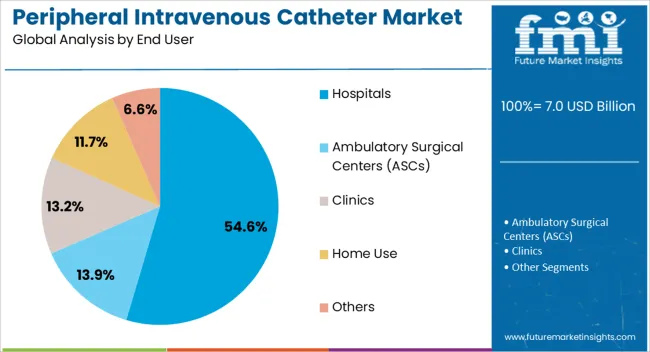
Hospitals held the highest market share value of 62.2% in the global peripheral intravenous catheters market in 2021 and will likely retain its dominance during the forecast period. This can be attributed to the rapid surge in hospitals and increased hospitalizations.
Healthcare providers are being encouraged to employ drug delivery systems that lower such a risk and improve patient comfort, increasing the demand for peripheral intravenous catheters in the hospital setting.
Additionally, high prevalence of needle sticks injuries due to the increased hospitalizations and the availability of skilled manpower.
Competitive Landscape
Key companies operating in the global peripheral intravenous catheters market are concentrating on adopting various organic and inorganic strategies such as new product launches and approvals, investments in R&D, collaborations, mergers, acquisitions, and partnerships to increase their revenue share and gain a competitive edge in the market. For instance,
In July 2022, B. Braun Medical Inc. (B. Braun), a leader in infusion therapy, launched its new Introcan Safety 2 IV Catheter with one-time blood control. The newest innovation from B. Braun makes IV access safer for the clinician by lowering the possibility of needle stick injuries and exposure to blood.
In May 2022 – B. Braun Medical Inc. collaborated with Massachusetts General Hospital (MGH), one of the nation’s leading research hospitals, to jointly develop innovative solutions to help frontline healthcare workers improve patient care and develop business models to deliver care more efficiently and productively.
After getting approval from the U.S. Food and Drug Administration (FDA) and the CE Mark in March 2022, Shockwave Medical, Inc. announced that the Shockwave M5+ peripheral IVL catheter is now commercially available throughout the world. The Shockwave M5+ catheter, whose launch has been restricted up to this point, is specially made to shorten IVL treatments, offer other access possibilities, and extend IVL therapy to patients with bigger vessel diameters.
In May 2022, Access Vascular, Inc. (AVI) announced that it has received U.S. Food and Drug Administration (FDA) 510(k) clearance for its HydroPICC® Dual-Lumen catheter.
Report Scope as per Peripheral Intravenous Catheter Industry Analysis
Attribute |
Details |
Estimated Market Size (2022) |
US$ 5.7 Bn |
Projected Market Size (2032) |
US$ 11.3 Bn |
Anticipated Growth Rate (2022-2032) |
7.2% |
Forecast Period |
2015-2021 |
Historical Data Available for |
2022-2032 |
Market Analysis |
US$ Mn for Value |
Key Regions Covered |
North America, Latin America, Europe, South Asia, East Asia, Oceania, and Middle East & Africa |
Key Countries Covered |
U.S., Canada, Brazil, Mexico, Argentina, U.K., Germany, Italy, Russia, Spain, France, BENELUX, Nordic Countries, India, Thailand, Indonesia, Malaysia, Japan, China, South Korea, Australia, New Zealand, Turkey, GCC, Israel and South Africa |
Key Market Segments Covered |
Product Type, Technology, End User, and Region |
Key Companies Profiled |
|
Report Coverage |
Market Forecast, Company Share Analysis, Competition Intelligence, DROT Analysis, Market Dynamics and Challenges, and Strategic Growth Initiatives |
Key Market Segments Covered in Peripheral Intravenous Catheter Industry Research
By Product Type:
- Short Peripheral IV Catheter
- Ported PIVC
- Non-Ported PIVC
- Integrated/Closed PIVC
- Closed with Extension Sets
- Closed PIVC
By Technology:
- Conventional PIVC
- Safety PIVC
- Closed with Extension Set
- Active PIVC with Blood Control
- Passive PIVC with Blood Control
- Active PIVC
- Passive PIVC
By End User:
- Hospitals
- Ambulatory Surgical Centers (ASCs)
- Clinics
- Home Use
- Others
By Region:
- North America
- Latin America
- Europe
- South Asia
- East Asia
- Oceania
- The Middle East and Africa (MEA)
Frequently Asked Questions
What is the current size of the peripheral intravenous catheters market?
The global peripheral intravenous catheters market size is estimated to reach US$ 5.7 Bn in 2022.
What is the sales forecast for the peripheral intravenous catheters market through 2032?
The peripheral intravenous catheters market is expected to reach US$ 11.3 Bn by the end of 2032, with sales revenue expected to register a 7.2% CAGR throughout the forecast period.
At what rate did the peripheral intravenous catheters market grow during the last 7 years (2015-2021)?
From 2015-2021, the peripheral intravenous catheters market expanded at a CAGR of 6.3%.
What are the key trends shaping the peripheral intravenous catheter industry?
Increasing parenteral drug approval, growing popularity of integrated or closed peripheral intravenous catheters, and the increasing importance of IV therapy are some of the key trends shaping growth of this market.
Which are the top 5 countries driving demand for peripheral intravenous catheters?
The U.S., China, Japan, Germany, and the U.K. are top 5 countries driving demand for peripheral intravenous catheters.
What is the demand outlook for North American peripheral intravenous catheters market?
North America is one of the key markets for peripheral intravenous catheters, with the U.S. accounting for about 85.3% of the North American peripheral intravenous catheters market in 2021.
At what percentage is the demand for peripheral intravenous catheters expected to register grow in Europe?
Demand for peripheral intravenous catheters in Europe is expected to grow at 6.6% CAGR over the next ten years.
Which countries are the key producers of peripheral intravenous catheters?
The U.S., China, and Germany are the key producers of peripheral intravenous catheters.
Who are the key players in the peripheral intravenous catheters market sphere?
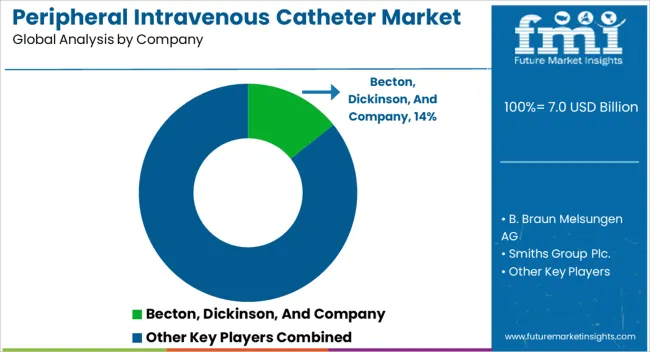
Becton, Dickinson and Company, B. Braun Melsungen AG, Smiths Group plc, Terumo Corporation, Venner Medical, Vygon, Teleflex Incorporated, C. R. Bard, Inc., NIPRO Medical Corporation, and Argon Medical Devices, Inc. are some of the key players in the peripheral intravenous catheters market.
How big is the peripheral intravenous catheters market in India?
India accounts for about 39.0% share of the South Asian peripheral intravenous catheters market in 2021 and is projected to grow with a CAGR of 5.8% during the forecast period.
Table of Content
1. Executive Summary 1.1. Global Market Outlook 1.2. Demand Side Trends 1.3. Supply Side Trends 1.4. Analysis and Recommendations 2. Market Overview 2.1. Market Coverage / Taxonomy 2.2. Market Definition / Scope / Limitations 2.3. Inclusions and Exclusions 3. Key Market Trends 3.1. Key Trends Impacting the Market 3.2. Product Development and Innovation Trends 4. Key Success Factors 4.1. Product Adoption / Usage Analysis 4.2. Product USPs / Features 4.3. Key Promotional Strategies, By Manufacturers 4.4. Recent Product Launches and Approvals 4.5. Regulatory and Reimbursement Scenario 4.6. Value Chain Analysis 4.7. PESTLE Analysis 4.8. Porter’s Analysis 5. Market Background 5.1. Macro-Economic Factors 5.1.1. Global GDP Growth Outlook 5.1.2. Global Healthcare Outlook 5.1.3. Per Capita Healthcare Expenditure Outlook 5.2. Forecast Factors - Relevance & Impact 5.2.1. Rising prevalence of cardiac disorders 5.2.2. Technological Advances 5.2.3. Development of Novel Products 5.2.4. High Cost of Electrophysiology Diagnostic Procedures. 5.2.5. Regulatory Imposition 5.2.6. Innovation Empowering the Manufacturing Capacities 5.2.7. Per Patient Spending 5.3. Market Dynamics 5.3.1. Drivers 5.3.2. Restraints 5.3.3. Opportunity Analysis 6. COVID-19 Crisis – Impact Assessment 6.1. COVID19 and Impact Analysis 6.1.1. Revenue By Product Type 6.1.2. Revenue By Technology 6.1.3. Revenue By End User 6.1.4. Revenue By Country 6.2. 2021 Market Scenario 7. Global Market Volume (Units) Analysis 2015-2021 and Forecast, 2022-2032 7.1. Historical Market Volume (Units) Analysis, 2015-2021 7.2. Current and Future Market Volume (Units) Projections, 2022-2032 7.2.1. Y-o-Y Growth Trend Analysis 8. Global Market - Pricing Analysis 8.1. Regional Pricing Analysis By Products 8.2. Pricing Break-up 8.2.1. Manufacturer Level Pricing 8.2.2. Distributor Level Pricing 8.3. Global Average Pricing Analysis Benchmark 9. Global Market Demand (in Value or Size in US$ Mn) Analysis 2015–2021 and Forecast, 2022–2032 9.1. Historical Market Value (US$ Mn) Analysis, 2015–2021 9.2. Current and Future Market Value (US$ Mn) Projections, 2022–2032 9.2.1. Y-o-Y Growth Trend Analysis 9.2.2. Absolute $ Opportunity Analysis 10. Global Market Analysis 2015–2021 and Forecast 2022–2032, By Product Type 10.1. Introduction / Key Findings 10.2. Historical Market Size (US$ Mn) and Volume (Units) Analysis By Product Type, 2015–2021 10.3. Current and Future Market Size (US$ Mn) and Volume (Units) Analysis and Forecast By Product Type, 2022–2032 10.3.1. Short Peripheral IV Catheter 10.3.1.1. Ported PIVC 10.3.1.2. Non-Ported PIVC 10.3.2. Integrated/Closed PIVC 10.3.2.1. Closed with Extension Set 10.3.2.2. Closed PIVC 10.4. Market Attractiveness Analysis By Product Type 11. Global Market Analysis 2015–2021 and Forecast 2022–2032, By Technology 11.1. Introduction / Key Findings 11.2. Historical Market Size (US$ Mn) Analysis By Technology, 2015–2021 11.3. Current and Future Market Size (US$ Mn) Analysis and Forecast By Technology, 2022–2032 11.3.1. Conventional PIVC 11.3.2. Safety PIVC 11.3.2.1. Closed with Extension Set 11.3.2.2. Active PIVC with Blood Control 11.3.2.3. Passive PIVC with Blood Control 11.3.2.4. Active PIVC 11.3.2.5. Passive PIVC 11.4. Market Attractiveness Analysis By Technology 12. Global Market Analysis 2015–2021 and Forecast 2022–2032, By End User 12.1. Introduction / Key Findings 12.2. Historical Market Size (US$ Mn), By End User, 2015–2021 12.3. Current and Future Market Size (US$ Mn) and Forecast by End User, 2022–2032 12.3.1. Hospitals 12.3.2. Ambulatory Surgical Centers 12.3.3. Clinics 12.3.4. Home Use 12.3.5. Others 12.4. Market Attractiveness Analysis By End User 13. Global Market Analysis 2015–2021 and Forecast 2022–2032, by Region 13.1. Introduction 13.2. Historical Market Size (US$ Mn) Analysis By Region, 2015–2021 13.3. Current Market Size (US$ Mn) Analysis and Forecast By Region, 2022–2032 13.3.1. North America 13.3.2. Latin America 13.3.3. Europe 13.3.4. East Asia 13.3.5. South Asia 13.3.6. Oceania 13.3.7. The Middle East and Africa (MEA) 13.4. Market Attractiveness Analysis By Region 14. North America Market Analysis 2015–2021 and Forecast 2022–2032 14.1. Introduction 14.2. Historical Market Size (US$ Mn) and Volume (Units) Trend Analysis By Market Taxonomy, 2015–2021 14.3. Market Size (US$ Mn) and Volume (Units) Forecast By Market Taxonomy, 2022–2032 14.3.1. By Country 14.3.1.1. U.S. 14.3.1.2. Canada 14.3.2. By Product Type 14.3.3. By Technology 14.3.4. By End User 14.4. Market Attractiveness Analysis 14.4.1. By Country 14.4.2. By Product Type 14.4.3. By Technology 14.4.4. By End User 14.5. Market Trends 14.6. Key Market Participants - Intensity Mapping 14.7. Drivers and Restraints - Impact Analysis 14.8. Country Level Analysis & Forecast 14.8.1. U.S. Market Analysis 14.8.1.1. .Introduction 14.8.1.2. Market Analysis and Forecast by Market Taxonomy 14.8.1.2.1. By Product Type 14.8.1.2.2. By Technology 14.8.1.2.3. By End User 14.8.2. Canada Market Analysis 14.8.2.1. Introduction 14.8.2.2. Market Analysis and Forecast by Market Taxonomy 14.8.2.2.1. By Product Type 14.8.2.2.2. By Technology 14.8.2.2.3. By End User 15. Latin America Market Analysis 2015–2021 and Forecast 2022–2032 15.1. Introduction 15.2. Historical Market Size (US$ Mn) and Volume (Units) Trend Analysis By Market Taxonomy, 2015–2021 15.3. Market Size (US$ Mn) and Volume (Units) Forecast By Market Taxonomy, 2022–2032 15.3.1. By Country 15.3.1.1. Brazil 15.3.1.2. Mexico 15.3.1.3. Argentina 15.3.1.4. Rest of Latin America 15.3.2. By Product Type 15.3.3. By Technology 15.3.4. By End User 15.4. Market Attractiveness Analysis 15.4.1. By Country 15.4.2. By Product Type 15.4.3. By Technology 15.4.4. By End User 15.5. Market Trends 15.6. Key Market Participants - Intensity Mapping 15.7. Drivers and Restraints - Impact Analysis 15.8. Country Level Analysis & Forecast 15.8.1. Brazil Market Analysis 15.8.1.1. Introduction 15.8.1.2. Market Analysis and Forecast by Market Taxonomy 15.8.1.2.1. By Product Type 15.8.1.2.2. By Technology 15.8.1.2.3. By End User 15.8.2. Mexico Market Analysis 15.8.2.1. Introduction 15.8.2.2. Market Analysis and Forecast by Market Taxonomy 15.8.2.2.1. By Product Type 15.8.2.2.2. By Technology 15.8.2.2.3. By End User 15.8.3. Argentina Market Analysis 15.8.3.1. Introduction 15.8.3.2. Market Analysis and Forecast by Market Taxonomy 15.8.3.2.1. By Product Type 15.8.3.2.2. By Technology 15.8.3.2.3. By End User 15.8.4. Rest of the Latin America Market Analysis 15.8.4.1. Introduction 15.8.4.2. Market Analysis and Forecast by Market Taxonomy 15.8.4.2.1. By Product Type 15.8.4.2.2. By Technology 15.8.4.2.3. By End User 16. Europe Market Analysis 2015–2021 and Forecast 2022–2032 16.1. Introduction 16.2. Historical Market Size (US$ Mn) and Volume (Units) Trend Analysis By Market Taxonomy, 2015–2021 16.3. Market Size (US$ Mn) and Volume (Units) Forecast By Market Taxonomy, 2022–2032 16.3.1. By Country 16.3.1.1. Germany 16.3.1.2. Italy 16.3.1.3. France 16.3.1.4. U.K. 16.3.1.5. Spain 16.3.1.6. Poland 16.3.1.7. Russia 16.3.1.8. Rest of Europe 16.3.2. By Product Type 16.3.3. By Technology 16.3.4. By End User 16.4. Market Attractiveness Analysis 16.4.1. By Country 16.4.2. By Product Type 16.4.3. By Technology 16.4.4. By End User 16.5. Market Trends 16.6. Key Market Participants - Intensity Mapping 16.7. Drivers and Restraints - Impact Analysis 16.8. Country Level Analysis & Forecast 16.8.1. Germany Market Analysis 16.8.1.1. Introduction 16.8.1.2. Market Analysis and Forecast by Market Taxonomy 16.8.1.2.1. By Product Type 16.8.1.2.2. By Technology 16.8.1.2.3. By End User 16.8.2. Italy Market Analysis 16.8.2.1. Introduction 16.8.2.2. Market Analysis and Forecast by Market Taxonomy 16.8.2.2.1. By Product Type 16.8.2.2.2. By Technology 16.8.2.2.3. By End User 16.8.3. France Market Analysis 16.8.3.1. Introduction 16.8.3.2. Market Analysis and Forecast by Market Taxonomy 16.8.3.2.1. By Product Type 16.8.3.2.2. By Technology 16.8.3.2.3. By End User 16.8.4. U.K. Market Analysis 16.8.4.1. Introduction 16.8.4.2. Market Analysis and Forecast by Market Taxonomy 16.8.4.2.1. By Product Type 16.8.4.2.2. By Technology 16.8.4.2.3. By End User 16.8.5. Spain Market Analysis 16.8.5.1. Introduction 16.8.5.2. Market Analysis and Forecast by Market Taxonomy 16.8.5.2.1. By Product Type 16.8.5.2.2. By Technology 16.8.5.2.3. By End User 16.8.6. Poland Market Analysis 16.8.6.1. Introduction 16.8.6.2. Market Analysis and Forecast by Market Taxonomy 16.8.6.2.1. By Product Type 16.8.6.2.2. By Technology 16.8.6.2.3. By End User 16.8.7. Russia Market Analysis 16.8.7.1. Introduction 16.8.7.2. Market Analysis and Forecast by Market Taxonomy 16.8.7.2.1. By Product Type 16.8.7.2.2. By Technology 16.8.7.2.3. By End User 17. South Asia Market Analysis 2015–2021 and Forecast 2022–2032 17.1. Introduction 17.2. Historical Market Size (US$ Mn) and Volume (Units) Trend Analysis By Market Taxonomy, 2015–2021 17.3. Market Size (US$ Mn) and Volume (Units) Forecast By Market Taxonomy, 2022–2032 17.3.1. By Country 17.3.1.1. India 17.3.1.2. Indonesia 17.3.1.3. Malaysia 17.3.1.4. Thailand 17.3.1.5. Rest of South Asia 17.3.2. By Product Type 17.3.3. By Technology 17.3.4. By End User 17.4. Market Attractiveness Analysis 17.4.1. By Country 17.4.2. By Product Type 17.4.3. By Technology 17.4.4. By End User 17.5. Market Trends 17.6. Key Market Participants - Intensity Mapping 17.7. Drivers and Restraints - Impact Analysis 17.8. Country Level Analysis & Forecast 17.8.1. India Market Analysis 17.8.1.1. Introduction 17.8.1.2. Market Analysis and Forecast by Market Taxonomy 17.8.1.2.1. By Product Type 17.8.1.2.2. By Technology 17.8.1.2.3. By End User 17.8.2. Indonesia Market Analysis 17.8.2.1. Introduction 17.8.2.2. Market Analysis and Forecast by Market Taxonomy 17.8.2.2.1. By Product Type 17.8.2.2.2. By Technology 17.8.2.2.3. By End User 17.8.3. Malaysia Market Analysis 17.8.3.1. Introduction 17.8.3.2. Market Analysis and Forecast by Market Taxonomy 17.8.3.2.1. By Product Type 17.8.3.2.2. By Technology 17.8.3.2.3. By End User 17.8.4. Thailand Market Analysis 17.8.4.1. Introduction 17.8.4.2. Market Analysis and Forecast by Market Taxonomy 17.8.4.2.1. By Product Type 17.8.4.2.2. By Technology 17.8.4.2.3. By End User 17.8.5. Rest of South Asia Market Analysis 17.8.5.1. Introduction 17.8.5.2. Market Analysis and Forecast by Market Taxonomy 17.8.5.2.1. By Product Type 17.8.5.2.2. By Technology 17.8.5.2.3. By End User 18. East Asia Market Analysis 2015–2021 and Forecast 2022–2032 18.1. Introduction 18.2. Historical Market Size (US$ Mn) and Volume (Units) Trend Analysis By Market Taxonomy, 2015–2021 18.3. Market Size (US$ Mn) and Volume (Units) Forecast By Market Taxonomy, 2022–2032 18.3.1. By Country 18.3.1.1. China 18.3.1.2. Japan 18.3.1.3. South Korea 18.3.2. By Product Type 18.3.3. By Technology 18.3.4. By End User 18.4. Market Attractiveness Analysis 18.4.1. By Country 18.4.2. By Product Type 18.4.3. By Technology 18.4.4. By End User 18.5. Market Trends 18.6. Key Market Participants - Intensity Mapping 18.7. Drivers and Restraints - Impact Analysis 18.8. Country Level Analysis & Forecast 18.8.1. China Market Analysis 18.8.1.1. Introduction 18.8.1.2. Market Analysis and Forecast by Market Taxonomy 18.8.1.2.1. By Product Type 18.8.1.2.2. By Technology 18.8.1.2.3. By End User 18.8.2. Japan Market Analysis 18.8.2.1. Introduction 18.8.2.2. Market Analysis and Forecast by Market Taxonomy 18.8.2.2.1. By Product Type 18.8.2.2.2. By Technology 18.8.2.2.3. By End User 18.8.3. South Korea Market Analysis 18.8.3.1. Introduction 18.8.3.2. Market Analysis and Forecast by Market Taxonomy 18.8.3.2.1. By Product Type 18.8.3.2.2. By Technology 18.8.3.2.3. By End User 19. Oceania Market 2015-2021 and Forecast 2022-2032 19.1. Introduction 19.2. Historical Market Size (US$ Mn) and Volume (Units) Trend Analysis By Market Taxonomy, 2015–2021 19.3. Market Size (US$ Mn) and Volume (Units) Forecast By Market Taxonomy, 2022–2032 19.3.1. By Country 19.3.1.1. Australia 19.3.1.2. New Zealand 19.3.2. By Product Type 19.3.3. By Technology 19.3.4. By End User 19.4. Market Attractiveness Analysis 19.4.1. By Country 19.4.2. By Product Type 19.4.3. By Technology 19.4.4. By End User 19.5. Market Trends 19.6. Key Market Participants - Intensity Mapping 19.7. Drivers and Restraints - Impact Analysis 19.8. Country Level Analysis & Forecast 19.8.1. Australia Market Analysis 19.8.1.1. Introduction 19.8.1.2. Market Analysis and Forecast by Market Taxonomy 19.8.1.2.1. By Product Type 19.8.1.2.2. By Technology 19.8.1.2.3. By End User 19.8.2. New Zealand Market Analysis 19.8.2.1. Introduction 19.8.2.2. Market Analysis and Forecast by Market Taxonomy 19.8.2.2.1. By Product Type 19.8.2.2.2. By Technology 19.8.2.2.3. By End User 20. Middle East and Africa (MEA) Market Analysis 2015–2021 and Forecast 2022–2032 20.1. Introduction 20.2. Historical Market Size (US$ Mn) and Volume (Units) Trend Analysis By Market Taxonomy, 2015–2021 20.3. Market Size (US$ Mn) and Volume (Units) Forecast By Market Taxonomy, 2022–2032 20.3.1. By Country 20.3.1.1. Turkey 20.3.1.2. GCC Countries 20.3.1.3. South Africa 20.3.1.4. North Africa 20.3.1.5. Rest of Middle East and Africa 20.3.2. By Product Type 20.3.3. By Technology 20.3.4. By End User 20.4. Market Attractiveness Analysis 20.4.1. By Country 20.4.2. By Product Type 20.4.3. By Technology 20.4.4. By End User 20.5. Market Trends 20.6. Key Market Participants - Intensity Mapping 20.7. Drivers and Restraints - Impact Analysis 20.8. Country Level Analysis & Forecast 20.8.1. Turkey Market Analysis 20.8.1.1. Introduction 20.8.1.2. Market Analysis and Forecast by Market Taxonomy 20.8.1.2.1. By Product Type 20.8.1.2.2. By Technology 20.8.1.2.3. By End User 20.8.2. GCC Countries Market Analysis 20.8.2.1. Introduction 20.8.2.2. Market Analysis and Forecast by Market Taxonomy 20.8.2.2.1. By Product Type 20.8.2.2.2. By Technology 20.8.2.2.3. By End User 20.8.3. South Africa Market Analysis 20.8.3.1. Introduction 20.8.3.2. Market Analysis and Forecast by Market Taxonomy 20.8.3.2.1. By Product Type 20.8.3.2.2. By Technology 20.8.3.2.3. By End User 20.8.4. North Africa Market Analysis 20.8.4.1. Introduction 20.8.4.2. Market Analysis and Forecast by Market Taxonomy 20.8.4.2.1. By Product Type 20.8.4.2.2. By Technology 20.8.4.2.3. By End User 20.8.5. Rest of MEA Market Analysis 20.8.5.1. Introduction 20.8.5.2. Market Analysis and Forecast by Market Taxonomy 20.8.5.2.1. By Product Type 20.8.5.2.2. By Technology 20.8.5.2.3. By End User 21. Market Structure Analysis 21.1. Market Analysis by Tier of Companies 21.2. Market Share Analysis of Top Players 21.3. Market Presence Analysis 21.3.1. By Regional footprint of Players 21.3.2. Product footprint by Players 21.3.3. Channel Foot Print by Players 22. Competition Analysis 22.1. Competition Dashboard 22.2. Competition Benchmarking 22.3. Competition Deep Dive (Tentative List) 22.3.1. Becton, Dickinson and Company 22.3.1.1. Overview 22.3.1.2. Product Portfolio 22.3.1.3. Key Financials 22.3.1.4. Sales Footprint 22.3.1.5. Strategy Overview 22.3.2. B. Braun Melsungen AG 22.3.2.1. Overview 22.3.2.2. Product Portfolio 22.3.2.3. Key Financials 22.3.2.4. Sales Footprint 22.3.2.5. Strategy Overview 22.3.3. Smiths Group plc. 22.3.3.1. Overview 22.3.3.2. Product Portfolio 22.3.3.3. Key Financials 22.3.3.4. Sales Footprint 22.3.3.5. Strategy Overview 22.3.4. Terumo Corporation 22.3.4.1. Overview 22.3.4.2. Product Portfolio 22.3.4.3. Key Financials 22.3.4.4. Sales Footprint 22.3.4.5. Strategy Overview 22.3.5. Venner Medical 22.3.5.1. Overview 22.3.5.2. Product Portfolio 22.3.5.3. Key Financials 22.3.5.4. Sales Footprint 22.3.5.5. Strategy Overview 22.3.6. Vygon 22.3.6.1. Overview 22.3.6.2. Product Portfolio 22.3.6.3. Key Financials 22.3.6.4. Sales Footprint 22.3.6.5. Strategy Overview 22.3.7. Teleflex Incorporated 22.3.7.1. Overview 22.3.7.2. Product Portfolio 22.3.7.3. Key Financials 22.3.7.4. Sales Footprint 22.3.7.5. Strategy Overview 22.3.8. C. R. Bard, Inc. 22.3.8.1. Overview 22.3.8.2. Product Portfolio 22.3.8.3. Key Financials 22.3.8.4. Sales Footprint 22.3.8.5. Strategy Overview 22.3.9. NIPRO Medical Corporation 22.3.9.1. Overview 22.3.9.2. Product Portfolio 22.3.9.3. Key Financials 22.3.9.4. Sales Footprint 22.3.9.5. Strategy Overview 22.3.10. Argon Medical Devices, Inc. 22.3.10.1. Overview 22.3.10.2. Product Portfolio 22.3.10.3. Key Financials 22.3.10.4. Sales Footprint 22.3.10.5. Strategy Overview 23. Assumptions and Acronyms Used 24. Research Methodology
Let us know your requirement to get
100% FREE customization
List of Tables
Table 01: Global Market Value (US$ Mn) Analysis and Forecast 2015–2032, by Product type Table 02: Global Market Volume (Units) Analysis and Forecast 2015–2032, by Product type Table 03: Global Market Value (US$ Mn) Analysis and Forecast 2015–2032, by Technology Table 04: Global Market Value (US$ Mn) Analysis and Forecast 2015–2032, by End User Table 05: Global Market Value (US$ Mn) Analysis and Forecast 2015–2032, by Region Table 06: North America Market Value (US$ Mn) Analysis 2015-2021 and Forecast 2022–2032, by Country Table 07: North America Market Value (US$ Mn) Analysis and Forecast 2015–2032, by Product type Table 08: North America Market Volume (Units) Analysis and Forecast 2015–2032, by Product type Table 09: North America Market Value (US$ Mn) Analysis and Forecast 2015–2032, by Technology Table 10: North America Market Value (US$ Mn) Analysis and Forecast 2015–2032, by End User Table 11: Latin America Market Value (US$ Mn) Analysis 2015-2021 and Forecast 2022–2032, by Country Table 12: Latin America Market Value (US$ Mn) Analysis and Forecast 2015–2032, by Product type Table 13: Latin America Market Volume (Units) Analysis and Forecast 2015–2032, by Product type Table 14: Latin America Market Value (US$ Mn) Analysis and Forecast 2015–2032, by Technology Table 15: Latin America Market Value (US$ Mn) Analysis and Forecast 2015–2032, by End User Table 16: Europe Market Value (US$ Mn) Analysis 2015-2021 and Forecast 2022–2032, by Country Table 17: Europe Market Value (US$ Mn) Analysis and Forecast 2015–2032, by Product type Table 18: Europe Market Volume (Units) Analysis and Forecast 2015–2032, by Product type Table 19: Europe Market Value (US$ Mn) Analysis and Forecast 2015–2032, by Technology Table 20: Europe Market Value (US$ Mn) Analysis and Forecast 2015–2032, by End User Table 21: South Asia Market Value (US$ Mn) Analysis 2015-2021 and Forecast 2022–2032, by Country Table 22: South Asia Market Value (US$ Mn) Analysis and Forecast 2015–2032, by Product type Table 23: South Asia Market Volume (Units) Analysis and Forecast 2015–2032, by Product type Table 24: South Asia Market Value (US$ Mn) Analysis and Forecast 2015–2032, by Technology Table 25: South Asia Market Value (US$ Mn) Analysis and Forecast 2015–2032, by End User Table 26: East Asia Market Value (US$ Mn) Analysis 2015-2021 and Forecast 2022–2032, by Country Table 27: East Asia Market Value (US$ Mn) Analysis and Forecast 2015–2032, by Product type Table 28: East Asia Market Volume (Units) Analysis and Forecast 2015–2032, by Product type Table 29: East Asia Market Value (US$ Mn) Analysis and Forecast 2015–2032, by Technology Table 30: East Asia Market Value (US$ Mn) Analysis and Forecast 2015–2032, by End User Table 31: Oceania Market Value (US$ Mn) Analysis 2015-2021 and Forecast 2022–2032, by Country Table 32: Oceania Market Value (US$ Mn) Analysis and Forecast 2015–2032, by Product type Table 33: Oceania Market Volume (Units) Analysis and Forecast 2015–2032, by Product type Table 34: Oceania Market Value (US$ Mn) Analysis and Forecast 2015–2032, by Technology Table 35: Oceania Market Value (US$ Mn) Analysis and Forecast 2015–2032, by End User Table 36: MEA Market Value (US$ Mn) Analysis 2015-2021 and Forecast 2022–2032, by Country Table 37: MEA Market Value (US$ Mn) Analysis and Forecast 2015–2032, by Product type Table 38: MEA Market Volume (Units) Analysis and Forecast 2015–2032, by Product type Table 39: MEA Market Value (US$ Mn) Analysis and Forecast 2015–2032, by Technology Table 40: MEA Market Value (US$ Mn) Analysis and Forecast 2015–2032, by End User
Find your sweet spots for generating winning opportunities in this market.
Talk to AnalystList of Charts
Figure 01: Global Market Volume (Units), 2015-2021 Figure 02: Global Market Volume (Units) & Y-o-Y Growth (%) Analysis, 2022–2032 Figure 03: Peripheral Intravenous Catheters, Pricing Analysis per unit (US$), in 2022 Figure 04: Peripheral Intravenous Catheters, Pricing Forecast per unit (US$), in 2032 Figure 05: Global Market Value (US$ Mn) Analysis, 2015-2021 Figure 06: Global Market Forecast & Y-o-Y Growth, 2022–2032 Figure 07: Global Market Absolute $ Opportunity (US$ Mn) Analysis, 2021–2032 Figure 08: Global Market Value Share (%) Analysis 2022 and 2032, by Product type Figure 09: Global Market Y-o-Y Growth (%) Analysis 2021-2032, by Product type Figure 10: Global Market Attractiveness Analysis 2022–2032, by Product type Figure 11: Global Market Value Share (%) Analysis 2022 and 2032, by Technology Figure 12: Global Market Y-o-Y Growth (%) Analysis 2021-2032, by Technology Figure 13: Global Market Attractiveness Analysis 2022–2032, by Technology Figure 14: Global Market Value Share (%) Analysis 2022 and 2032, by End User Figure 15: Global Market Y-o-Y Growth (%) Analysis 2021-2032, by End User Figure 16: Global Market Attractiveness Analysis 2022–2032, by End User Figure 17: Global Market Value Share (%) Analysis 2022 and 2032, by Region Figure 18: Global Market Y-o-Y Growth (%) Analysis 2021-2032, by Region Figure 19: Global Market Attractiveness Analysis 2022–2032, by Region Figure 20: North America Market Value (US$ Mn) Analysis, 2015-2021 Figure 21: North America Market Value (US$ Mn) Forecast, 2022-2032 Figure 22: North America Market Value Share, by Product type (2022 E) Figure 23: North America Market Value Share, by Technology (2022 E) Figure 24: North America Market Value Share, by End User (2022 E) Figure 25: North America Market Value Share, by Country (2022 E) Figure 26: North America Market Attractiveness Analysis by Product type, 2022–2032 Figure 27: North America Market Attractiveness Analysis by Technology, 2022–2032 Figure 28: North America Market Attractiveness Analysis by End User, 2022–2032 Figure 29: North America Market Attractiveness Analysis by Country, 2022–2032 Figure 30: U.S. Market Value Proportion Analysis, 2021 Figure 31: Global Vs. U.S. Growth Comparison Figure 32: U.S. Market Share Analysis (%) by Product type, 2021 & 2032 Figure 33: U.S. Market Share Analysis (%) by Technology, 2021 & 2032 Figure 34: U.S. Market Share Analysis (%) by End User, 2021 & 2032 Figure 35: Canada Market Value Proportion Analysis, 2021 Figure 36: Global Vs. Canada. Growth Comparison Figure 37: Canada Market Share Analysis (%) by Product type, 2021 & 2032 Figure 38: Canada Market Share Analysis (%) by Technology, 2021 & 2032 Figure 39: Canada Market Share Analysis (%) by End User, 2021 & 2032 Figure 40: Latin America Market Value (US$ Mn) Analysis, 2015-2021 Figure 41: Latin America Market Value (US$ Mn) Forecast, 2022-2032 Figure 42: Latin America Market Value Share, by Product type (2022 E) Figure 43: Latin America Market Value Share, by Technology (2022 E) Figure 44: Latin America Market Value Share, by End User (2022 E) Figure 45: Latin America Market Value Share, by Country (2022 E) Figure 46: Latin America Market Attractiveness Analysis by Product type, 2022–2032 Figure 47: Latin America Market Attractiveness Analysis by Technology, 2022–2032 Figure 48: Latin America Market Attractiveness Analysis by End User, 2022–2032 Figure 49: Latin America Market Attractiveness Analysis by Country, 2022–2032 Figure 50: Mexico Market Value Proportion Analysis, 2021 Figure 51: Global Vs Mexico Growth Comparison Figure 52: Mexico Market Share Analysis (%) by Product type, 2021 & 2032 Figure 53: Mexico Market Share Analysis (%) by Technology, 2021 & 2032 Figure 54: Mexico Market Share Analysis (%) by End User, 2021 & 2032 Figure 55: Brazil Market Value Proportion Analysis, 2021 Figure 56: Global Vs. Brazil. Growth Comparison Figure 57: Brazil Market Share Analysis (%) by Product type, 2021 & 2032 Figure 58: Brazil Market Share Analysis (%) by Technology, 2021 & 2032 Figure 59: Brazil Market Share Analysis (%) by End User, 2021 & 2032 Figure 60: Argentina Market Value Proportion Analysis, 2021 Figure 61: Global Vs Argentina Growth Comparison Figure 62: Argentina Market Share Analysis (%) by Product type, 2021 & 2032 Figure 63: Argentina Market Share Analysis (%) by Technology, 2021 & 2032 Figure 64: Argentina Market Share Analysis (%) by End User, 2021 & 2032 Figure 65: Europe Market Value (US$ Mn) Analysis, 2015-2021 Figure 66: Europe Market Value (US$ Mn) Forecast, 2022-2032 Figure 67: Europe Market Value Share, by Product type (2022 E) Figure 68: Europe Market Value Share, by Technology (2022 E) Figure 69: Europe Market Value Share, by End User (2022 E) Figure 70: Europe Market Value Share, by Country (2022 E) Figure 71: Europe Market Attractiveness Analysis by Product type, 2022–2032 Figure 72: Europe Market Attractiveness Analysis by Technology, 2022–2032 Figure 73: Europe Market Attractiveness Analysis by End User, 2022–2032 Figure 74: Europe Market Attractiveness Analysis by Country, 2022–2032 Figure 75: UK Market Value Proportion Analysis, 2021 Figure 76: Global Vs. UK Growth Comparison Figure 77: UK Market Share Analysis (%) by Product type, 2021 & 2032 Figure 78: UK Market Share Analysis (%) by Technology, 2021 & 2032 Figure 79: UK Market Share Analysis (%) by End User, 2021 & 2032 Figure 80: Germany Market Value Proportion Analysis, 2021 Figure 81: Global Vs. Germany Growth Comparison Figure 82: Germany Market Share Analysis (%) by Product type, 2021 & 2032 Figure 83: Germany Market Share Analysis (%) by Technology, 2021 & 2032 Figure 84: Germany Market Share Analysis (%) by End User, 2021 & 2032 Figure 85: Italy Market Value Proportion Analysis, 2021 Figure 86: Global Vs. Italy Growth Comparison Figure 87: Italy Market Share Analysis (%) by Product type, 2021 & 2032 Figure 88: Italy Market Share Analysis (%) by Technology, 2021 & 2032 Figure 89: Italy Market Share Analysis (%) by End User, 2021 & 2032 Figure 90: France Market Value Proportion Analysis, 2021 Figure 91: Global Vs France Growth Comparison Figure 92: France Market Share Analysis (%) by Product type, 2021 & 2032 Figure 93: France Market Share Analysis (%) by Technology, 2021 & 2032 Figure 94: France Market Share Analysis (%) by End User, 2021 & 2032 Figure 95: Spain Market Value Proportion Analysis, 2021 Figure 96: Global Vs Spain Growth Comparison Figure 97: Spain Market Share Analysis (%) by Product type, 2021 & 2032 Figure 98: Spain Market Share Analysis (%) by Technology, 2021 & 2032 Figure 99: Spain Market Share Analysis (%) by End User, 2021 & 2032 Figure 100: Russia Market Value Proportion Analysis, 2021 Figure 101: Global Vs Russia Growth Comparison Figure 102: Russia Market Share Analysis (%) by Product type, 2021 & 2032 Figure 103: Russia Market Share Analysis (%) by Technology, 2021 & 2032 Figure 104: Russia Market Share Analysis (%) by End User, 2021 & 2032 Figure 105: BENELUX Market Value Proportion Analysis, 2021 Figure 106: Global Vs BENELUX Growth Comparison Figure 107: BENELUX Market Share Analysis (%) by Product type, 2021 & 2032 Figure 108: BENELUX Market Share Analysis (%) by Technology, 2021 & 2032 Figure 109: BENELUX Market Share Analysis (%) by End User, 2021 & 2032 Figure 110: East Asia Market Value (US$ Mn) Analysis, 2015-2021 Figure 111: East Asia Market Value (US$ Mn) Forecast, 2022-2032 Figure 112: East Asia Market Value Share, by Product type (2022 E) Figure 113: East Asia Market Value Share, by Technology (2022 E) Figure 114: East Asia Market Value Share, by End User (2022 E) Figure 115: East Asia Market Value Share, by Country (2022 E) Figure 116: East Asia Market Attractiveness Analysis by Product type, 2022–2032 Figure 117: East Asia Market Attractiveness Analysis by Technology, 2022–2032 Figure 118: East Asia Market Attractiveness Analysis by End User, 2022–2032 Figure 119: East Asia Market Attractiveness Analysis by Country, 2022–2032 Figure 120: China Market Value Proportion Analysis, 2021 Figure 121: Global Vs. China Growth Comparison Figure 122: China Market Share Analysis (%) by Product type, 2021 & 2032 Figure 123: China Market Share Analysis (%) by Technology, 2021 & 2032 Figure 124: China Market Share Analysis (%) by End User, 2021 & 2032 Figure 125: Japan Market Value Proportion Analysis, 2021 Figure 126: Global Vs. Japan Growth Comparison Figure 127: Japan Market Share Analysis (%) by Product type, 2021 & 2032 Figure 128: Japan Market Share Analysis (%) by Technology, 2021 & 2032 Figure 129: Japan Market Share Analysis (%) by End User, 2021 & 2032 Figure 130: South Korea Market Value Proportion Analysis, 2021 Figure 131: Global Vs South Korea Growth Comparison Figure 132: South Korea Market Share Analysis (%) by Product type, 2021 & 2032 Figure 133: South Korea Market Share Analysis (%) by Technology, 2021 & 2032 Figure 134: South Korea Market Share Analysis (%) by End User, 2021 & 2032 Figure 135: South Asia Market Value (US$ Mn) Analysis, 2015-2021 Figure 136: South Asia Market Value (US$ Mn) Forecast, 2022-2032 Figure 137: South Asia Market Value Share, by Product type (2022 E) Figure 138: South Asia Market Value Share, by Technology (2022 E) Figure 139: South Asia Market Value Share, by End User (2022 E) Figure 140: South Asia Market Value Share, by Country (2022 E) Figure 141: South Asia Market Attractiveness Analysis by Product type, 2022–2032 Figure 142: South Asia Market Attractiveness Analysis by Technology, 2022–2032 Figure 143: South Asia Market Attractiveness Analysis by End User, 2022–2032 Figure 144: South Asia Market Attractiveness Analysis by Country, 2022–2032 Figure 145: India Market Value Proportion Analysis, 2021 Figure 146: Global Vs. India Growth Comparison Figure 147: India Market Share Analysis (%) by Product type, 2021 & 2032 Figure 148: India Market Share Analysis (%) by Technology, 2021 & 2032 Figure 149: India Market Share Analysis (%) by End User, 2021 & 2032 Figure 150: Indonesia Market Value Proportion Analysis, 2021 Figure 151: Global Vs. Indonesia Growth Comparison Figure 152: Indonesia Market Share Analysis (%) by Product type, 2021 & 2032 Figure 153: Indonesia Market Share Analysis (%) by Technology, 2021 & 2032 Figure 154: Indonesia Market Share Analysis (%) by End User, 2021 & 2032 Figure 155: Malaysia Market Value Proportion Analysis, 2021 Figure 156: Global Vs. Malaysia Growth Comparison Figure 157: Malaysia Market Share Analysis (%) by Product type, 2021 & 2032 Figure 158: Malaysia Market Share Analysis (%) by Technology, 2021 & 2032 Figure 159: Malaysia Market Share Analysis (%) by End User, 2021 & 2032 Figure 160: Thailand Market Value Proportion Analysis, 2021 Figure 161: Global Vs. Thailand Growth Comparison Figure 162: Thailand Market Share Analysis (%) by Product type, 2021 & 2032 Figure 163: Thailand Market Share Analysis (%) by Technology, 2021 & 2032 Figure 164: Thailand Market Share Analysis (%) by End User, 2021 & 2032 Figure 165: Oceania Market Value (US$ Mn) Analysis, 2015-2021 Figure 166: Oceania Market Value (US$ Mn) Forecast, 2022-2032 Figure 167: Oceania Market Value Share, by Product type (2022 E) Figure 168: Oceania Market Value Share, by Technology (2022 E) Figure 169: Oceania Market Value Share, by End User (2022 E) Figure 170: Oceania Market Value Share, by Country (2022 E) Figure 171: Oceania Market Attractiveness Analysis by Product type, 2022–2032 Figure 172: Oceania Market Attractiveness Analysis by Technology, 2022–2032 Figure 173: Oceania Market Attractiveness Analysis by End User, 2022–2032 Figure 174: Oceania Market Attractiveness Analysis by Country, 2022–2032 Figure 175: Australia Market Value Proportion Analysis, 2021 Figure 176: Global Vs. Australia Growth Comparison Figure 177: Australia Market Share Analysis (%) by Product type, 2021 & 2032 Figure 178: Australia Market Share Analysis (%) by Technology, 2021 & 2032 Figure 179: Australia Market Share Analysis (%) by End User, 2021 & 2032 Figure 180: New Zealand Market Value Proportion Analysis, 2021 Figure 181: Global Vs New Zealand Growth Comparison Figure 182: New Zealand Market Share Analysis (%) by Product type, 2021 & 2032 Figure 183: New Zealand Market Share Analysis (%) by Technology, 2021 & 2032 Figure 184: New Zealand Market Share Analysis (%) by End User, 2021 & 2032 Figure 185: Middle East & Africa Market Value (US$ Mn) Analysis, 2015-2021 Figure 186: Middle East & Africa Market Value (US$ Mn) Forecast, 2022-2032 Figure 187: Middle East & Africa Market Value Share, by Product type (2022 E) Figure 188: Middle East & Africa Market Value Share, by Technology (2022 E) Figure 189: Middle East & Africa Market Value Share, by End User (2022 E) Figure 190: Middle East & Africa Market Value Share, by Country (2022 E) Figure 191: Middle East & Africa Market Attractiveness Analysis by Product type, 2022–2032 Figure 192: Middle East & Africa Market Attractiveness Analysis by Technology, 2022–2032 Figure 193: Middle East & Africa Market Attractiveness Analysis by End User, 2022–2032 Figure 194: Middle East & Africa Market Attractiveness Analysis by Country, 2022–2032 Figure 195: GCC Countries Market Value Proportion Analysis, 2021 Figure 196: Global Vs GCC Countries Growth Comparison Figure 197: GCC Countries Market Share Analysis (%) by Product type, 2021 & 2032 Figure 198: GCC Countries Market Share Analysis (%) by Technology, 2021 & 2032 Figure 199: GCC Countries Market Share Analysis (%) by End User, 2021 & 2032 Figure 200: Turkey Market Value Proportion Analysis, 2021 Figure 201: Global Vs. Turkey Growth Comparison Figure 202: Turkey Market Share Analysis (%) by Product type, 2021 & 2032 Figure 203: Turkey Market Share Analysis (%) by Technology, 2021 & 2032 Figure 204: Turkey Market Share Analysis (%) by End User, 2021 & 2032 Figure 205: South Africa Market Value Proportion Analysis, 2021 Figure 206: Global Vs. South Africa Growth Comparison Figure 207: South Africa Market Share Analysis (%) by Product type, 2021 & 2032 Figure 208: South Africa Market Share Analysis (%) by Technology, 2021 & 2032 Figure 209: South Africa Market Share Analysis (%) by End User, 2021 & 2032 Figure 210: North Africa Market Value Proportion Analysis, 2021 Figure 211: Global Vs North Africa Growth Comparison Figure 212: North Africa Market Share Analysis (%) by Product type, 2021 & 2032 Figure 213: North Africa Market Share Analysis (%) by Technology, 2021 & 2032 Figure 214: North Africa Market Share Analysis (%) by End User, 2021 & 2032
Need specific information?
Request CustomizationExplore Healthcare Insights
View Reports