Environment Health and Safety Market Outlook 2024 to 2034

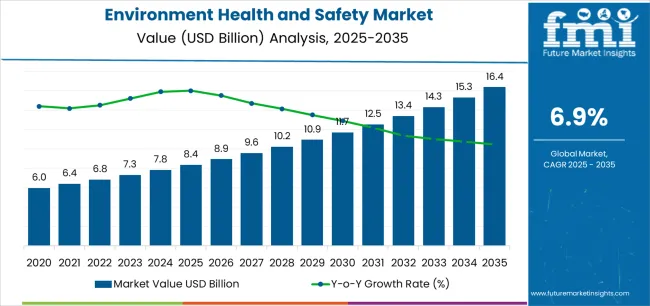
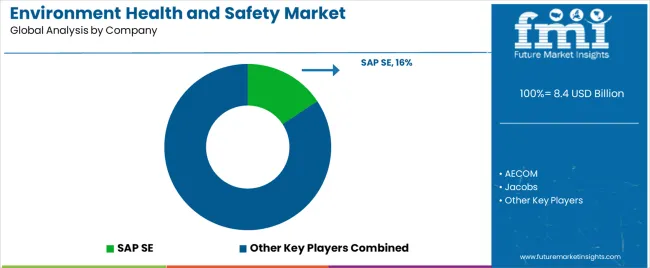
The global environment health and safety market is estimated to reach a valuation of US$ 7.8 billion in 2024 and is projected to be worth US$ 15.8 billion by 2034, reflecting a CAGR of 7.3% over the assessment period.

Environment Health and Safety Market Trends and Drivers

  • Rising public concerns about environmental issues have resulted in the establishment of environmental protection laws, which is increasing the demand for environmental health and safety solutions.
  • The presence of research and development centers, favorable market growth policies, and increasing investments for operational efficiency are propelling operational efficiency.
  • ‘Zero Incidents’ or ‘Zero Harm’ is the new standard for brilliance in health and safety management. As a result, several companies are striving to conduct their operations with zero harm to people and the environment.
  • Expansion of oil and gas extraction industries is raising the demand for environment health and safety (EHS) services, as this sector utilizes these services to adhere to regulations and ascertain employee health and safety.
  • Growing focus on environmental impact as international environmental multilateral and bilateral agreements increase.
Attributes Key Insights
Estimated Environment Health and Safety Market Size (2024E) US$ 7.8 billion
Projected Environment Health and Safety Market Value (2034F) US$ 15.8 billion
Value-based CAGR (2024 to 2034) 7.3%

Don't pay for what you don't need

Customize your report by selecting specific countries or regions and save 30%!

Emerging Opportunities in the Environment Health and Safety Market

  • Rising government initiatives to reduce carbon emissions are increasing the demand for environment health and safety solutions.
  • Market players are expected to concentrate on regions with surging EHS regulations, expanding industries, and surging awareness about environmental and safety issues.
  • Acceleration in the integration of IoT, AI, and big data analytics into EHS products to enable real-time monitoring, data-driven insights, and predictive maintenance for risk management.

Adjacent Markets Overview

The table below offers a comparative outlook of three markets, including the main market. The other two markets are environment testing, inspection, and certification market and testing, inspection and certification market. These markets focus on inspection services to ensure product quality and different claims by the product brand.

Out of these markets, environment health and safety market is projected to register a higher growth rate of 7.3% CAGR through 2034. As more companies operating in different domains are setting their sustainability goals, demand for environmental health and safety management systems is expected to rise.

Environment Health and Safety Market:

Attributes Environment Health and Safety Market
CAGR (2024 to 2034) 7.3%
Growth Factor Increasing prioritization of sustainability among companies
Opportunity Rising government initiatives to ascertain workforce safety by mandating environmental standards and regulations
Key Trends Growing demand for cloud-based environment health and safety solutions

Environment Testing, Inspection, and Certification Market:

Attributes Environment Testing, Inspection, and Certification Market
CAGR (2024 to 2034) 6.5%
Growth Factor Increasing consumer awareness about product quality owing to the deterioration of resources like soil and water continues
Opportunity Accelerating efforts by private and public organizations to promote environment protection
Key Trends Surging demand for soil inspection

Testing, Inspection, and Certification Market:

Attributes Testing, Inspection, and Certification Market
CAGR (2024 to 2034) 5.30%
Growth Factor Growing demand for services that include vigorous testing and certification procedures to ascertain the integrity of nanoparticles, nanomaterials, and nano-devices
Opportunity Increasing emphasis on sustainability is projected to create heightened demand for biodegradability testing
Key Trends Growing demand to ensure quality control of additive manufacturing.
Nikhil Kaitwade
Nikhil Kaitwade

Principal Consultant

Talk to Analyst

Find your sweet spots for generating winning opportunities in this market.

Environment Health and Safety Industry Analysis by Country

The United States and China are the top consumers of environment health and safety services or software. These countries are expected to register moderate sales prospects throughout the forecast period. Meanwhile, the market is set to exhibit a promising future in countries like the United Kingdom and Japan.

South Korea is projected to emerge as a lucrative market for environment health and safety (EHS). Proactive investors and manufacturers are anticipated to set their foot in the country to increase their revenue.

Countries Forecasted CAGR (2024 to 2034)
The United States 7.60%
The United Kingdom 8.30%
China 7.90%
Japan 8.30%
South Korea 9.10%

Market Outlook in the United States

The environment health and safety industry in the United States is anticipated to account for a value of US$ 2.8 billion by 2034. The market is projected to reach a 7.6% CAGR through 2034. Factors propelling the growth are:

  • Wide presence of oil and gas extraction industries in the United States, which employ EHS services to comply with regulations and ascertain the health and safety of their employees.
  • Surging investments from industries in EHS IT software to adhere to EPA and OSHA regulations.
  • The growing strictness and complexity of environmental and safety regulations are raising the demand for specialized services and software.

Growth Prospects in the United Kingdom

The market value of environment health and safety in the United Kingdom is estimated to reach US$ 641.3 million by 2034. Through the forecast period, the demand is projected to increase at a CAGR of 8.3%. Factors increasing the market growth are:

  • Increasing the use of environmental health and safety software and services to gradually eliminate the present take-make-dispose model and optimize the use of raw resources.
  • Rising demand for EHS software and services owing to strict environmental standards followed in the country.
  • Surging pressure from the authoritative bodies to motivate leading companies to employ recycling technologies by adopting EHS software and services.

Profitable Avenues for the Environment Health and Safety Industry in China

The environment health and safety market in China is forecast to gather US$ 2.6 billion by 2034. From 2024 to 2034, the market is anticipated to increase at a CAGR of 7.9%. The top leading market growth factors are:
  • The government in China is concerned about intensifying environmental issues like deforestation, as well as soil, water, and air pollution originating from rapid industrialization. EHS services are thus increasing in demand due to their effective techniques and methods to overcome these challenges.
  • The surging financial burden from regulatory agencies is coercing businesses to enhance their operating processes and make them more eco-friendly.
  • Increasing pressure on management teams to deploy EHS software solutions owing to intensive scrutiny and strict standards to lower workplace accidents.

Opportunities Abound in Japan

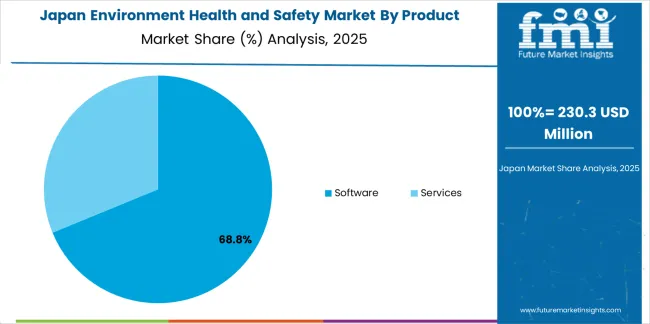
Revenue generation by the environment health and safety industry in Japan is anticipated to reach US$ 1.7 billion by 2034. Over the forecast period, the market is projected to extend at a pace of 8.3% CAGR.
  • Growth in industries like mining, pharmaceutical, construction, and manufacturing is increasing the user base of EHS services and software.
  • Mounting investments by industry players in research and development activities to expand their product portfolio of environmental health and safety services.
  • Rising eco-consciousness among consumers in Japan is contributing to heightened demand for products and services from firms with strong EHS practices.

South Korea to Offer Lucrative Growth

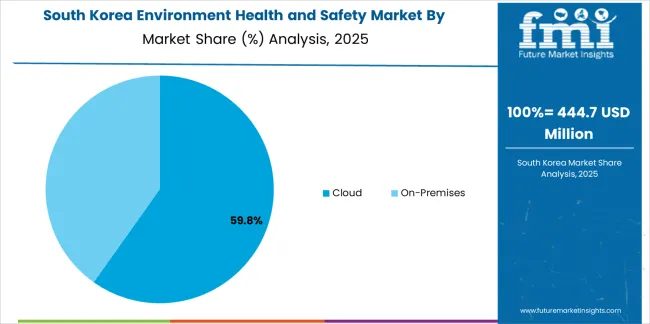
Key players in the EHS market in South Korea are predicted to generate a revenue of US$ 1.0 billion by 2034. The market is likely to register a CAGR of 9.1% through 2034. The following factors are contributing to market development:

  • The rising adoption of Industry 4.0 technologies like AI and robotics has necessitated stricter EHS measures to ensure worker safety and manage new risks.
  • Several companies are deploying data analytics and EHS software to identify risks, optimize EHS performance, and track progress.
  • Proactive EHS management assists in reducing risks associated with injuries, accidents, non-compliance, and environmental damage. Thus causing potential cost savings and lowered liabilities.

Category-wise Insights

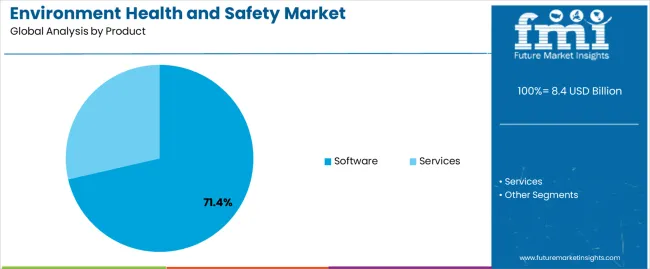
Software Segment to Witness High Demand Rate

Attributes Details
Top Product Software
Market Growth Rate from 2024 to 2034 7.1%

The software segment is projected to increase at a CAGR of 7.1% over the forecast period. Factors that are driving the market growth are:

  • Growing demand for EHS software owing to stringent requirements established by EPA/RCRA, Environment Canada/CEPA, and the European Hazardous Waste Directive.
  • Surging political and social pressure on firms to operate sustainably as pollution levels increase.
  • Rising demand to implement a standardized software platform to ensure consistent environmental health and safety compliance across an organization to increase their overall effectiveness.

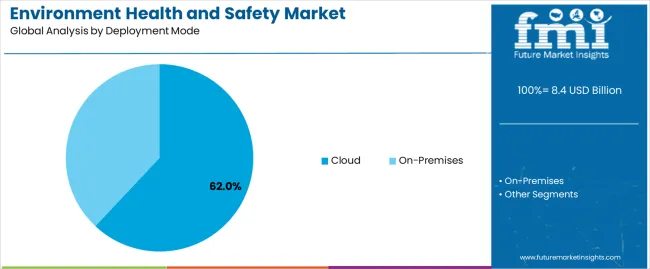
Growing Reliance on the Cloud

Attributes Details
Top Deployment Mode Cloud
Market Growth Rate from 2024 to 2034 6.8%

The cloud segment is anticipated to register a CAGR of 6.8% through 2034. Growing demand for cloud services is hinged on the following factors:
  • Lower upfront investment on cloud-based EHS software, as it eliminates upfront software and hardware costs, is increasing its adoption rate.
  • Automatic upgrades and maintenance by cloud providers are reducing the burden on organizations.
  • The easy scalability of cloud solutions to readily adapt to fluctuating data volumes or user numbers without extensive instruments is appealing to companies to adopt the cloud as a deployment mode.

Get the data you need at a Fraction of the cost

Personalize your report by choosing insights you need
and save 40%!

Competitive Landscape

Key players are aiming to lead the way by offering robust solutions that are effective in different sectors to position themselves as a premier environment health and safety provider. Industry participants are further focusing on developing strategic partnerships with other companies in this space.

Market players are further making significant investments to maintain their technological prowess and develop new products. Additionally, industry participants are assembling a large and impressive team of environment health and safety and management experts with wide knowledge, experience, and skills as demand for a single-source service provider is increasing among organizations.

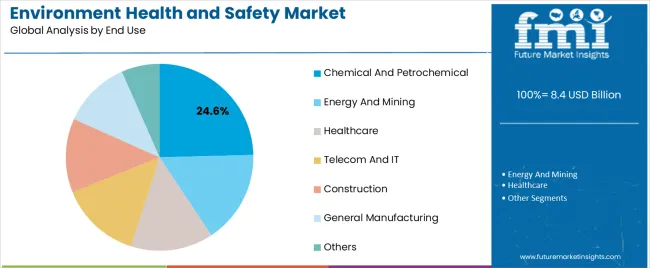
Manufacturers are increasing their market penetration and challenging themselves to meet shifts in technological demands from different applications like telecom and IT, chemicals and petrochemicals, healthcare, manufacturing, energy, and mining by using different market strategies. These include mergers, geographic expansions, new product developments, acquisitions, and joint ventures.

Recent Development in the Environment Health and Safety Market

  • In April 2023, Atlantic Technological University (ATU) and Ireland’s Health and Safety Authority (HSA) united to launch an online Workplace Safety, Health and Welfare Induction. This induction is intended to help employers to provide induction to new employees. The online induction contains a suite of short awareness-raising courses that can be used in addition to workplace-specific training.
  • In November 2023, the FAA completed the SpaceX Starship safety review, while the environmental assessment is still ongoing.
  • In February 2023, the collaboration between AECOM and its Office of Air and Radiation (OAR) took place. Development and execution of national initiatives related to radon, acid rain, climate change, etc., are the key objectives of this collaboration. This collaboration has been made possible by an analytical, environmental, technical, research, and hybrid contract.

Notable Environment Health and Safety Companies

  • AECOM
  • Jacobs
  • Intelex Technologies
  • Enablon
  • Tetra Tech, Inc.
  • SAP SE
  • Golder Associates
  • SGS SA.
  • ERM Group, Inc.
  • VelocityEHS
  • John Wood Group PLC
  • RPS Group
  • ETQ
  • Cority (Medgate)
  • Sphera
  • Others

Environment Health and Safety Market by Category

By Product:

  • Software
  • Services
    • Analytics
    • Project Deployment and Implementation
    • Business Consulting and Advisory
    • Audit, Assessment, and Regulatory Compliance
    • Certification
    • Others

By Deployment Mode:

  • Cloud
  • On-Premises

By End Use:

  • Chemical and Petrochemical
  • Energy and Mining
  • Healthcare
  • Telecom and IT
  • Construction
  • General Manufacturing
  • Others

By Region:

  • North America
  • Latin America
  • Western Europe
  • Eastern Europe
  • South Asia and Pacific
  • East Asia
  • The Middle East and Africa

Frequently Asked Questions

How Big is the Environment Health and Safety Market?

The market is estimated to account for US$ 7.8 billion in 2024.

At What Rate is the Environment Health and Safety Industry Estimated to Grow?

Throughout the forecast period, the market is projected to register a CAGR of 7.3%.

What is the Expected Value of the Environment Health and Safety Market by 2034?

By 2034, the environment health and safety industry is forecast to be worth US$ 15.8 billion.

Which Country Has the Significant Contribution to the Environment Health and Safety Industry?

The United States is a substantial contributor to the market growth.

Which Product is Expanding at a Healthy Rate?

Environment health and safety software is projected to observe heightened demand in the future.

Who are the Leading Companies in the Environment Health and Safety Market?

Some of the key players in the market include AECOM, Jacobs, and Intelex Technologies.

Table of Content
1. Executive Summary
    1.1. Global Market Outlook
    1.2. Demand-side Trends
    1.3. Supply-side Trends
    1.4. Technology Roadmap Analysis
    1.5. Analysis and Recommendations
2. Market Overview
    2.1. Market Coverage / Taxonomy
    2.2. Market Definition / Scope / Limitations
3. Market Background
    3.1. Market Dynamics
        3.1.1. Drivers
        3.1.2. Restraints
        3.1.3. Opportunity
        3.1.4. Trends
    3.2. Scenario Forecast
        3.2.1. Demand in Optimistic Scenario
        3.2.2. Demand in Likely Scenario
        3.2.3. Demand in Conservative Scenario
    3.3. Opportunity Map Analysis
    3.4. Investment Feasibility Matrix
    3.5. PESTLE and Porter’s Analysis
    3.6. Regulatory Landscape
        3.6.1. By Key Regions
        3.6.2. By Key Countries
    3.7. Regional Parent Market Outlook
4. Global Market Analysis 2019 to 2023 and Forecast, 2024 to 2034
    4.1. Historical Market Size Value (US$ Million) Analysis, 2019 to 2023
    4.2. Current and Future Market Size Value (US$ Million) Projections, 2024 to 2034
        4.2.1. Y-o-Y Growth Trend Analysis
        4.2.2. Absolute $ Opportunity Analysis
5. Global Market Analysis 2019 to 2023 and Forecast 2024 to 2034, By Product
    5.1. Introduction / Key Findings
    5.2. Historical Market Size Value (US$ Million) Analysis By Product, 2019 to 2023
    5.3. Current and Future Market Size Value (US$ Million) Analysis and Forecast By Product, 2024 to 2034
        5.3.1. Software
        5.3.2. Services
            5.3.2.1. Analytics
            5.3.2.2. Project Deployment & Implementation
            5.3.2.3. Business Consulting & Advisory
            5.3.2.4. Audit, Assessment, & Regulatory Compliance
            5.3.2.5. Certification
            5.3.2.6. Others
    5.4. Y-o-Y Growth Trend Analysis By Product, 2019 to 2023
    5.5. Absolute $ Opportunity Analysis By Product, 2024 to 2034
6. Global Market Analysis 2019 to 2023 and Forecast 2024 to 2034, By Deployment Mode
    6.1. Introduction / Key Findings
    6.2. Historical Market Size Value (US$ Million) Analysis By Deployment Mode, 2019 to 2023
    6.3. Current and Future Market Size Value (US$ Million) Analysis and Forecast By Deployment Mode, 2024 to 2034
        6.3.1. Cloud
        6.3.2. On-Premises
    6.4. Y-o-Y Growth Trend Analysis By Deployment Mode, 2019 to 2023
    6.5. Absolute $ Opportunity Analysis By Deployment Mode, 2024 to 2034
7. Global Market Analysis 2019 to 2023 and Forecast 2024 to 2034, By End-use
    7.1. Introduction / Key Findings
    7.2. Historical Market Size Value (US$ Million) Analysis By End-use, 2019 to 2023
    7.3. Current and Future Market Size Value (US$ Million) Analysis and Forecast By End-use, 2024 to 2034
        7.3.1. Chemical & Petrochemical
        7.3.2. Energy & Mining
        7.3.3. Healthcare
        7.3.4. Telecom & IT
        7.3.5. Construction
        7.3.6. General Manufacturing
        7.3.7. Others
    7.4. Y-o-Y Growth Trend Analysis By End-use, 2019 to 2023
    7.5. Absolute $ Opportunity Analysis By End-use, 2024 to 2034
8. Global Market Analysis 2019 to 2023 and Forecast 2024 to 2034, By Region
    8.1. Introduction
    8.2. Historical Market Size Value (US$ Million) Analysis By Region, 2019 to 2023
    8.3. Current Market Size Value (US$ Million) Analysis and Forecast By Region, 2024 to 2034
        8.3.1. North America
        8.3.2. Latin America
        8.3.3. Western Europe
        8.3.4. Eastern Europe
        8.3.5. South Asia and Pacific
        8.3.6. East Asia
        8.3.7. Middle East and Africa
    8.4. Market Attractiveness Analysis By Region
9. North America Market Analysis 2019 to 2023 and Forecast 2024 to 2034, By Country
    9.1. Historical Market Size Value (US$ Million) Trend Analysis By Market Taxonomy, 2019 to 2023
    9.2. Market Size Value (US$ Million) Forecast By Market Taxonomy, 2024 to 2034
        9.2.1. By Country
            9.2.1.1. USA
            9.2.1.2. Canada
        9.2.2. By Product
        9.2.3. By Deployment Mode
        9.2.4. By End-use
    9.3. Market Attractiveness Analysis
        9.3.1. By Country
        9.3.2. By Product
        9.3.3. By Deployment Mode
        9.3.4. By End-use
    9.4. Key Takeaways
10. Latin America Market Analysis 2019 to 2023 and Forecast 2024 to 2034, By Country
    10.1. Historical Market Size Value (US$ Million) Trend Analysis By Market Taxonomy, 2019 to 2023
    10.2. Market Size Value (US$ Million) Forecast By Market Taxonomy, 2024 to 2034
        10.2.1. By Country
            10.2.1.1. Brazil
            10.2.1.2. Mexico
            10.2.1.3. Rest of Latin America
        10.2.2. By Product
        10.2.3. By Deployment Mode
        10.2.4. By End-use
    10.3. Market Attractiveness Analysis
        10.3.1. By Country
        10.3.2. By Product
        10.3.3. By Deployment Mode
        10.3.4. By End-use
    10.4. Key Takeaways
11. Western Europe Market Analysis 2019 to 2023 and Forecast 2024 to 2034, By Country
    11.1. Historical Market Size Value (US$ Million) Trend Analysis By Market Taxonomy, 2019 to 2023
    11.2. Market Size Value (US$ Million) Forecast By Market Taxonomy, 2024 to 2034
        11.2.1. By Country
            11.2.1.1. Germany
            11.2.1.2. UK
            11.2.1.3. France
            11.2.1.4. Spain
            11.2.1.5. Italy
            11.2.1.6. Rest of Western Europe
        11.2.2. By Product
        11.2.3. By Deployment Mode
        11.2.4. By End-use
    11.3. Market Attractiveness Analysis
        11.3.1. By Country
        11.3.2. By Product
        11.3.3. By Deployment Mode
        11.3.4. By End-use
    11.4. Key Takeaways
12. Eastern Europe Market Analysis 2019 to 2023 and Forecast 2024 to 2034, By Country
    12.1. Historical Market Size Value (US$ Million) Trend Analysis By Market Taxonomy, 2019 to 2023
    12.2. Market Size Value (US$ Million) Forecast By Market Taxonomy, 2024 to 2034
        12.2.1. By Country
            12.2.1.1. Poland
            12.2.1.2. Russia
            12.2.1.3. Czech Republic
            12.2.1.4. Romania
            12.2.1.5. Rest of Eastern Europe
        12.2.2. By Product
        12.2.3. By Deployment Mode
        12.2.4. By End-use
    12.3. Market Attractiveness Analysis
        12.3.1. By Country
        12.3.2. By Product
        12.3.3. By Deployment Mode
        12.3.4. By End-use
    12.4. Key Takeaways
13. South Asia and Pacific Market Analysis 2019 to 2023 and Forecast 2024 to 2034, By Country
    13.1. Historical Market Size Value (US$ Million) Trend Analysis By Market Taxonomy, 2019 to 2023
    13.2. Market Size Value (US$ Million) Forecast By Market Taxonomy, 2024 to 2034
        13.2.1. By Country
            13.2.1.1. India
            13.2.1.2. Bangladesh
            13.2.1.3. Australia
            13.2.1.4. New Zealand
            13.2.1.5. Rest of South Asia and Pacific
        13.2.2. By Product
        13.2.3. By Deployment Mode
        13.2.4. By End-use
    13.3. Market Attractiveness Analysis
        13.3.1. By Country
        13.3.2. By Product
        13.3.3. By Deployment Mode
        13.3.4. By End-use
    13.4. Key Takeaways
14. East Asia Market Analysis 2019 to 2023 and Forecast 2024 to 2034, By Country
    14.1. Historical Market Size Value (US$ Million) Trend Analysis By Market Taxonomy, 2019 to 2023
    14.2. Market Size Value (US$ Million) Forecast By Market Taxonomy, 2024 to 2034
        14.2.1. By Country
            14.2.1.1. China
            14.2.1.2. Japan
            14.2.1.3. South Korea
        14.2.2. By Product
        14.2.3. By Deployment Mode
        14.2.4. By End-use
    14.3. Market Attractiveness Analysis
        14.3.1. By Country
        14.3.2. By Product
        14.3.3. By Deployment Mode
        14.3.4. By End-use
    14.4. Key Takeaways
15. Middle East and Africa Market Analysis 2019 to 2023 and Forecast 2024 to 2034, By Country
    15.1. Historical Market Size Value (US$ Million) Trend Analysis By Market Taxonomy, 2019 to 2023
    15.2. Market Size Value (US$ Million) Forecast By Market Taxonomy, 2024 to 2034
        15.2.1. By Country
            15.2.1.1. GCC Countries
            15.2.1.2. South Africa
            15.2.1.3. Israel
            15.2.1.4. Rest of MEA
        15.2.2. By Product
        15.2.3. By Deployment Mode
        15.2.4. By End-use
    15.3. Market Attractiveness Analysis
        15.3.1. By Country
        15.3.2. By Product
        15.3.3. By Deployment Mode
        15.3.4. By End-use
    15.4. Key Takeaways
16. Key Countries Market Analysis
    16.1. USA
        16.1.1. Pricing Analysis
        16.1.2. Market Share Analysis, 2023
            16.1.2.1. By Product
            16.1.2.2. By Deployment Mode
            16.1.2.3. By End-use
    16.2. Canada
        16.2.1. Pricing Analysis
        16.2.2. Market Share Analysis, 2023
            16.2.2.1. By Product
            16.2.2.2. By Deployment Mode
            16.2.2.3. By End-use
    16.3. Brazil
        16.3.1. Pricing Analysis
        16.3.2. Market Share Analysis, 2023
            16.3.2.1. By Product
            16.3.2.2. By Deployment Mode
            16.3.2.3. By End-use
    16.4. Mexico
        16.4.1. Pricing Analysis
        16.4.2. Market Share Analysis, 2023
            16.4.2.1. By Product
            16.4.2.2. By Deployment Mode
            16.4.2.3. By End-use
    16.5. Germany
        16.5.1. Pricing Analysis
        16.5.2. Market Share Analysis, 2023
            16.5.2.1. By Product
            16.5.2.2. By Deployment Mode
            16.5.2.3. By End-use
    16.6. UK
        16.6.1. Pricing Analysis
        16.6.2. Market Share Analysis, 2023
            16.6.2.1. By Product
            16.6.2.2. By Deployment Mode
            16.6.2.3. By End-use
    16.7. France
        16.7.1. Pricing Analysis
        16.7.2. Market Share Analysis, 2023
            16.7.2.1. By Product
            16.7.2.2. By Deployment Mode
            16.7.2.3. By End-use
    16.8. Spain
        16.8.1. Pricing Analysis
        16.8.2. Market Share Analysis, 2023
            16.8.2.1. By Product
            16.8.2.2. By Deployment Mode
            16.8.2.3. By End-use
    16.9. Italy
        16.9.1. Pricing Analysis
        16.9.2. Market Share Analysis, 2023
            16.9.2.1. By Product
            16.9.2.2. By Deployment Mode
            16.9.2.3. By End-use
    16.10. Poland
        16.10.1. Pricing Analysis
        16.10.2. Market Share Analysis, 2023
            16.10.2.1. By Product
            16.10.2.2. By Deployment Mode
            16.10.2.3. By End-use
    16.11. Russia
        16.11.1. Pricing Analysis
        16.11.2. Market Share Analysis, 2023
            16.11.2.1. By Product
            16.11.2.2. By Deployment Mode
            16.11.2.3. By End-use
    16.12. Czech Republic
        16.12.1. Pricing Analysis
        16.12.2. Market Share Analysis, 2023
            16.12.2.1. By Product
            16.12.2.2. By Deployment Mode
            16.12.2.3. By End-use
    16.13. Romania
        16.13.1. Pricing Analysis
        16.13.2. Market Share Analysis, 2023
            16.13.2.1. By Product
            16.13.2.2. By Deployment Mode
            16.13.2.3. By End-use
    16.14. India
        16.14.1. Pricing Analysis
        16.14.2. Market Share Analysis, 2023
            16.14.2.1. By Product
            16.14.2.2. By Deployment Mode
            16.14.2.3. By End-use
    16.15. Bangladesh
        16.15.1. Pricing Analysis
        16.15.2. Market Share Analysis, 2023
            16.15.2.1. By Product
            16.15.2.2. By Deployment Mode
            16.15.2.3. By End-use
    16.16. Australia
        16.16.1. Pricing Analysis
        16.16.2. Market Share Analysis, 2023
            16.16.2.1. By Product
            16.16.2.2. By Deployment Mode
            16.16.2.3. By End-use
    16.17. New Zealand
        16.17.1. Pricing Analysis
        16.17.2. Market Share Analysis, 2023
            16.17.2.1. By Product
            16.17.2.2. By Deployment Mode
            16.17.2.3. By End-use
    16.18. China
        16.18.1. Pricing Analysis
        16.18.2. Market Share Analysis, 2023
            16.18.2.1. By Product
            16.18.2.2. By Deployment Mode
            16.18.2.3. By End-use
    16.19. Japan
        16.19.1. Pricing Analysis
        16.19.2. Market Share Analysis, 2023
            16.19.2.1. By Product
            16.19.2.2. By Deployment Mode
            16.19.2.3. By End-use
    16.20. South Korea
        16.20.1. Pricing Analysis
        16.20.2. Market Share Analysis, 2023
            16.20.2.1. By Product
            16.20.2.2. By Deployment Mode
            16.20.2.3. By End-use
    16.21. GCC Countries
        16.21.1. Pricing Analysis
        16.21.2. Market Share Analysis, 2023
            16.21.2.1. By Product
            16.21.2.2. By Deployment Mode
            16.21.2.3. By End-use
    16.22. South Africa
        16.22.1. Pricing Analysis
        16.22.2. Market Share Analysis, 2023
            16.22.2.1. By Product
            16.22.2.2. By Deployment Mode
            16.22.2.3. By End-use
    16.23. Israel
        16.23.1. Pricing Analysis
        16.23.2. Market Share Analysis, 2023
            16.23.2.1. By Product
            16.23.2.2. By Deployment Mode
            16.23.2.3. By End-use
17. Market Structure Analysis
    17.1. Competition Dashboard
    17.2. Competition Benchmarking
    17.3. Market Share Analysis of Top Players
        17.3.1. By Regional
        17.3.2. By Product
        17.3.3. By Deployment Mode
        17.3.4. By End-use
18. Competition Analysis
    18.1. Competition Deep Dive
        18.1.1. AECOM
            18.1.1.1. Overview
            18.1.1.2. Product Portfolio
            18.1.1.3. Profitability by Market Segments
            18.1.1.4. Sales Footprint
            18.1.1.5. Strategy Overview
                18.1.1.5.1. Marketing Strategy
        18.1.2. Jacobs
            18.1.2.1. Overview
            18.1.2.2. Product Portfolio
            18.1.2.3. Profitability by Market Segments
            18.1.2.4. Sales Footprint
            18.1.2.5. Strategy Overview
                18.1.2.5.1. Marketing Strategy
        18.1.3. Intelex Technologies
            18.1.3.1. Overview
            18.1.3.2. Product Portfolio
            18.1.3.3. Profitability by Market Segments
            18.1.3.4. Sales Footprint
            18.1.3.5. Strategy Overview
                18.1.3.5.1. Marketing Strategy
        18.1.4. Enablon
            18.1.4.1. Overview
            18.1.4.2. Product Portfolio
            18.1.4.3. Profitability by Market Segments
            18.1.4.4. Sales Footprint
            18.1.4.5. Strategy Overview
                18.1.4.5.1. Marketing Strategy
        18.1.5. Tetra Tech, Inc.
            18.1.5.1. Overview
            18.1.5.2. Product Portfolio
            18.1.5.3. Profitability by Market Segments
            18.1.5.4. Sales Footprint
            18.1.5.5. Strategy Overview
                18.1.5.5.1. Marketing Strategy
        18.1.6. SAP SE
            18.1.6.1. Overview
            18.1.6.2. Product Portfolio
            18.1.6.3. Profitability by Market Segments
            18.1.6.4. Sales Footprint
            18.1.6.5. Strategy Overview
                18.1.6.5.1. Marketing Strategy
        18.1.7. Golder Associates
            18.1.7.1. Overview
            18.1.7.2. Product Portfolio
            18.1.7.3. Profitability by Market Segments
            18.1.7.4. Sales Footprint
            18.1.7.5. Strategy Overview
                18.1.7.5.1. Marketing Strategy
        18.1.8. SGS SA.
            18.1.8.1. Overview
            18.1.8.2. Product Portfolio
            18.1.8.3. Profitability by Market Segments
            18.1.8.4. Sales Footprint
            18.1.8.5. Strategy Overview
                18.1.8.5.1. Marketing Strategy
        18.1.9. ERM Group, Inc.
            18.1.9.1. Overview
            18.1.9.2. Product Portfolio
            18.1.9.3. Profitability by Market Segments
            18.1.9.4. Sales Footprint
            18.1.9.5. Strategy Overview
                18.1.9.5.1. Marketing Strategy
        18.1.10. VelocityEHS
            18.1.10.1. Overview
            18.1.10.2. Product Portfolio
            18.1.10.3. Profitability by Market Segments
            18.1.10.4. Sales Footprint
            18.1.10.5. Strategy Overview
                18.1.10.5.1. Marketing Strategy
        18.1.11. John Wood Group PLC
            18.1.11.1. Overview
            18.1.11.2. Product Portfolio
            18.1.11.3. Profitability by Market Segments
            18.1.11.4. Sales Footprint
            18.1.11.5. Strategy Overview
                18.1.11.5.1. Marketing Strategy
        18.1.12. RPS Group
            18.1.12.1. Overview
            18.1.12.2. Product Portfolio
            18.1.12.3. Profitability by Market Segments
            18.1.12.4. Sales Footprint
            18.1.12.5. Strategy Overview
                18.1.12.5.1. Marketing Strategy
19. Assumptions & Acronyms Used
20. Research Methodology
Recommendations

Industrial Automation

Testing, Inspection & Certification Market

November 2023

REP-GB-14741

342 pages

Industrial Automation

Environment Testing, Inspection, and Certification Market

July 2023

REP-GB-5602

315 pages

Explore Industrial Automation Insights

View Reports
Future Market Insights

Environment Health and Safety Market

Schedule a Call