Angle-Resolved Photoemission Spectroscopy Market Size and Share Forecast Outlook 2025 to 2035

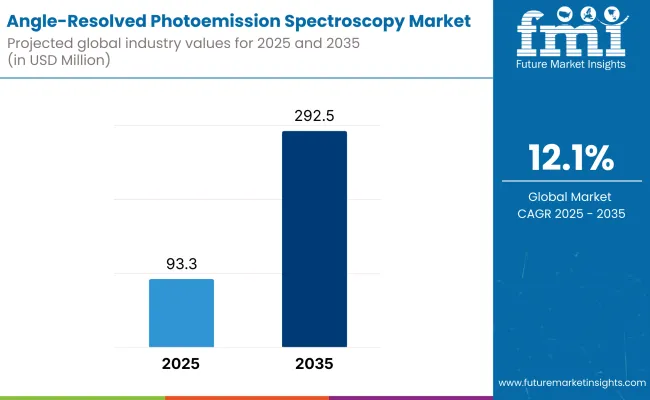
The Angle-Resolved Photoemission Spectroscopy Market has been forecasted to attain a valuation of USD 93.3 million in 2025, rising to USD 292.5 million by 2035, resulting in an incremental gain of USD 199.1 million, which reflects a 31.9% increase over the forecast decade. A compound annual growth rate (CAGR) of 12.1% is expected to be recorded, indicating a rapid expansion trajectory for the angle-resolved photoemission spectroscopy market.
Quick Stats for Angle-Resolved Photoemission Spectroscopy Market

  • Industry Value (2025): USD 93.3 million
  • Forecast Value (2035): USD 292.5 million
  • Forecast CAGR: 12.1%
  • Leading Segment in 2025 (Product): Laser-based ARPES Systems (43.5% market share)
  • Key Growth Region: East Asia, Europe and North America
  • Top Key Players: SPECS GmbH, Scienta Omicron, MB Scientific AB, Thermo Fisher Scientific, RHK Technology

Angle Resolved Photoemission Spectroscopy Market

Angle-Resolved Photoemission Spectroscopy Market Key Takeaways

Metric Value
Market Estimated Value in (2025E) USD 93.3 million
Market Forecast Value in (2035F) USD 292.5 million
Forecast CAGR (2025 to 2035) 12.1%

During the first five-year period from 2025 to 2030, the Angle-Resolved Photoemission Spectroscopy (ARPES) market is set to grow from USD 93.3 million to USD 165.2 million, contributing USD 71.9 million, or approximately 36.1% of the total decade growth. This period marks a steady expansion in adoption across university laboratories, semiconductor R&D centers, and synchrotron light source facilities.

ARPES is becoming indispensable for band structure mapping, enabling key advances in topological insulators, 2D materials, and unconventional superconductivity. Laser-based ARPES Systems dominates this period with more than 43.0%. The convergence of ultra-high energy resolution with user-friendly software is making ARPES more accessible, prompting growth even in mid-tier academic institutions and national labs.

Between 2030 and 2035, the market is projected to add USD 127.2 million, as it accelerates toward USD 292.4 million by 2035. This phase is characterized by rapid proliferation of spin-resolved (SARPES) and time-resolved (trARPES) systems, driven by their essential role in quantum computing, spintronics, and ultrafast electronic dynamics research.

Technological progress in cryogenic manipulators, ultra-fast pulsed lasers, and next-gen detectors will define this phase, enabling sub-femtosecond resolution and spin-selective detection at higher throughput. Synchrotron-based ARPES Systems and Lab-based ARPES Systems constitutes around 57.9% by the end of the decade.

Between 2020 and 2024, the ARPES market advanced from USD 48.6 million to USD 83.7 million, transitioning from a synchrotron-dominated research technique to a broader lab-based and tabletop-compatible instrumentation category.

During this foundational phase, key equipment manufacturers collaborated with academic and national research centers to simplify vacuum chamber integration, beamline alignment, and data acquisition workflows. Competitive differentiation focused on instrument modularity and reducing system complexity factors that paved the way for decentralized access in surface science and electronic materials characterization.

Going forward, the ARPES ecosystem is expected to hold a revenue of USD 93.3 million in 2025 and is will likely evolve to incorporate AI-powered spectral analysis, real-time data visualization, and hybrid compatibility with other measurement modalities such as STM and LEED. These innovations aim to reduce the learning curve, expand interdisciplinary usability, and improve throughputmaking ARPES a staple characterization technique in condensed matter physics and electronic materials research.

Why the Angle-Resolved Photoemission Spectroscopy Market is growing?

The growth of the Angle-Resolved Photoemission Spectroscopy (ARPES) Market is reinforced by the unique ability of this technique to directly probe the electronic structure of advanced materials, especially those relevant to quantum computing, superconductivity, and topological insulators. In contrast to conventional spectroscopic tools, ARPES provides momentum-resolved insights into quasiparticle dynamics, band dispersion, and Fermi surface topologymaking it indispensable for next-generation electronic materials research.

Over the last decade, the scope of ARPES has expanded beyond fundamental condensed matter physics. It is now a critical tool in semiconductor R&D, enabling detailed analysis of band alignment, spin-orbit interactions, and interface states at the nanoscale. As materials with non-trivial topological and correlated electron behavior gain prominence in applied physics and device engineering, ARPES is becoming a mandatory characterization technique across leading research institutions and commercial innovation labs.

Another factor driving adoption is the shift from synchrotron-only access to highly capable lab-based ARPES systems. With vendors now offering turnkey platforms that integrate cryogenic manipulators, vacuum chambers, hemispherical analyzers, and femtosecond lasers, researchers can achieve synchrotron-level resolution in their own facilities. This decentralization is transforming the accessibility of ARPES, particularly in countries expanding their research infrastructure.

Moreover, increasing demand from interdisciplinary fieldsincluding spintronics, surface catalysis, and ultrafast dynamics which is fostering development of hybrid ARPES modalities such as spin-resolved and time-resolved ARPES. These systems cater to the growing need to capture spin texture, nonequilibrium states, and transient phenomena in complex materials.

Collectively, these scientific and technological drivers are positioning the ARPES market for sustained expansion, fueled by its essential role in revealing the physics underpinning future electronic, photonic, and quantum technologies.

Segmental Analysis

The market is segmented by product, technology, end user and region. Product include Laser-based ARPES Systems, Synchrotron-based ARPES Systems and Lab-based ARPES Systems. Technology type classification covers Conventional ARPES, Time-Resolved ARPES (trARPES), Spin-Resolved ARPES (SARPES)and Others.

Based on end user, the segmentation includes Academic & Research Institutes, Synchrotron Facilities, Semiconductor & Electronics Companies, Quantum Computing Startups & Labs and Government Laboratories. Regionally, the scope spans North America, Latin America, Western and Eastern Europe, East Asia, South Asia and Pacific, and the Middle East and Africa.
Insights into the Product Segment with Laser-based ARPES Systems Market

Angle Resolved Photoemission Spectroscopy Market By Product

Product Market Value Share, 2025
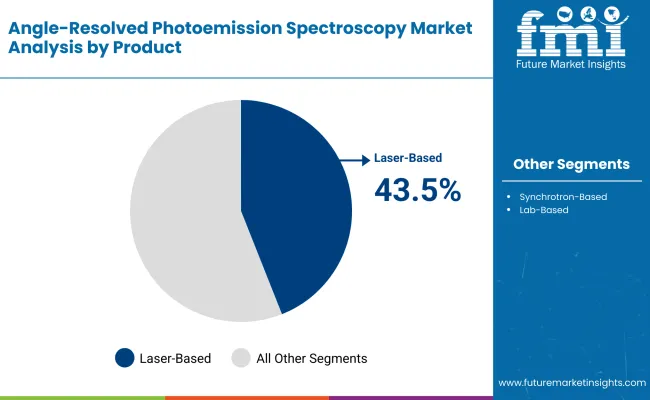
Laser-based ARPES Systems 43.5%
Synchrotron-based ARPES Systems 27.3%
Lab-based ARPES Systems 29.2%

Laser-based ARPES Systems are projected to lead the product category with a 43.5% market share in 2025 and are expected to maintain this position due to their ability to deliver ultrahigh energy and momentum resolution in compact, lab-scale environments. Unlike synchrotron-based setups, laser-based systems offer femtosecond temporal resolution and exceptional photon flux at narrow bandwidthsallowing researchers to resolve low-energy excitations and subtle quasiparticle dynamics with unprecedented precision.

Recent advances in 6 eV to 11 eV laser sources, combined with innovations in monochromator design and thermal stabilization, have enabled these systems to operate near the theoretical limits of resolution.

A key factor behind their dominance is their growing presence in university labs and national research institutes. With commercial vendors now offering turnkey systems that require minimal user calibration, laser-based ARPES is becoming more accessible to non-synchrotron-equipped facilities. Their relatively lower footprint and infrastructure demands further position them as the go-to platform for precision spectroscopy in condensed matter physics.
Insights into the Technology Segment with Conventional ARPES Dominating the Market

Angle Resolved Photoemission Spectroscopy Market By Technology

Technology Type Market Value Share, 2025
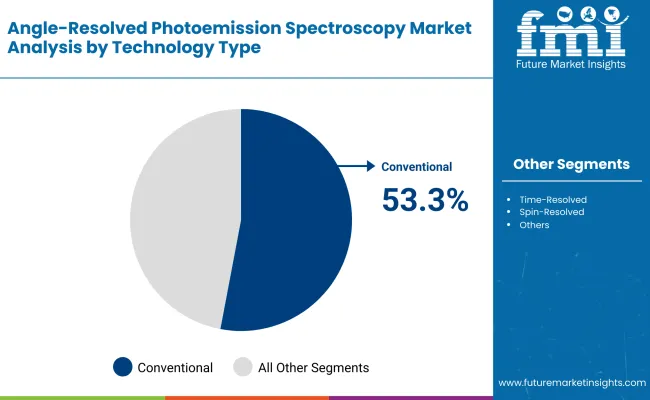
Conventional ARPES 53.33%
Time-Resolved ARPES ( trARPES) 21.60%
Spin-Resolved ARPES (SARPES) 15.33%
Others 9.75%

Conventional ARPES continues to dominate the technology landscape, accounting for over half of total demand in 2025. This technique remains the foundation of electronic structure research due to its proven ability to map valence band dispersions, Fermi surfaces, and quasiparticle interactions with high energy and angular resolution. As an essential characterization method in surface and condensed matter physics, conventional ARPES offers unmatched insight into materials where electron correlation and topological features are central to functional behavior.

Recent improvements in detector sensitivity, sample cooling techniques, and vacuum stability have further enhanced the resolution and usability of conventional ARPES, especially in lab-based systems. Moreover, academic curricula and national lab research programs continue to prioritize conventional ARPES as a primary training and discovery tool, ensuring a sustained pipeline of skilled users and stable funding.

While advanced methods such as trARPES and SARPES are gaining ground in niche applications, conventional ARPES remains the mainstay of the global market, largely due to its versatility, accessibility, and broad compatibility with a wide range of experimental conditions and material classes.

What are the Drivers, Restraints, and Key Trends of the Angle-Resolved Photoemission Spectroscopy Market?

The adoption of ARPES is accelerating across multiple research disciplines as experimental and computational advancements converge to deepen the understanding of electronic structures in complex materials. While momentum is strong, the market also faces structural limitations unique to the technique’s complexity and infrastructure needs.

Growing Role in Quantum and Electronic Materials Research

ARPES is now essential in the study of quantum materials, superconductors, and 2D systems. It directly reveals how electrons behave at the surface and within bulk statessomething conventional tools cannot do. Research labs and universities are using it to validate theories and discover new phases of matter. As quantum computing and spintronics advance, ARPES is becoming a standard tool in material validation workflows.

Infrastructure Demands and Technical Complexity Limit Widespread ARPES Adoption

ARPES requires ultrahigh vacuum, clean surfaces, and cryogenic coolingmaking setup and maintenance costly and complex. Sample degradation and charging effects can distort results, limiting the range of usable materials. Operators need deep knowledge of surface science, vacuum technology, and data analysis, which creates a training bottleneck. These factors prevent widespread adoption in routine testing environments or industrial R&D. Without proper facilities, even powerful systems remain underutilized. This remains a key restraint in expanding beyond specialized research institutes.

Shift Toward Compact and Lab-Ready ARPES Systems

The ARPES market is expanding as more labs move away from reliance on synchrotron facilities. Manufacturers now offer compact, turnkey ARPES systems that fit into standard research labs. These systems combine high energy resolution with simple interfaces, making them usable even by first-time operators. Improved laser sources, cryo-stages, and electron analyzers allow labs to perform high-end spectroscopy without needing large infrastructure. Countries investing in research independence are equipping national universities with in-house ARPES setups, expanding the market beyond traditional power users.
Analysis of Angle-Resolved Photoemission Spectroscopy Market, By Key Countries

Angle Resolved Photoemission Spectroscopy Market By Country

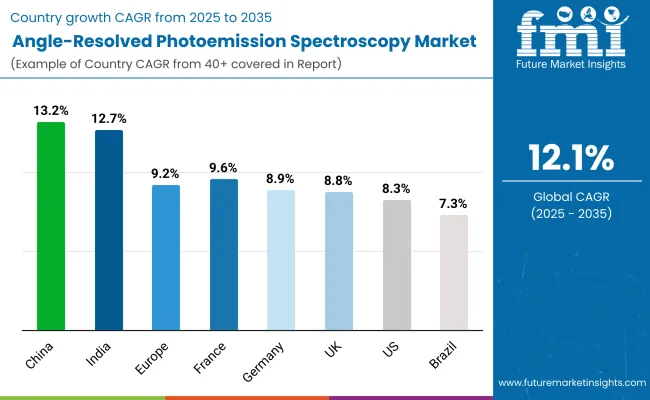
Countries CAGR
USA 8.3%
Brazil 7.3%
China 13.2%
India 12.7%
Europe 9.2%
Germany 8.9%
France 9.6%
UK 8.8%

The adoption of Angle-Resolved Photoemission Spectroscopy (ARPES) systems exhibit distinct variations across different regions, influenced by the maturity of research infrastructure, government investment in advanced material sciences, and specialized application demand.

In the United States, the ARPES market is characterized by strong growth driven by a robust ecosystem of academic and government-funded research institutions, as well as leading technology companies focusing on semiconductor and quantum materials. The availability of advanced synchrotron radiation facilities and laser-based ARPES systems supports cutting-edge investigations, resulting in widespread adoption.

The presence of specialized research centers and continuous investments in next-generation electronic materials propels demand for ARPES systems, particularly in areas like quantum computing and novel semiconductor development. The market here is projected to grow at a CAGR of 8.3%.

In Europe, countries such as Germany, France, and the UK lead the ARPES landscape with growing emphasis on integrating ARPES techniques within national research initiatives and material innovation frameworks. Government-backed research programs and large-scale synchrotron facilities have simplified extensive collaboration, enabling use of time-resolved and spin-resolved ARPES technologies for advanced studies in topological insulators, superconductors, and spintronics.

Regulatory support for large scientific infrastructures and strategic funding foster sustained market growth, though adoption remains cautiously progressive as new ARPES modalities continue to prove their utility in real-world applications. The market in Germany is expected to expand at a CAGR of 8.9%, France at 9.6%, and the UK at 8.8%.

Overall, the ARPES market globally reflects a strategic blend of technological advancement, research priority alignment, and institutional investment, which altogether govern the pace and scale of adoption in different countries. This dynamic interplay underscores the central role that regional research policies, infrastructure availability, and scientific expertise play in shaping the trajectory of this highly specialized spectroscopy market.

Sales Outlook for Angle-Resolved Photoemission Spectroscopy in the United States

Year USA Angle-Resolved Photoemission Spectroscopy Market (USD Million)
2025 26.4
2026 28.5
2027 30.8
2028 33.3
2029 36.1
2030 39.0
2031 42.3
2032 45.8
2033 49.6
2034 53.9
2035 58.6

The angle-resolved photoemission spectroscopy market in the United States has been forecasted to expand at a CAGR of 8.3% between 2025 and 2035. The United States remains the most mature and research-intensive market for ARPES, with long-standing integration into physics, materials science, and semiconductor characterization programs.

Universities such as MIT, Stanford, and UC Berkeley, alongside institutions like the Department of Energy’s National Labs, have been pivotal in setting global benchmarks for ARPES applications in topological materials and many-body physics. The USA also hosts several of the world’s most advanced synchrotron and free-electron laser facilities, providing routine access to high-resolution, beamline-specific ARPES.

  • Commercial interest from semiconductor fabs and materials startups is driving demand for ARPES in interface engineering and defect state analysis.
  • USA vendors are developing AI-integrated ARPES software platforms aimed at automated data interpretation and operator guidancereducing training time and increasing usability.
  • Cross-disciplinary collaborations between physics and electrical engineering departments are fostering hybrid research programs where ARPES is used alongside nanofabrication and quantum transport measurements.

Growth and Expansion Outlook for Angle-Resolved Photoemission Spectroscopy Market in India

The angle-resolved photoemission spectroscopy market in India is expected to grow at a CAGR of 12.7% between 2025 and 2035, with growing academic interest but limited infrastructure outside top-tier institutions.

Premier research bodies like the Indian Institute of Science (IISc), Tata Institute of Fundamental Research (TIFR), and IIT Bombay have established capabilities in surface science and are leading the adoption of ARPES in condensed matter physics and quantum material studies. However, the number of operational ARPES systems remains low, primarily due to high setup costs, limited cryogenic and UHV expertise, and reliance on central government grants.

  • Most ARPES installations in India are grant-dependent, with procurement cycles tied to Department of Science & Technology (DST) and SERB-funded capital projects.
  • Collaborations with international beamlines remain essential, as limited synchrotron capabilities constrain access to high-flux ARPES systems.
  • To address infrastructure gaps, some Indian research groups are experimenting with low-cost vacuum systems and indigenous electron optics, aiming to build entry-level ARPES setups for academic training.

Sales Outlook for Angle-Resolved Photoemission Spectroscopy in China

China’s angle-resolved photoemission spectroscopy market is projected to expand at a CAGR of 13.2% from 2025 to 2035. China’s ARPES market is expanding rapidly, driven by its strong investment in quantum materials, heavy-fermion systems, and two-dimensional heterostructures.

Top institutions such as Tsinghua University, Peking University, and the Institute of Physics (Chinese Academy of Sciences) have advanced ARPES facilities and regularly publish in high-impact journals using the technique. Several national laboratories have installed high-resolution, spin-resolved, and time-resolved ARPES systems, often developed in collaboration with domestic equipment manufacturers.

  • Domestic vendors are emerging with modular ARPES platforms tailored for Chinese university labs, focusing on cost-effective vacuum integration and simplified user interfaces.
  • Many state-funded labs are incorporating ARPES into multi-tool analysis suites that include STM, XPS, and LEED, creating a full workflow for surface and electronic characterization.
  • Regional governments are offering co-funding for high-cost infrastructure in Tier 1 and Tier 2 cities, boosting adoption outside traditional research hubs like Beijing and Shanghai.

Growth and Expansion Outlook for Angle-Resolved Photoemission Spectroscopy Market in the United Kingdom

The angle-resolved photoemission spectroscopy market in the United Kingdom is projected to grow at a CAGR of 8.8% between 2025 and 2035.The ARPES market in the United Kingdom is backed by strong public investment in quantum materials and next-generation electronics, with leading institutions such as the University of Oxford, University of Cambridge, and University of St Andrews integrating ARPES into their condensed matter research workflows. The country benefits from centralized beamline access through the Diamond Light Source, where several ARPES endstations support national and EU-wide collaborations.

In recent years, the UK has seen a rise in lab-based ARPES installations driven by EPSRC-funded capital grants and participation in pan-European quantum research initiatives. These systems are increasingly being used in conjunction with low-temperature transport and angle-integrated spectroscopy experiments, enabling more holistic analysis of quantum and spintronic materials.

  • Cross-institutional training programs and technician exchanges are increasing operator readiness and reducing downtime for university-based ARPES systems.
  • Government funding streams like UKRI’s “Quantum Technologies Challenge” are prioritizing capital equipment for band structure analysis and surface science.
  • ARPES is also being explored in industrial research centers for characterizing flexible electronics and organic semiconductors, expanding its use beyond traditional physics departments.

In-depth Analysis of Angle-Resolved Photoemission Spectroscopy in Germany

The angle-resolved photoemission spectroscopy market in Germany is anticipated to grow at a CAGR of 8.9% between 2025 and 2035. Germany is positioning itself as a key industrial hub for high-precision ARPES applications, particularly in electronic materials, spintronics, and applied surface engineering.

While academic research remains strong, much of the current growth is fueled by collaborations between federal labs, semiconductor companies, and precision equipment manufacturers. German firms are playing a strategic role in developing ARPES subsystemsincluding electron analyzers, UHV manipulators, and high-stability cryostats, which are now being integrated into international system builds.

  • Instrumentation firms based in Germany are key suppliers of ARPES-critical components and export extensively to both academic and commercial system integrators.
  • Applied R&D centers are using ARPES to study buried interfaces, thin films, and oxide heterostructures relevant to energy storage and neuromorphic computing.
  • The German Research Foundation (DFG) is funding multi-institute clusters that position ARPES as part of broader quantum measurement toolkits alongside LEEM and SPLEEM.

Europe Angle-Resolved Photoemission Spectroscopy Value Analysis By Country

Europe Countries 2025
Germany 26.3%
UK 16.2%
France 14.1%
Italy 11.1%
Spain 8.1%
BENELUX 9.1%
Nordic Countries 10.1%
Rest of Western Europe 5.1%
Europe Countries 2035
Germany 27.4%
UK 15.2%
France 13.1%
Italy 10.1%
Spain 6.1%
BENELUX 10.1%
Nordic Countries 8.1%
Rest of Western Europe 11.1%

Growth Outlook for Angle-Resolved Photoemission Spectroscopy Market in Japan

Product Market Value Share, 2025
Laser-based ARPES Systems 45.5%
Synchrotron-based ARPES Systems 28.3%
Lab-based ARPES Systems 26.2%

The angle-resolved photoemission spectroscopy market in Japan has been projected to reach USD 6.9 million by 2025. Laser-based ARPES Systemswill lead the product landscape with an 45.5% share, followed bysynchrotron-based APRES system 28.3%. The ARPES market in Japan is shaped by a long-standing research tradition in condensed matter physics and advanced surface science.

Japan’s national universities and research institutes, such as the University of Tokyo, RIKEN, and Osaka University, have made ARPES central to their investigation of 2D materials, superconductors, and topological systems. Many institutions operate both synchrotron-based ARPES and in-lab laser setups, allowing diverse experimentation ranging from fundamental band studies to time-resolved ultrafast dynamics.

  • Market in Japan holds share of 7.4% in 2025 in the global market.
  • Synchrotron-based ARPES Systems along with Lab-based ARPES Systems combinedly lead by 54.5%.
  • Growth is supported by high implementation of angle-resolved photoemission spectroscopy systems in universities.

Opportunity Analysis of South Korea Angle-Resolved Photoemission Spectroscopy Market

Technology Type Market Value Share, 2025
Conventional ARPES 54.3%
Time-Resolved ARPES ( trARPES ) 22.6%
Spin-Resolved ARPES (SARPES) 17.3%
Others 5.8%

The angle-resolved photoemission spectroscopy market in South Korea has been projected to reach USD 2.0 million in 2025. Conventional ARPESare expected to lead technology type with an 54.3%. South Korea’s ARPES market is evolving from fundamental physics toward semiconductor-driven and industrial-grade applications.

National institutes such as the Korea Institute of Science and Technology (KIST) and POSTECH are leading advanced ARPES research focused on thin films, oxide interfaces, and quantum well structures. However, a key differentiator for South Korea is its early-stage application of ARPES in semiconductor R&D and materials engineering, particularly in defect analysis and energy band alignment studies relevant to chip fabrication.
  • Market size for South Korea in 2025 is USD 2.0million
  • Global market share is approximately 2.1%
  • South Korea is piloting hybrid ARPES setups co-located with nanofabrication clusters, enabling near real-time feedback in material development cycles.

Competitive Landscape of Angle-Resolved Photoemission Spectroscopy Market

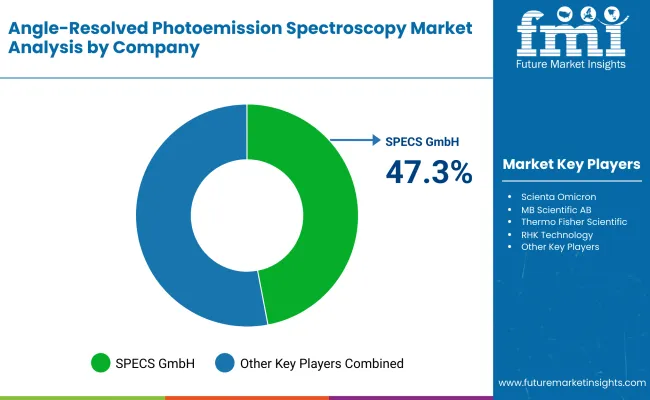
Angle Resolved Photoemission Spectroscopy Market By Company

The ARPES market is moderately concentrated, with a blend of global leaders, mid-sized innovators, and domain-specific specialists shaping the competitive landscape. SPECS GmbH holds a leading position, driven by its deep specialization in ultra-high vacuum surface analysis systems. The company’s integrated platform approach which includes custom cryostats, hemispherical analyzers, and proprietary control softwarepositions it as the preferred vendor for high-resolution, spin- and time-resolved ARPES studies in quantum materials and 2D systems.

Established mid-tier players such as Scienta Omicron, MB Scientific AB, and Thermo Fisher Scientific address distinct segments of the ARPES ecosystem. Scienta Omicron is prominent in beamline-integrated systems and maintains strong partnerships with major synchrotron facilities, delivering high-throughput solutions for collaborative research. MB Scientific AB specializes in precision electron optics and monochromators, serving elite academic and national labs focused on condensed matter physics. Thermo Fisher, while broader in scientific instrumentation, is gaining traction in surface science platforms, integrating ARPES capabilities into multi-modal material characterization workflows.

Niche-focused manufacturers are emerging with compact, application-driven systems tailored for university and national lab installations in emerging regions. These vendors differentiate through customization, modular design, and localized support, enabling decentralized research capabilities without reliance on synchrotron access.

Competitive differentiation in the ARPES market is increasingly defined by the depth of ecosystem integrationcombining hardware with AI-assisted spectral analysis, real-time visualization, and interoperability with adjacent techniques like STM and LEED.

Key Developments in Angle-Resolved Photoemission Spectroscopy Market

  • On July 1, 2025, SPECS Group unveiled its next-generation NanoSCA MARKS, integrating advanced photoemission tools with enhanced stability and data acquisition capabilities. This development marks a significant expansion in ARPES imaging modalities.
  • In 2024, Scienta Omicron's AtomCloud RHEED launched which is an automated analysis suite powered by machine learning. It enhances in-situ RHEED data interpretation, enabling real-time insights into material evolution during MBE processes and seamless integration with the Matrion lab server.

Scope of the Report

Item Value
Quantitative Units USD 93.3 million
Product Laser-based ARPES Systems, Synchrotron-based ARPES Systems and Lab-based ARPES Systems
Technology Type Conventional ARPES, Time-Resolved ARPES ( trARPES), Spin-Resolved ARPES (SARPES) and Others
End User Academic & Research Institutes, Synchrotron Facilities, Semiconductor & Electronics Companies, Quantum Computing Startups & Labs and Government Laboratories
Regions Covered North America, Latin America, Western Europe, Eastern Europe, East Asia, South Asia & Pacific, Middle East & Africa
Countries Covered USA, Brazil, China, India, Europe, Germany, France and UK
Key Companies Profiled SPECS GmbH, Scienta Omicron, MB Scientific AB, Thermo Fisher Scientific, RHK Technology and Others

Key Segments

By Product Type:

  • Laser-based ARPES Systems
  • Synchrotron-based ARPES Systems
  • Lab-based ARPES Systems

By Technology:

  • Conventional ARPES
  • Time-Resolved ARPES (trARPES)
  • Spin-Resolved ARPES (SARPES)
  • Others

By End User:

  • Academic & Research Institutes
  • Synchrotron Facilities
  • Semiconductor & Electronics Companies
  • Quantum Computing Startups & Labs
  • Government Laboratories

By Region:

  • North America
  • Latin America
  • Western Europe
  • Eastern Europe
  • East Asia
  • South Asia
  • MEA

Table of Content

  1. Executive Summary
    • Global Market Outlook
    • Demand-side Trends
    • Supply-side Trends
    • Technology Roadmap Analysis
    • Analysis and Recommendations
  2. Market Overview
    • Market Coverage / Taxonomy
    • Market Definition / Scope / Limitations
  3. Market Background
    • Market Dynamics
      • Drivers
      • Restraints
      • Opportunity
      • Trends
    • Scenario Forecast
      • Demand in Optimistic Scenario
      • Demand in Likely Scenario
      • Demand in Conservative Scenario
    • Opportunity Map Analysis
    • Product Life Cycle Analysis
    • Supply Chain Analysis
      • Supply Side Participants and their Roles
        • Producers
        • Mid-Level Participants (Traders/ Agents/ Brokers)
        • Wholesalers and Distributors
      • Value Added and Value Created at Node in the Supply Chain
      • List of Existing and Potential Buyer’s
    • Investment Feasibility Matrix
    • Value Chain Analysis
      • Profit Margin Analysis
      • Wholesalers and Distributors
      • Retailers
    • PESTLE and Porter’s Analysis
    • Regulatory Landscape
      • By Key Regions
      • By Key Countries
    • Regional Parent Market Outlook
    • Production and Consumption Statistics
  4. Global Market Analysis 2020 to 2024 and Forecast, 2025 to 2035
    • Historical Market Size Value (USD Million) & Volume (Units) Analysis, 2020 to 2024
    • Current and Future Market Size Value (USD Million) & Volume (Units) Projections, 2025 to 2035
      • Y-o-Y Growth Trend Analysis
      • Absolute $ Opportunity Analysis
  5. Global Market Analysis 2020 to 2024 and Forecast 2025 to 2035, By Product Type
    • Introduction / Key Findings
    • Historical Market Size Value (USD Million) & Volume (Units) Analysis By Product Type, 2020 to 2024
    • Current and Future Market Size Value (USD Million) & Volume (Units) Analysis and Forecast By Product Type, 2025 to 2035
      • Laser-based ARPES Systems
      • Synchrotron-based ARPES Systems
      • Lab-based ARPES Systems
    • Y-o-Y Growth Trend Analysis By Product Type, 2020 to 2024
    • Absolute $ Opportunity Analysis By Product Type, 2025 to 2035
  6. Global Market Analysis 2020 to 2024 and Forecast 2025 to 2035, By Technology
    • Introduction / Key Findings
    • Historical Market Size Value (USD Million) & Volume (Units) Analysis By Technology, 2020 to 2024
    • Current and Future Market Size Value (USD Million) & Volume (Units) Analysis and Forecast By Technology, 2025 to 2035
      • Conventional ARPES
      • Time-Resolved ARPES (trARPES)
      • Spin-Resolved ARPES (SARPES)
      • Others
    • Y-o-Y Growth Trend Analysis By Technology, 2020 to 2024
    • Absolute $ Opportunity Analysis By Technology, 2025 to 2035
  7. Global Market Analysis 2020 to 2024 and Forecast 2025 to 2035, By End User
    • Introduction / Key Findings
    • Historical Market Size Value (USD Million) & Volume (Units) Analysis By End User, 2020 to 2024
    • Current and Future Market Size Value (USD Million) & Volume (Units) Analysis and Forecast By End User, 2025 to 2035
      • Academic & Research Institutes
      • Synchrotron Facilities
      • Semiconductor & Electronics Companies
      • Quantum Computing Startups & Labs
      • Government Laboratories
    • Y-o-Y Growth Trend Analysis By End User, 2020 to 2024
    • Absolute $ Opportunity Analysis By End User, 2025 to 2035
  8. Global Market Analysis 2020 to 2024 and Forecast 2025 to 2035, By Region
    • Introduction
    • Historical Market Size Value (USD Million) & Volume (Units) Analysis By Region, 2020 to 2024
    • Current Market Size Value (USD Million) & Volume (Units) Analysis and Forecast By Region, 2025 to 2035
      • North America
      • Latin America
      • Western Europe
      • Eastern Europe
      • East Asia
      • South Asia
      • MEA
    • Market Attractiveness Analysis By Region
  9. North America Market Analysis 2020 to 2024 and Forecast 2025 to 2035, By Country
    • Historical Market Size Value (USD Million) & Volume (Units) Trend Analysis By Market Taxonomy, 2020 to 2024
    • Market Size Value (USD Million) & Volume (Units) Forecast By Market Taxonomy, 2025 to 2035
      • By Country
        • USA
        • Canada
        • Mexicio
      • By Product Type
      • By Technology
      • By End User
    • Market Attractiveness Analysis
      • By Country
      • By Product Type
      • By Technology
      • By End User
    • Key Takeaways
  10. Latin America Market Analysis 2020 to 2024 and Forecast 2025 to 2035, By Country
    • Historical Market Size Value (USD Million) & Volume (Units) Trend Analysis By Market Taxonomy, 2020 to 2024
    • Market Size Value (USD Million) & Volume (Units) Forecast By Market Taxonomy, 2025 to 2035
      • By Country
        • Brazil
        • Argentina
        • Rest of Latin America
      • By Product Type
      • By Technology
      • By End User
    • Market Attractiveness Analysis
      • By Country
      • By Product Type
      • By Technology
      • By End User
    • Key Takeaways
  11. Western Europe Market Analysis 2020 to 2024 and Forecast 2025 to 2035, By Country
    • Historical Market Size Value (USD Million) & Volume (Units) Trend Analysis By Market Taxonomy, 2020 to 2024
    • Market Size Value (USD Million) & Volume (Units) Forecast By Market Taxonomy, 2025 to 2035
      • By Country
        • Germany
        • Italy
        • France
        • UK
        • Spain
        • BENELUX
        • Nordic Countries
        • Rest of Western Europe
      • By Product Type
      • By Technology
      • By End User
    • Market Attractiveness Analysis
      • By Country
      • By Product Type
      • By Technology
      • By End User
    • Key Takeaways
  12. Eastern Europe Market Analysis 2020 to 2024 and Forecast 2025 to 2035, By Country
    • Historical Market Size Value (USD Million) & Volume (Units) Trend Analysis By Market Taxonomy, 2020 to 2024
    • Market Size Value (USD Million) & Volume (Units) Forecast By Market Taxonomy, 2025 to 2035
      • By Country
        • Russia
        • Hungary
        • Poland
        • Rest of Eastern Europe
      • By Product Type
      • By Technology
      • By End User
    • Market Attractiveness Analysis
      • By Country
      • By Product Type
      • By Technology
      • By End User
    • Key Takeaways
  13. East Asia Market Analysis 2020 to 2024 and Forecast 2025 to 2035, By Country
    • Historical Market Size Value (USD Million) & Volume (Units) Trend Analysis By Market Taxonomy, 2020 to 2024
    • Market Size Value (USD Million) & Volume (Units) Forecast By Market Taxonomy, 2025 to 2035
      • By Country
        • China
        • Japan
        • South Korea
      • By Product Type
      • By Technology
      • By End User
    • Market Attractiveness Analysis
      • By Country
      • By Product Type
      • By Technology
      • By End User
    • Key Takeaways
  14. South Asia Market Analysis 2020 to 2024 and Forecast 2025 to 2035, By Country
    • Historical Market Size Value (USD Million) & Volume (Units) Trend Analysis By Market Taxonomy, 2020 to 2024
    • Market Size Value (USD Million) & Volume (Units) Forecast By Market Taxonomy, 2025 to 2035
      • By Country
        • India
        • ASEAN Countries
        • Australia & New Zealand
        • Rest of South Asia
      • By Product Type
      • By Technology
      • By End User
    • Market Attractiveness Analysis
      • By Country
      • By Product Type
      • By Technology
      • By End User
    • Key Takeaways
  15. MEA Market Analysis 2020 to 2024 and Forecast 2025 to 2035, By Country
    • Historical Market Size Value (USD Million) & Volume (Units) Trend Analysis By Market Taxonomy, 2020 to 2024
    • Market Size Value (USD Million) & Volume (Units) Forecast By Market Taxonomy, 2025 to 2035
      • By Country
        • Saudi Arabia
        • Tukiye
        • South Africa
        • Other African Union
        • Rest of MEA
      • By Product Type
      • By Technology
      • By End User
    • Market Attractiveness Analysis
      • By Country
      • By Product Type
      • By Technology
      • By End User
    • Key Takeaways
  16. Key Countries Market Analysis
    • USA
      • Pricing Analysis
      • Market Share Analysis, 2024
        • By Product Type
        • By Technology
        • By End User
    • Brazil
      • Pricing Analysis
      • Market Share Analysis, 2024
        • By Product Type
        • By Technology
        • By End User
    • China
      • Pricing Analysis
      • Market Share Analysis, 2024
        • By Product Type
        • By Technology
        • By End User
    • India
      • Pricing Analysis
      • Market Share Analysis, 2024
        • By Product Type
        • By Technology
        • By End User
    • Europe
      • Pricing Analysis
      • Market Share Analysis, 2024
        • By Product Type
        • By Technology
        • By End User
    • Germany
      • Pricing Analysis
      • Market Share Analysis, 2024
        • By Product Type
        • By Technology
        • By End User
    • France
      • Pricing Analysis
      • Market Share Analysis, 2024
        • By Product Type
        • By Technology
        • By End User
    • UK
      • Pricing Analysis
      • Market Share Analysis, 2024
        • By Product Type
        • By Technology
        • By End User
  17. Market Structure Analysis
    • Competition Dashboard
    • Competition Benchmarking
    • Market Share Analysis of Top Players
      • By Regional
      • By Product Type
      • By Technology
      • By End User
  18. Competition Analysis
    • Competition Deep Dive
      • SPECS GmbH
        • Overview
        • Product Portfolio
        • Profitability by Market Segments (Product/Technology /End User/Region)
        • Sales Footprint
        • Strategy Overview
          • Marketing Strategy
          • Product Strategy
          • Channel Strategy
      • Scienta Omicron
        • Overview
        • Product Portfolio
        • Profitability by Market Segments (Product/Age /Sales Channel/Region)
        • Sales Footprint
        • Strategy Overview
          • Marketing Strategy
          • Product Strategy
          • Channel Strategy
      • MB Scientific AB
        • Overview
        • Product Portfolio
        • Profitability by Market Segments (Product/Age /Sales Channel/Region)
        • Sales Footprint
        • Strategy Overview
          • Marketing Strategy
          • Product Strategy
          • Channel Strategy
      • Thermo Fisher Scientific
        • Overview
        • Product Portfolio
        • Profitability by Market Segments (Product/Age /Sales Channel/Region)
        • Sales Footprint
        • Strategy Overview
          • Marketing Strategy
          • Product Strategy
          • Channel Strategy
      • RHK Technology
        • Overview
        • Product Portfolio
        • Profitability by Market Segments (Product/Age /Sales Channel/Region)
        • Sales Footprint
        • Strategy Overview
          • Marketing Strategy
          • Product Strategy
          • Channel Strategy
      • Others
        • Overview
        • Product Portfolio
        • Profitability by Market Segments (Product/Age /Sales Channel/Region)
        • Sales Footprint
        • Strategy Overview
          • Marketing Strategy
          • Product Strategy
          • Channel Strategy
  19. Assumptions & Acronyms Used
  20. Research Methodology

List of Tables

  • Table 1: Global Market Value (USD Million) Forecast by Region, 2020-2035
  • Table 2: Global Market Volume (Units) Forecast by Region, 2020-2035
  • Table 3: Global Market Value (USD Million) Forecast by Product Type, 2020-2035
  • Table 4: Global Market Volume (Units) Forecast by Product Type, 2020-2035
  • Table 5: Global Market Value (USD Million) Forecast by Technology, 2020-2035
  • Table 6: Global Market Volume (Units) Forecast by Technology, 2020-2035
  • Table 7: Global Market Value (USD Million) Forecast by End User, 2020-2035
  • Table 8: Global Market Volume (Units) Forecast by End User, 2020-2035
  • Table 9: North America Market Value (USD Million) Forecast by Country, 2020-2035
  • Table 10: North America Market Volume (Units) Forecast by Country, 2020-2035
  • Table 11: North America Market Value (USD Million) Forecast by Product Type, 2020-2035
  • Table 12: North America Market Volume (Units) Forecast by Product Type, 2020-2035
  • Table 13: North America Market Value (USD Million) Forecast by Technology, 2020-2035
  • Table 14: North America Market Volume (Units) Forecast by Technology, 2020-2035
  • Table 15: North America Market Value (USD Million) Forecast by End User, 2020-2035
  • Table 16: North America Market Volume (Units) Forecast by End User, 2020-2035
  • Table 17: Latin America Market Value (USD Million) Forecast by Country, 2020-2035
  • Table 18: Latin America Market Volume (Units) Forecast by Country, 2020-2035
  • Table 19: Latin America Market Value (USD Million) Forecast by Product Type, 2020-2035
  • Table 20: Latin America Market Volume (Units) Forecast by Product Type, 2020-2035
  • Table 21: Latin America Market Value (USD Million) Forecast by Technology, 2020-2035
  • Table 22: Latin America Market Volume (Units) Forecast by Technology, 2020-2035
  • Table 23: Latin America Market Value (USD Million) Forecast by End User, 2020-2035
  • Table 24: Latin America Market Volume (Units) Forecast by End User, 2020-2035
  • Table 25: Western Europe Market Value (USD Million) Forecast by Country, 2020-2035
  • Table 26: Western Europe Market Volume (Units) Forecast by Country, 2020-2035
  • Table 27: Western Europe Market Value (USD Million) Forecast by Product Type, 2020-2035
  • Table 28: Western Europe Market Volume (Units) Forecast by Product Type, 2020-2035
  • Table 29: Western Europe Market Value (USD Million) Forecast by Technology, 2020-2035
  • Table 30: Western Europe Market Volume (Units) Forecast by Technology, 2020-2035
  • Table 31: Western Europe Market Value (USD Million) Forecast by End User, 2020-2035
  • Table 32: Western Europe Market Volume (Units) Forecast by End User, 2020-2035
  • Table 33: Eastern Europe Market Value (USD Million) Forecast by Country, 2020-2035
  • Table 34: Eastern Europe Market Volume (Units) Forecast by Country, 2020-2035
  • Table 35: Eastern Europe Market Value (USD Million) Forecast by Product Type, 2020-2035
  • Table 36: Eastern Europe Market Volume (Units) Forecast by Product Type, 2020-2035
  • Table 37: Eastern Europe Market Value (USD Million) Forecast by Technology, 2020-2035
  • Table 38: Eastern Europe Market Volume (Units) Forecast by Technology, 2020-2035
  • Table 39: Eastern Europe Market Value (USD Million) Forecast by End User, 2020-2035
  • Table 40: Eastern Europe Market Volume (Units) Forecast by End User, 2020-2035
  • Table 41: East Asia Market Value (USD Million) Forecast by Country, 2020-2035
  • Table 42: East Asia Market Volume (Units) Forecast by Country, 2020-2035
  • Table 43: East Asia Market Value (USD Million) Forecast by Product Type, 2020-2035
  • Table 44: East Asia Market Volume (Units) Forecast by Product Type, 2020-2035
  • Table 45: East Asia Market Value (USD Million) Forecast by Technology, 2020-2035
  • Table 46: East Asia Market Volume (Units) Forecast by Technology, 2020-2035
  • Table 47: East Asia Market Value (USD Million) Forecast by End User, 2020-2035
  • Table 48: East Asia Market Volume (Units) Forecast by End User, 2020-2035
  • Table 49: South Asia Market Value (USD Million) Forecast by Country, 2020-2035
  • Table 50: South Asia Market Volume (Units) Forecast by Country, 2020-2035
  • Table 51: South Asia Market Value (USD Million) Forecast by Product Type, 2020-2035
  • Table 52: South Asia Market Volume (Units) Forecast by Product Type, 2020-2035
  • Table 53: South Asia Market Value (USD Million) Forecast by Technology, 2020-2035
  • Table 54: South Asia Market Volume (Units) Forecast by Technology, 2020-2035
  • Table 55: South Asia Market Value (USD Million) Forecast by End User, 2020-2035
  • Table 56: South Asia Market Volume (Units) Forecast by End User, 2020-2035
  • Table 57: MEA Market Value (USD Million) Forecast by Country, 2020-2035
  • Table 58: MEA Market Volume (Units) Forecast by Country, 2020-2035
  • Table 59: MEA Market Value (USD Million) Forecast by Product Type, 2020-2035
  • Table 60: MEA Market Volume (Units) Forecast by Product Type, 2020-2035
  • Table 61: MEA Market Value (USD Million) Forecast by Technology, 2020-2035
  • Table 62: MEA Market Volume (Units) Forecast by Technology, 2020-2035
  • Table 63: MEA Market Value (USD Million) Forecast by End User, 2020-2035
  • Table 64: MEA Market Volume (Units) Forecast by End User, 2020-2035

List of Figures

  • Figure 1: Global Market Value (USD Million) by Product Type, 2025-2035
  • Figure 2: Global Market Value (USD Million) by Technology, 2025-2035
  • Figure 3: Global Market Value (USD Million) by End User, 2025-2035
  • Figure 4: Global Market Value (USD Million) by Region, 2025-2035
  • Figure 5: Global Market Value (USD Million) Analysis by Region, 2020-2035
  • Figure 6: Global Market Volume (Units) Analysis by Region, 2020-2035
  • Figure 7: Global Market Value Share (%) and BPS Analysis by Region, 2025-2035
  • Figure 8: Global Market Y-o-Y Growth (%) Projections by Region, 2025-2035
  • Figure 9: Global Market Value (USD Million) Analysis by Product Type, 2020-2035
  • Figure 10: Global Market Volume (Units) Analysis by Product Type, 2020-2035
  • Figure 11: Global Market Value Share (%) and BPS Analysis by Product Type, 2025-2035
  • Figure 12: Global Market Y-o-Y Growth (%) Projections by Product Type, 2025-2035
  • Figure 13: Global Market Value (USD Million) Analysis by Technology, 2020-2035
  • Figure 14: Global Market Volume (Units) Analysis by Technology, 2020-2035
  • Figure 15: Global Market Value Share (%) and BPS Analysis by Technology, 2025-2035
  • Figure 16: Global Market Y-o-Y Growth (%) Projections by Technology, 2025-2035
  • Figure 17: Global Market Value (USD Million) Analysis by End User, 2020-2035
  • Figure 18: Global Market Volume (Units) Analysis by End User, 2020-2035
  • Figure 19: Global Market Value Share (%) and BPS Analysis by End User, 2025-2035
  • Figure 20: Global Market Y-o-Y Growth (%) Projections by End User, 2025-2035
  • Figure 21: Global Market Attractiveness by Product Type, 2025-2035
  • Figure 22: Global Market Attractiveness by Technology, 2025-2035
  • Figure 23: Global Market Attractiveness by End User, 2025-2035
  • Figure 24: Global Market Attractiveness by Region, 2025-2035
  • Figure 25: North America Market Value (USD Million) by Product Type, 2025-2035
  • Figure 26: North America Market Value (USD Million) by Technology, 2025-2035
  • Figure 27: North America Market Value (USD Million) by End User, 2025-2035
  • Figure 28: North America Market Value (USD Million) by Country, 2025-2035
  • Figure 29: North America Market Value (USD Million) Analysis by Country, 2020-2035
  • Figure 30: North America Market Volume (Units) Analysis by Country, 2020-2035
  • Figure 31: North America Market Value Share (%) and BPS Analysis by Country, 2025-2035
  • Figure 32: North America Market Y-o-Y Growth (%) Projections by Country, 2025-2035
  • Figure 33: North America Market Value (USD Million) Analysis by Product Type, 2020-2035
  • Figure 34: North America Market Volume (Units) Analysis by Product Type, 2020-2035
  • Figure 35: North America Market Value Share (%) and BPS Analysis by Product Type, 2025-2035
  • Figure 36: North America Market Y-o-Y Growth (%) Projections by Product Type, 2025-2035
  • Figure 37: North America Market Value (USD Million) Analysis by Technology, 2020-2035
  • Figure 38: North America Market Volume (Units) Analysis by Technology, 2020-2035
  • Figure 39: North America Market Value Share (%) and BPS Analysis by Technology, 2025-2035
  • Figure 40: North America Market Y-o-Y Growth (%) Projections by Technology, 2025-2035
  • Figure 41: North America Market Value (USD Million) Analysis by End User, 2020-2035
  • Figure 42: North America Market Volume (Units) Analysis by End User, 2020-2035
  • Figure 43: North America Market Value Share (%) and BPS Analysis by End User, 2025-2035
  • Figure 44: North America Market Y-o-Y Growth (%) Projections by End User, 2025-2035
  • Figure 45: North America Market Attractiveness by Product Type, 2025-2035
  • Figure 46: North America Market Attractiveness by Technology, 2025-2035
  • Figure 47: North America Market Attractiveness by End User, 2025-2035
  • Figure 48: North America Market Attractiveness by Country, 2025-2035
  • Figure 49: Latin America Market Value (USD Million) by Product Type, 2025-2035
  • Figure 50: Latin America Market Value (USD Million) by Technology, 2025-2035
  • Figure 51: Latin America Market Value (USD Million) by End User, 2025-2035
  • Figure 52: Latin America Market Value (USD Million) by Country, 2025-2035
  • Figure 53: Latin America Market Value (USD Million) Analysis by Country, 2020-2035
  • Figure 54: Latin America Market Volume (Units) Analysis by Country, 2020-2035
  • Figure 55: Latin America Market Value Share (%) and BPS Analysis by Country, 2025-2035
  • Figure 56: Latin America Market Y-o-Y Growth (%) Projections by Country, 2025-2035
  • Figure 57: Latin America Market Value (USD Million) Analysis by Product Type, 2020-2035
  • Figure 58: Latin America Market Volume (Units) Analysis by Product Type, 2020-2035
  • Figure 59: Latin America Market Value Share (%) and BPS Analysis by Product Type, 2025-2035
  • Figure 60: Latin America Market Y-o-Y Growth (%) Projections by Product Type, 2025-2035
  • Figure 61: Latin America Market Value (USD Million) Analysis by Technology, 2020-2035
  • Figure 62: Latin America Market Volume (Units) Analysis by Technology, 2020-2035
  • Figure 63: Latin America Market Value Share (%) and BPS Analysis by Technology, 2025-2035
  • Figure 64: Latin America Market Y-o-Y Growth (%) Projections by Technology, 2025-2035
  • Figure 65: Latin America Market Value (USD Million) Analysis by End User, 2020-2035
  • Figure 66: Latin America Market Volume (Units) Analysis by End User, 2020-2035
  • Figure 67: Latin America Market Value Share (%) and BPS Analysis by End User, 2025-2035
  • Figure 68: Latin America Market Y-o-Y Growth (%) Projections by End User, 2025-2035
  • Figure 69: Latin America Market Attractiveness by Product Type, 2025-2035
  • Figure 70: Latin America Market Attractiveness by Technology, 2025-2035
  • Figure 71: Latin America Market Attractiveness by End User, 2025-2035
  • Figure 72: Latin America Market Attractiveness by Country, 2025-2035
  • Figure 73: Western Europe Market Value (USD Million) by Product Type, 2025-2035
  • Figure 74: Western Europe Market Value (USD Million) by Technology, 2025-2035
  • Figure 75: Western Europe Market Value (USD Million) by End User, 2025-2035
  • Figure 76: Western Europe Market Value (USD Million) by Country, 2025-2035
  • Figure 77: Western Europe Market Value (USD Million) Analysis by Country, 2020-2035
  • Figure 78: Western Europe Market Volume (Units) Analysis by Country, 2020-2035
  • Figure 79: Western Europe Market Value Share (%) and BPS Analysis by Country, 2025-2035
  • Figure 80: Western Europe Market Y-o-Y Growth (%) Projections by Country, 2025-2035
  • Figure 81: Western Europe Market Value (USD Million) Analysis by Product Type, 2020-2035
  • Figure 82: Western Europe Market Volume (Units) Analysis by Product Type, 2020-2035
  • Figure 83: Western Europe Market Value Share (%) and BPS Analysis by Product Type, 2025-2035
  • Figure 84: Western Europe Market Y-o-Y Growth (%) Projections by Product Type, 2025-2035
  • Figure 85: Western Europe Market Value (USD Million) Analysis by Technology, 2020-2035
  • Figure 86: Western Europe Market Volume (Units) Analysis by Technology, 2020-2035
  • Figure 87: Western Europe Market Value Share (%) and BPS Analysis by Technology, 2025-2035
  • Figure 88: Western Europe Market Y-o-Y Growth (%) Projections by Technology, 2025-2035
  • Figure 89: Western Europe Market Value (USD Million) Analysis by End User, 2020-2035
  • Figure 90: Western Europe Market Volume (Units) Analysis by End User, 2020-2035
  • Figure 91: Western Europe Market Value Share (%) and BPS Analysis by End User, 2025-2035
  • Figure 92: Western Europe Market Y-o-Y Growth (%) Projections by End User, 2025-2035
  • Figure 93: Western Europe Market Attractiveness by Product Type, 2025-2035
  • Figure 94: Western Europe Market Attractiveness by Technology, 2025-2035
  • Figure 95: Western Europe Market Attractiveness by End User, 2025-2035
  • Figure 96: Western Europe Market Attractiveness by Country, 2025-2035
  • Figure 97: Eastern Europe Market Value (USD Million) by Product Type, 2025-2035
  • Figure 98: Eastern Europe Market Value (USD Million) by Technology, 2025-2035
  • Figure 99: Eastern Europe Market Value (USD Million) by End User, 2025-2035
  • Figure 100: Eastern Europe Market Value (USD Million) by Country, 2025-2035
  • Figure 101: Eastern Europe Market Value (USD Million) Analysis by Country, 2020-2035
  • Figure 102: Eastern Europe Market Volume (Units) Analysis by Country, 2020-2035
  • Figure 103: Eastern Europe Market Value Share (%) and BPS Analysis by Country, 2025-2035
  • Figure 104: Eastern Europe Market Y-o-Y Growth (%) Projections by Country, 2025-2035
  • Figure 105: Eastern Europe Market Value (USD Million) Analysis by Product Type, 2020-2035
  • Figure 106: Eastern Europe Market Volume (Units) Analysis by Product Type, 2020-2035
  • Figure 107: Eastern Europe Market Value Share (%) and BPS Analysis by Product Type, 2025-2035
  • Figure 108: Eastern Europe Market Y-o-Y Growth (%) Projections by Product Type, 2025-2035
  • Figure 109: Eastern Europe Market Value (USD Million) Analysis by Technology, 2020-2035
  • Figure 110: Eastern Europe Market Volume (Units) Analysis by Technology, 2020-2035
  • Figure 111: Eastern Europe Market Value Share (%) and BPS Analysis by Technology, 2025-2035
  • Figure 112: Eastern Europe Market Y-o-Y Growth (%) Projections by Technology, 2025-2035
  • Figure 113: Eastern Europe Market Value (USD Million) Analysis by End User, 2020-2035
  • Figure 114: Eastern Europe Market Volume (Units) Analysis by End User, 2020-2035
  • Figure 115: Eastern Europe Market Value Share (%) and BPS Analysis by End User, 2025-2035
  • Figure 116: Eastern Europe Market Y-o-Y Growth (%) Projections by End User, 2025-2035
  • Figure 117: Eastern Europe Market Attractiveness by Product Type, 2025-2035
  • Figure 118: Eastern Europe Market Attractiveness by Technology, 2025-2035
  • Figure 119: Eastern Europe Market Attractiveness by End User, 2025-2035
  • Figure 120: Eastern Europe Market Attractiveness by Country, 2025-2035
  • Figure 121: East Asia Market Value (USD Million) by Product Type, 2025-2035
  • Figure 122: East Asia Market Value (USD Million) by Technology, 2025-2035
  • Figure 123: East Asia Market Value (USD Million) by End User, 2025-2035
  • Figure 124: East Asia Market Value (USD Million) by Country, 2025-2035
  • Figure 125: East Asia Market Value (USD Million) Analysis by Country, 2020-2035
  • Figure 126: East Asia Market Volume (Units) Analysis by Country, 2020-2035
  • Figure 127: East Asia Market Value Share (%) and BPS Analysis by Country, 2025-2035
  • Figure 128: East Asia Market Y-o-Y Growth (%) Projections by Country, 2025-2035
  • Figure 129: East Asia Market Value (USD Million) Analysis by Product Type, 2020-2035
  • Figure 130: East Asia Market Volume (Units) Analysis by Product Type, 2020-2035
  • Figure 131: East Asia Market Value Share (%) and BPS Analysis by Product Type, 2025-2035
  • Figure 132: East Asia Market Y-o-Y Growth (%) Projections by Product Type, 2025-2035
  • Figure 133: East Asia Market Value (USD Million) Analysis by Technology, 2020-2035
  • Figure 134: East Asia Market Volume (Units) Analysis by Technology, 2020-2035
  • Figure 135: East Asia Market Value Share (%) and BPS Analysis by Technology, 2025-2035
  • Figure 136: East Asia Market Y-o-Y Growth (%) Projections by Technology, 2025-2035
  • Figure 137: East Asia Market Value (USD Million) Analysis by End User, 2020-2035
  • Figure 138: East Asia Market Volume (Units) Analysis by End User, 2020-2035
  • Figure 139: East Asia Market Value Share (%) and BPS Analysis by End User, 2025-2035
  • Figure 140: East Asia Market Y-o-Y Growth (%) Projections by End User, 2025-2035
  • Figure 141: East Asia Market Attractiveness by Product Type, 2025-2035
  • Figure 142: East Asia Market Attractiveness by Technology, 2025-2035
  • Figure 143: East Asia Market Attractiveness by End User, 2025-2035
  • Figure 144: East Asia Market Attractiveness by Country, 2025-2035
  • Figure 145: South Asia Market Value (USD Million) by Product Type, 2025-2035
  • Figure 146: South Asia Market Value (USD Million) by Technology, 2025-2035
  • Figure 147: South Asia Market Value (USD Million) by End User, 2025-2035
  • Figure 148: South Asia Market Value (USD Million) by Country, 2025-2035
  • Figure 149: South Asia Market Value (USD Million) Analysis by Country, 2020-2035
  • Figure 150: South Asia Market Volume (Units) Analysis by Country, 2020-2035
  • Figure 151: South Asia Market Value Share (%) and BPS Analysis by Country, 2025-2035
  • Figure 152: South Asia Market Y-o-Y Growth (%) Projections by Country, 2025-2035
  • Figure 153: South Asia Market Value (USD Million) Analysis by Product Type, 2020-2035
  • Figure 154: South Asia Market Volume (Units) Analysis by Product Type, 2020-2035
  • Figure 155: South Asia Market Value Share (%) and BPS Analysis by Product Type, 2025-2035
  • Figure 156: South Asia Market Y-o-Y Growth (%) Projections by Product Type, 2025-2035
  • Figure 157: South Asia Market Value (USD Million) Analysis by Technology, 2020-2035
  • Figure 158: South Asia Market Volume (Units) Analysis by Technology, 2020-2035
  • Figure 159: South Asia Market Value Share (%) and BPS Analysis by Technology, 2025-2035
  • Figure 160: South Asia Market Y-o-Y Growth (%) Projections by Technology, 2025-2035
  • Figure 161: South Asia Market Value (USD Million) Analysis by End User, 2020-2035
  • Figure 162: South Asia Market Volume (Units) Analysis by End User, 2020-2035
  • Figure 163: South Asia Market Value Share (%) and BPS Analysis by End User, 2025-2035
  • Figure 164: South Asia Market Y-o-Y Growth (%) Projections by End User, 2025-2035
  • Figure 165: South Asia Market Attractiveness by Product Type, 2025-2035
  • Figure 166: South Asia Market Attractiveness by Technology, 2025-2035
  • Figure 167: South Asia Market Attractiveness by End User, 2025-2035
  • Figure 168: South Asia Market Attractiveness by Country, 2025-2035
  • Figure 169: MEA Market Value (USD Million) by Product Type, 2025-2035
  • Figure 170: MEA Market Value (USD Million) by Technology, 2025-2035
  • Figure 171: MEA Market Value (USD Million) by End User, 2025-2035
  • Figure 172: MEA Market Value (USD Million) by Country, 2025-2035
  • Figure 173: MEA Market Value (USD Million) Analysis by Country, 2020-2035
  • Figure 174: MEA Market Volume (Units) Analysis by Country, 2020-2035
  • Figure 175: MEA Market Value Share (%) and BPS Analysis by Country, 2025-2035
  • Figure 176: MEA Market Y-o-Y Growth (%) Projections by Country, 2025-2035
  • Figure 177: MEA Market Value (USD Million) Analysis by Product Type, 2020-2035
  • Figure 178: MEA Market Volume (Units) Analysis by Product Type, 2020-2035
  • Figure 179: MEA Market Value Share (%) and BPS Analysis by Product Type, 2025-2035
  • Figure 180: MEA Market Y-o-Y Growth (%) Projections by Product Type, 2025-2035
  • Figure 181: MEA Market Value (USD Million) Analysis by Technology, 2020-2035
  • Figure 182: MEA Market Volume (Units) Analysis by Technology, 2020-2035
  • Figure 183: MEA Market Value Share (%) and BPS Analysis by Technology, 2025-2035
  • Figure 184: MEA Market Y-o-Y Growth (%) Projections by Technology, 2025-2035
  • Figure 185: MEA Market Value (USD Million) Analysis by End User, 2020-2035
  • Figure 186: MEA Market Volume (Units) Analysis by End User, 2020-2035
  • Figure 187: MEA Market Value Share (%) and BPS Analysis by End User, 2025-2035
  • Figure 188: MEA Market Y-o-Y Growth (%) Projections by End User, 2025-2035
  • Figure 189: MEA Market Attractiveness by Product Type, 2025-2035
  • Figure 190: MEA Market Attractiveness by Technology, 2025-2035
  • Figure 191: MEA Market Attractiveness by End User, 2025-2035
  • Figure 192: MEA Market Attractiveness by Country, 2025-2035

Frequently Asked Questions

How big is the Angle-Resolved Photoemission Spectroscopy Market in 2025?

The global Angle-Resolved Photoemission Spectroscopy Market is estimated to be valued at USD 93.3 million in 2025.

What will be the size of the Angle-Resolved Photoemission Spectroscopy Market in 2035?

The market size for the Angle-Resolved Photoemission Spectroscopy Market is projected to reach approximately USD 292.5 million by 2035.

How much will the Angle-Resolved Photoemission Spectroscopy Market grow between 2025 and 2035?

The Angle-Resolved Photoemission Spectroscopy Market is expected to grow at a CAGR of 12.1% between 2025 and 2035.

What are the key product in the Angle-Resolved Photoemission Spectroscopy Market?

The key product formats in the Angle-Resolved Photoemission Spectroscopy Market include Laser-based ARPES Systems, Synchrotron-based ARPES Systems and Lab-based ARPES Systems.

Which technology type segment will contribute a significant share in the Angle-Resolved Photoemission Spectroscopy Market in 2025?

In terms of technology, Conventional ARPES segment is projected to command the highest share at 53.3% in the Angle-Resolved Photoemission Spectroscopy Market in 2025.

Explore Similar Insights

Future Market Insights

Angle-Resolved Photoemission Spectroscopy Market