Atomic Absorption Spectroscopy Market Size and Share Forecast Outlook 2025 to 2035

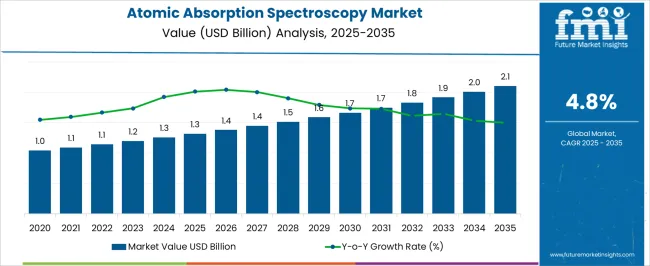
The Atomic Absorption Spectroscopy Market is estimated to be valued at USD 1.3 billion in 2025 and is projected to reach USD 2.1 billion by 2035, registering a compound annual growth rate (CAGR) of 4.8% over the forecast period.
Quick Stats for Atomic Absorption Spectroscopy Market

  • Atomic Absorption Spectroscopy Market Value (2025): USD 1.3 billion
  • Atomic Absorption Spectroscopy Market Forecast Value (2035): USD 2.1 billion
  • Atomic Absorption Spectroscopy Market Forecast CAGR: 4.8%
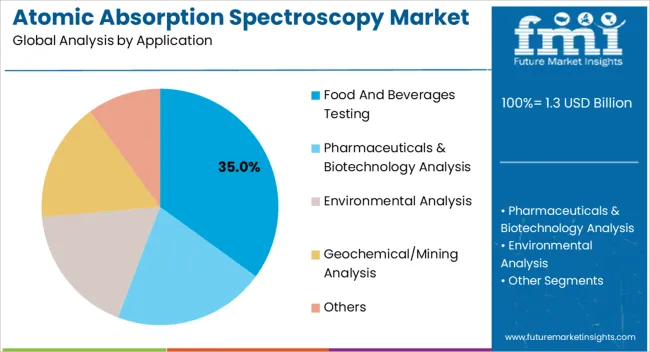
  • Leading Segment in Atomic Absorption Spectroscopy Market in 2025: Food And Beverages Testing (35.0%)
  • Key Growth Regions in Atomic Absorption Spectroscopy Market: North America, Asia-Pacific, Europe
  • Top Key Players in Atomic Absorption Spectroscopy Market: Thermo Fisher Scientific Inc., Agilent Technologies, PerkinElmer Inc., Shimadzu Corporation, Hitachi High-Technologies Corporation, GBC Scientific Equipment, Analytik Jena AG, Bruker Corporation, Rigaku Corporation, Aurora Biomed, Buck Scientific, PG Instruments Limited

Atomic Absorption Spectroscopy Market Market Value Analysis

Atomic Absorption Spectroscopy Market Key Takeaways

Metric Value
Atomic Absorption Spectroscopy Market Estimated Value in (2025 E) USD 1.3 billion
Atomic Absorption Spectroscopy Market Forecast Value in (2035 F) USD 2.1 billion
Forecast CAGR (2025 to 2035) 4.8%

Why is the Atomic Absorption Spectroscopy Market Growing?

The Atomic Absorption Spectroscopy market is being driven by increasing demand for precise elemental analysis across a wide range of industries. In the current market environment, the need for accurate detection of trace metals in various matrices has been heightened by stringent regulatory requirements, particularly in sectors such as pharmaceuticals, environmental testing, and food safety. The market is expected to grow steadily as industries seek faster, more reliable, and cost-effective analytical solutions.

The expanding focus on product quality, contamination control, and compliance with global safety standards is fueling the adoption of spectroscopy techniques. Furthermore, advancements in automation, data processing, and sensor integration are making these systems more accessible to laboratories with varying budgets and technical expertise. The trend toward portable and benchtop systems has also contributed to increased uptake in smaller laboratories.

Looking ahead, opportunities are seen in emerging markets where infrastructure development and rising health concerns are expected to boost demand The Atomic Absorption Spectroscopy market is set to remain an essential tool for quality assurance and research applications across industries.

Segmental Analysis

The atomic absorption spectroscopy market is segmented by application, end use, and geographic regions. By application, atomic absorption spectroscopy market is divided into Food And Beverages Testing, Pharmaceuticals & Biotechnology Analysis, Environmental Analysis, Geochemical/Mining Analysis, and Others. In terms of end use, atomic absorption spectroscopy market is classified into Pharmaceutical Industry, Mining Industry, Petrochemical Industry, Agriculture Industry, and Others. Regionally, the atomic absorption spectroscopy industry is classified into North America, Latin America, Western Europe, Eastern Europe, Balkan & Baltic Countries, Russia & Belarus, Central Asia, East Asia, South Asia & Pacific, and the Middle East & Africa.
Insights into the Food And Beverages Testing Segment

Atomic Absorption Spectroscopy Market Analysis By Application

The Food And Beverages Testing segment is projected to account for 35.00% of the Atomic Absorption Spectroscopy market revenue in 2025, establishing it as one of the largest application areas. This growth is being attributed to rising concerns about food safety, contamination, and compliance with global nutritional standards. Spectroscopy systems are increasingly being used to detect trace elements such as lead, arsenic, and cadmium, which can adversely affect consumer health.

The demand for rapid testing in supply chains, especially in processed and packaged foods, has further supported the segment’s expansion. Moreover, regulatory agencies have placed stricter guidelines for permissible metal content, encouraging manufacturers and testing laboratories to adopt reliable analysis methods.

The portability and ease of calibration of modern spectroscopy instruments have enabled faster on-site testing, reducing turnaround times for food processors and distributors As consumers demand higher transparency and safety assurance, the role of atomic absorption systems in maintaining product quality is expected to remain pivotal, driving sustained growth in this application.
Insights into the Pharmaceutical Industry Segment

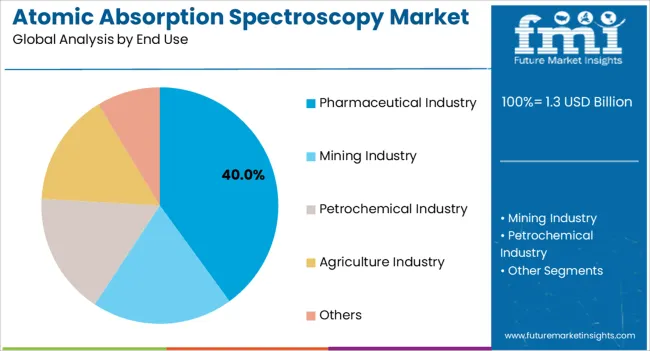
Atomic Absorption Spectroscopy Market Analysis By End Use

The Pharmaceutical Industry segment is estimated to hold 40.00% of the Atomic Absorption Spectroscopy market revenue in 2025, making it the largest end-use sector. This leading position is being supported by the critical requirement for trace element analysis in drug formulation, quality control, and contamination monitoring. Pharmaceuticals must adhere to strict regulatory guidelines that demand accurate and repeatable testing of metal impurities and excipient profiles to ensure patient safety.

Atomic Absorption Spectroscopy is being preferred due to its sensitivity, precision, and ability to provide consistent results across diverse sample types. The adoption of advanced instrumentation, including high-throughput systems and automated sample handling, has further contributed to its acceptance in pharmaceutical laboratories. Additionally, research and development efforts focusing on biologics, vaccines, and complex formulations are creating new avenues for spectroscopy applications.

With increasing global demand for innovative therapies and the expansion of clinical research facilities, the need for robust analytical tools is expected to grow The segment’s reliance on proven methodologies and regulatory compliance ensures that spectroscopy will continue to play a central role in pharmaceutical quality assurance.

Market Overview

Atomic Absorption Spectroscopy Market Overview

Atomic absorption spectroscopy is a type of quantitative analysis wherein a specific wavelength of light absorbed by atoms in the neutral state is detected or recorded. The more the number of atoms, more is the intensity of absorption and vice-versa. This can also be called as metal analysis spectroscopy as it mainly used for metal analysis.

In atomic absorption spectroscopy, atomic spectroscopy technique is used that plays a very important role in various applications in determining the elemental composition of a component.

Atomic absorption spectroscopy finds huge applications in the analysis for trace metals in soils, lakes, rivers, oceans, and drinking water, pharmaceuticals, foods and beverages, geological and mineralogical samples, petroleum products, biological fluids and specimens, and forensic analysis.

The global atomic absorption spectroscopy market has witnessed prodigious growth over the last few years. With the increasing use of atomic absorption spectroscopy in various applications such as clinical analysis, environmental analysis and many other, the global atomic absorption spectroscopy market is poised to grow with a single digit CAGR during the forecast period.
Analysis of Atomic Absorption Spectroscopy Market By Key Countries

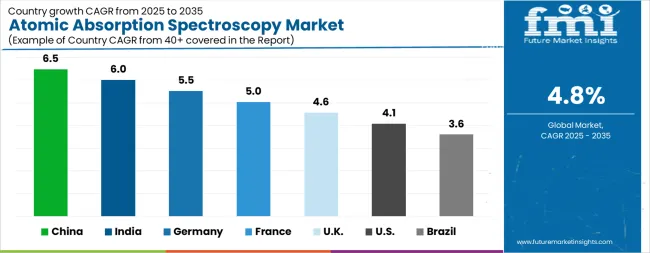
Atomic Absorption Spectroscopy Market Cagr Analysis By Country

Country CAGR
China 6.5%
India 6.0%
Germany 5.5%
France 5.0%
UK 4.6%
USA 4.1%
Brazil 3.6%

Country-wise Analysis

The Atomic Absorption Spectroscopy Market is expected to register a CAGR of 4.8% during the forecast period, exhibiting varied country level momentum. China leads with the highest CAGR of 6.5%, followed by India at 6.0%. Developed markets such as Germany, France, and the UK continue to expand steadily, while the USA is likely to grow at consistent rates. Brazil posts the lowest CAGR at 3.6%, yet still underscores a broadly positive trajectory for the global Atomic Absorption Spectroscopy Market. In 2024, Germany held a dominant revenue in the Western Europe market and is expected to grow with a CAGR of 5.5%. The USA Atomic Absorption Spectroscopy Market is estimated to be valued at USD 487.5 million in 2025 and is anticipated to reach a valuation of USD 727.2 million by 2035. Sales are projected to rise at a CAGR of 4.1% over the forecast period between 2025 and 2035. While Japan and South Korea markets are estimated to be valued at USD 66.8 million and USD 40.1 million respectively in 2025.
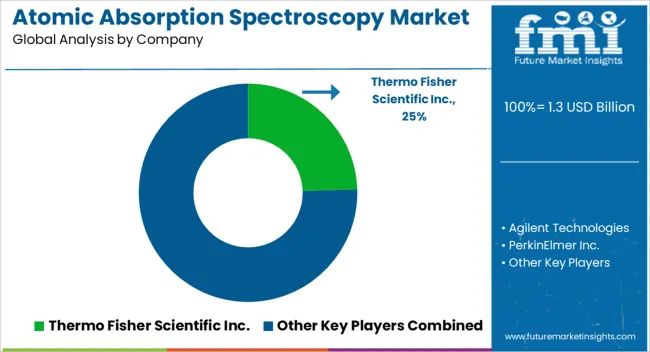
Key Players in the Atomic Absorption Spectroscopy Market

Atomic Absorption Spectroscopy Market Analysis By Company

  • Thermo Fisher Scientific Inc.
  • Agilent Technologies
  • PerkinElmer Inc.
  • Shimadzu Corporation
  • Hitachi High-Technologies Corporation
  • GBC Scientific Equipment
  • Analytik Jena AG
  • Bruker Corporation
  • Rigaku Corporation
  • Aurora Biomed
  • Buck Scientific
  • PG Instruments Limited

Scope of the Report

Item Value
Quantitative Units USD 1.3 Billion
Application Food And Beverages Testing, Pharmaceuticals & Biotechnology Analysis, Environmental Analysis, Geochemical/Mining Analysis, and Others
End Use Pharmaceutical Industry, Mining Industry, Petrochemical Industry, Agriculture Industry, and Others
Regions Covered North America, Europe, Asia-Pacific, Latin America, Middle East & Africa
Country Covered United States, Canada, Germany, France, United Kingdom, China, Japan, India, Brazil, South Africa
Key Companies Profiled Thermo Fisher Scientific Inc., Agilent Technologies, PerkinElmer Inc., Shimadzu Corporation, Hitachi High-Technologies Corporation, GBC Scientific Equipment, Analytik Jena AG, Bruker Corporation, Rigaku Corporation, Aurora Biomed, Buck Scientific, and PG Instruments Limited

Atomic Absorption Spectroscopy Market by Segments

Application:

  • Food And Beverages Testing
  • Pharmaceuticals & Biotechnology Analysis
  • Environmental Analysis
  • Geochemical/Mining Analysis
  • Others

End Use:

  • Pharmaceutical Industry
  • Mining Industry
  • Petrochemical Industry
  • Agriculture Industry
  • Others

Region:

  • North America
    • USA
    • Canada
    • Mexico
  • Latin America
    • Brazil
    • Chile
    • Rest of Latin America
  • Western Europe
    • Germany
    • UK
    • Italy
    • Spain
    • France
    • Nordic
    • BENELUX
    • Rest of Western Europe
  • Eastern Europe
    • Russia
    • Poland
    • Hungary
    • Balkan & Baltic
    • Rest of Eastern Europe
  • East Asia
    • China
    • Japan
    • South Korea
  • South Asia and Pacific
    • India
    • ASEAN
    • Australia & New Zealand
    • Rest of South Asia and Pacific
  • Middle East & Africa
    • Kingdom of Saudi Arabia
    • Other GCC Countries
    • Turkiye
    • South Africa
    • Other African Union
    • Rest of Middle East & Africa

Table of Content

  1. Executive Summary
    • Global Market Outlook
    • Demand-side Trends
    • Supply-side Trends
    • Technology Roadmap Analysis
    • Analysis and Recommendations
  2. Market Overview
    • Market Coverage / Taxonomy
    • Market Definition / Scope / Limitations
  3. Market Background
    • Market Dynamics
      • Drivers
      • Restraints
      • Opportunity
      • Trends
    • Scenario Forecast
      • Demand in Optimistic Scenario
      • Demand in Likely Scenario
      • Demand in Conservative Scenario
    • Opportunity Map Analysis
    • Product Life Cycle Analysis
    • Supply Chain Analysis
    • Investment Feasibility Matrix
    • Value Chain Analysis
    • PESTLE and Porter’s Analysis
    • Regulatory Landscape
    • Regional Parent Market Outlook
    • Production and Consumption Statistics
    • Import and Export Statistics
  4. Global Market Analysis 2020 to 2024 and Forecast, 2025 to 2035
    • Historical Market Size Value (USD Million) Analysis, 2020 to 2024
    • Current and Future Market Size Value (USD Million) Projections, 2025 to 2035
      • Y-o-Y Growth Trend Analysis
      • Absolute $ Opportunity Analysis
  5. Global Market Pricing Analysis 2020 to 2024 and Forecast 2025 to 2035
  6. Global Market Analysis 2020 to 2024 and Forecast 2025 to 2035, By Application
    • Introduction / Key Findings
    • Historical Market Size Value (USD Million) Analysis By Application , 2020 to 2024
    • Current and Future Market Size Value (USD Million) Analysis and Forecast By Application , 2025 to 2035
      • Food And Beverages Testing
      • Pharmaceuticals & Biotechnology Analysis
      • Environmental Analysis
      • Geochemical/Mining Analysis
      • Others
    • Y-o-Y Growth Trend Analysis By Application , 2020 to 2024
    • Absolute $ Opportunity Analysis By Application , 2025 to 2035
  7. Global Market Analysis 2020 to 2024 and Forecast 2025 to 2035, By End Use
    • Introduction / Key Findings
    • Historical Market Size Value (USD Million) Analysis By End Use, 2020 to 2024
    • Current and Future Market Size Value (USD Million) Analysis and Forecast By End Use, 2025 to 2035
      • Pharmaceutical Industry
      • Mining Industry
      • Petrochemical Industry
      • Agriculture Industry
      • Others
    • Y-o-Y Growth Trend Analysis By End Use, 2020 to 2024
    • Absolute $ Opportunity Analysis By End Use, 2025 to 2035
  8. Global Market Analysis 2020 to 2024 and Forecast 2025 to 2035, By Region
    • Introduction
    • Historical Market Size Value (USD Million) Analysis By Region, 2020 to 2024
    • Current Market Size Value (USD Million) Analysis and Forecast By Region, 2025 to 2035
      • North America
      • Latin America
      • Western Europe
      • Eastern Europe
      • East Asia
      • South Asia and Pacific
      • Middle East & Africa
    • Market Attractiveness Analysis By Region
  9. North America Market Analysis 2020 to 2024 and Forecast 2025 to 2035, By Country
    • Historical Market Size Value (USD Million) Trend Analysis By Market Taxonomy, 2020 to 2024
    • Market Size Value (USD Million) Forecast By Market Taxonomy, 2025 to 2035
      • By Country
        • USA
        • Canada
        • Mexico
      • By Application
      • By End Use
    • Market Attractiveness Analysis
      • By Country
      • By Application
      • By End Use
    • Key Takeaways
  10. Latin America Market Analysis 2020 to 2024 and Forecast 2025 to 2035, By Country
    • Historical Market Size Value (USD Million) Trend Analysis By Market Taxonomy, 2020 to 2024
    • Market Size Value (USD Million) Forecast By Market Taxonomy, 2025 to 2035
      • By Country
        • Brazil
        • Chile
        • Rest of Latin America
      • By Application
      • By End Use
    • Market Attractiveness Analysis
      • By Country
      • By Application
      • By End Use
    • Key Takeaways
  11. Western Europe Market Analysis 2020 to 2024 and Forecast 2025 to 2035, By Country
    • Historical Market Size Value (USD Million) Trend Analysis By Market Taxonomy, 2020 to 2024
    • Market Size Value (USD Million) Forecast By Market Taxonomy, 2025 to 2035
      • By Country
        • Germany
        • UK
        • Italy
        • Spain
        • France
        • Nordic
        • BENELUX
        • Rest of Western Europe
      • By Application
      • By End Use
    • Market Attractiveness Analysis
      • By Country
      • By Application
      • By End Use
    • Key Takeaways
  12. Eastern Europe Market Analysis 2020 to 2024 and Forecast 2025 to 2035, By Country
    • Historical Market Size Value (USD Million) Trend Analysis By Market Taxonomy, 2020 to 2024
    • Market Size Value (USD Million) Forecast By Market Taxonomy, 2025 to 2035
      • By Country
        • Russia
        • Poland
        • Hungary
        • Balkan & Baltic
        • Rest of Eastern Europe
      • By Application
      • By End Use
    • Market Attractiveness Analysis
      • By Country
      • By Application
      • By End Use
    • Key Takeaways
  13. East Asia Market Analysis 2020 to 2024 and Forecast 2025 to 2035, By Country
    • Historical Market Size Value (USD Million) Trend Analysis By Market Taxonomy, 2020 to 2024
    • Market Size Value (USD Million) Forecast By Market Taxonomy, 2025 to 2035
      • By Country
        • China
        • Japan
        • South Korea
      • By Application
      • By End Use
    • Market Attractiveness Analysis
      • By Country
      • By Application
      • By End Use
    • Key Takeaways
  14. South Asia and Pacific Market Analysis 2020 to 2024 and Forecast 2025 to 2035, By Country
    • Historical Market Size Value (USD Million) Trend Analysis By Market Taxonomy, 2020 to 2024
    • Market Size Value (USD Million) Forecast By Market Taxonomy, 2025 to 2035
      • By Country
        • India
        • ASEAN
        • Australia & New Zealand
        • Rest of South Asia and Pacific
      • By Application
      • By End Use
    • Market Attractiveness Analysis
      • By Country
      • By Application
      • By End Use
    • Key Takeaways
  15. Middle East & Africa Market Analysis 2020 to 2024 and Forecast 2025 to 2035, By Country
    • Historical Market Size Value (USD Million) Trend Analysis By Market Taxonomy, 2020 to 2024
    • Market Size Value (USD Million) Forecast By Market Taxonomy, 2025 to 2035
      • By Country
        • Kingdom of Saudi Arabia
        • Other GCC Countries
        • Turkiye
        • South Africa
        • Other African Union
        • Rest of Middle East & Africa
      • By Application
      • By End Use
    • Market Attractiveness Analysis
      • By Country
      • By Application
      • By End Use
    • Key Takeaways
  16. Key Countries Market Analysis
    • USA
      • Pricing Analysis
      • Market Share Analysis, 2024
        • By Application
        • By End Use
    • Canada
      • Pricing Analysis
      • Market Share Analysis, 2024
        • By Application
        • By End Use
    • Mexico
      • Pricing Analysis
      • Market Share Analysis, 2024
        • By Application
        • By End Use
    • Brazil
      • Pricing Analysis
      • Market Share Analysis, 2024
        • By Application
        • By End Use
    • Chile
      • Pricing Analysis
      • Market Share Analysis, 2024
        • By Application
        • By End Use
    • Germany
      • Pricing Analysis
      • Market Share Analysis, 2024
        • By Application
        • By End Use
    • UK
      • Pricing Analysis
      • Market Share Analysis, 2024
        • By Application
        • By End Use
    • Italy
      • Pricing Analysis
      • Market Share Analysis, 2024
        • By Application
        • By End Use
    • Spain
      • Pricing Analysis
      • Market Share Analysis, 2024
        • By Application
        • By End Use
    • France
      • Pricing Analysis
      • Market Share Analysis, 2024
        • By Application
        • By End Use
    • India
      • Pricing Analysis
      • Market Share Analysis, 2024
        • By Application
        • By End Use
    • ASEAN
      • Pricing Analysis
      • Market Share Analysis, 2024
        • By Application
        • By End Use
    • Australia & New Zealand
      • Pricing Analysis
      • Market Share Analysis, 2024
        • By Application
        • By End Use
    • China
      • Pricing Analysis
      • Market Share Analysis, 2024
        • By Application
        • By End Use
    • Japan
      • Pricing Analysis
      • Market Share Analysis, 2024
        • By Application
        • By End Use
    • South Korea
      • Pricing Analysis
      • Market Share Analysis, 2024
        • By Application
        • By End Use
    • Russia
      • Pricing Analysis
      • Market Share Analysis, 2024
        • By Application
        • By End Use
    • Poland
      • Pricing Analysis
      • Market Share Analysis, 2024
        • By Application
        • By End Use
    • Hungary
      • Pricing Analysis
      • Market Share Analysis, 2024
        • By Application
        • By End Use
    • Kingdom of Saudi Arabia
      • Pricing Analysis
      • Market Share Analysis, 2024
        • By Application
        • By End Use
    • Turkiye
      • Pricing Analysis
      • Market Share Analysis, 2024
        • By Application
        • By End Use
    • South Africa
      • Pricing Analysis
      • Market Share Analysis, 2024
        • By Application
        • By End Use
  17. Market Structure Analysis
    • Competition Dashboard
    • Competition Benchmarking
    • Market Share Analysis of Top Players
      • By Regional
      • By Application
      • By End Use
  18. Competition Analysis
    • Competition Deep Dive
      • Thermo Fisher Scientific Inc.
        • Overview
        • Product Portfolio
        • Profitability by Market Segments (Product/Age /Sales Channel/Region)
        • Sales Footprint
        • Strategy Overview
          • Marketing Strategy
          • Product Strategy
          • Channel Strategy
      • Agilent Technologies
      • PerkinElmer Inc.
      • Shimadzu Corporation
      • Hitachi High-Technologies Corporation
      • GBC Scientific Equipment
      • Analytik Jena AG
      • Bruker Corporation
      • Rigaku Corporation
      • Aurora Biomed
      • Buck Scientific
      • PG Instruments Limited
  19. Assumptions & Acronyms Used
  20. Research Methodology

List of Tables

  • Table 1: Global Market Value (USD Million) Forecast by Region, 2020 to 2035
  • Table 2: Global Market Value (USD Million) Forecast by Application , 2020 to 2035
  • Table 3: Global Market Value (USD Million) Forecast by End Use, 2020 to 2035
  • Table 4: North America Market Value (USD Million) Forecast by Country, 2020 to 2035
  • Table 5: North America Market Value (USD Million) Forecast by Application , 2020 to 2035
  • Table 6: North America Market Value (USD Million) Forecast by End Use, 2020 to 2035
  • Table 7: Latin America Market Value (USD Million) Forecast by Country, 2020 to 2035
  • Table 8: Latin America Market Value (USD Million) Forecast by Application , 2020 to 2035
  • Table 9: Latin America Market Value (USD Million) Forecast by End Use, 2020 to 2035
  • Table 10: Western Europe Market Value (USD Million) Forecast by Country, 2020 to 2035
  • Table 11: Western Europe Market Value (USD Million) Forecast by Application , 2020 to 2035
  • Table 12: Western Europe Market Value (USD Million) Forecast by End Use, 2020 to 2035
  • Table 13: Eastern Europe Market Value (USD Million) Forecast by Country, 2020 to 2035
  • Table 14: Eastern Europe Market Value (USD Million) Forecast by Application , 2020 to 2035
  • Table 15: Eastern Europe Market Value (USD Million) Forecast by End Use, 2020 to 2035
  • Table 16: East Asia Market Value (USD Million) Forecast by Country, 2020 to 2035
  • Table 17: East Asia Market Value (USD Million) Forecast by Application , 2020 to 2035
  • Table 18: East Asia Market Value (USD Million) Forecast by End Use, 2020 to 2035
  • Table 19: South Asia and Pacific Market Value (USD Million) Forecast by Country, 2020 to 2035
  • Table 20: South Asia and Pacific Market Value (USD Million) Forecast by Application , 2020 to 2035
  • Table 21: South Asia and Pacific Market Value (USD Million) Forecast by End Use, 2020 to 2035
  • Table 22: Middle East & Africa Market Value (USD Million) Forecast by Country, 2020 to 2035
  • Table 23: Middle East & Africa Market Value (USD Million) Forecast by Application , 2020 to 2035
  • Table 24: Middle East & Africa Market Value (USD Million) Forecast by End Use, 2020 to 2035

List of Figures

  • Figure 1: Global Market Pricing Analysis
  • Figure 2: Global Market Value (USD Million) Forecast 2020-2035
  • Figure 3: Global Market Value Share and BPS Analysis by Application , 2025 and 2035
  • Figure 4: Global Market Y-o-Y Growth Comparison by Application , 2025-2035
  • Figure 5: Global Market Attractiveness Analysis by Application
  • Figure 6: Global Market Value Share and BPS Analysis by End Use, 2025 and 2035
  • Figure 7: Global Market Y-o-Y Growth Comparison by End Use, 2025-2035
  • Figure 8: Global Market Attractiveness Analysis by End Use
  • Figure 9: Global Market Value (USD Million) Share and BPS Analysis by Region, 2025 and 2035
  • Figure 10: Global Market Y-o-Y Growth Comparison by Region, 2025-2035
  • Figure 11: Global Market Attractiveness Analysis by Region
  • Figure 12: North America Market Incremental Dollar Opportunity, 2025-2035
  • Figure 13: Latin America Market Incremental Dollar Opportunity, 2025-2035
  • Figure 14: Western Europe Market Incremental Dollar Opportunity, 2025-2035
  • Figure 15: Eastern Europe Market Incremental Dollar Opportunity, 2025-2035
  • Figure 16: East Asia Market Incremental Dollar Opportunity, 2025-2035
  • Figure 17: South Asia and Pacific Market Incremental Dollar Opportunity, 2025-2035
  • Figure 18: Middle East & Africa Market Incremental Dollar Opportunity, 2025-2035
  • Figure 19: North America Market Value Share and BPS Analysis by Country, 2025 and 2035
  • Figure 20: North America Market Value Share and BPS Analysis by Application , 2025 and 2035
  • Figure 21: North America Market Y-o-Y Growth Comparison by Application , 2025-2035
  • Figure 22: North America Market Attractiveness Analysis by Application
  • Figure 23: North America Market Value Share and BPS Analysis by End Use, 2025 and 2035
  • Figure 24: North America Market Y-o-Y Growth Comparison by End Use, 2025-2035
  • Figure 25: North America Market Attractiveness Analysis by End Use
  • Figure 26: Latin America Market Value Share and BPS Analysis by Country, 2025 and 2035
  • Figure 27: Latin America Market Value Share and BPS Analysis by Application , 2025 and 2035
  • Figure 28: Latin America Market Y-o-Y Growth Comparison by Application , 2025-2035
  • Figure 29: Latin America Market Attractiveness Analysis by Application
  • Figure 30: Latin America Market Value Share and BPS Analysis by End Use, 2025 and 2035
  • Figure 31: Latin America Market Y-o-Y Growth Comparison by End Use, 2025-2035
  • Figure 32: Latin America Market Attractiveness Analysis by End Use
  • Figure 33: Western Europe Market Value Share and BPS Analysis by Country, 2025 and 2035
  • Figure 34: Western Europe Market Value Share and BPS Analysis by Application , 2025 and 2035
  • Figure 35: Western Europe Market Y-o-Y Growth Comparison by Application , 2025-2035
  • Figure 36: Western Europe Market Attractiveness Analysis by Application
  • Figure 37: Western Europe Market Value Share and BPS Analysis by End Use, 2025 and 2035
  • Figure 38: Western Europe Market Y-o-Y Growth Comparison by End Use, 2025-2035
  • Figure 39: Western Europe Market Attractiveness Analysis by End Use
  • Figure 40: Eastern Europe Market Value Share and BPS Analysis by Country, 2025 and 2035
  • Figure 41: Eastern Europe Market Value Share and BPS Analysis by Application , 2025 and 2035
  • Figure 42: Eastern Europe Market Y-o-Y Growth Comparison by Application , 2025-2035
  • Figure 43: Eastern Europe Market Attractiveness Analysis by Application
  • Figure 44: Eastern Europe Market Value Share and BPS Analysis by End Use, 2025 and 2035
  • Figure 45: Eastern Europe Market Y-o-Y Growth Comparison by End Use, 2025-2035
  • Figure 46: Eastern Europe Market Attractiveness Analysis by End Use
  • Figure 47: East Asia Market Value Share and BPS Analysis by Country, 2025 and 2035
  • Figure 48: East Asia Market Value Share and BPS Analysis by Application , 2025 and 2035
  • Figure 49: East Asia Market Y-o-Y Growth Comparison by Application , 2025-2035
  • Figure 50: East Asia Market Attractiveness Analysis by Application
  • Figure 51: East Asia Market Value Share and BPS Analysis by End Use, 2025 and 2035
  • Figure 52: East Asia Market Y-o-Y Growth Comparison by End Use, 2025-2035
  • Figure 53: East Asia Market Attractiveness Analysis by End Use
  • Figure 54: South Asia and Pacific Market Value Share and BPS Analysis by Country, 2025 and 2035
  • Figure 55: South Asia and Pacific Market Value Share and BPS Analysis by Application , 2025 and 2035
  • Figure 56: South Asia and Pacific Market Y-o-Y Growth Comparison by Application , 2025-2035
  • Figure 57: South Asia and Pacific Market Attractiveness Analysis by Application
  • Figure 58: South Asia and Pacific Market Value Share and BPS Analysis by End Use, 2025 and 2035
  • Figure 59: South Asia and Pacific Market Y-o-Y Growth Comparison by End Use, 2025-2035
  • Figure 60: South Asia and Pacific Market Attractiveness Analysis by End Use
  • Figure 61: Middle East & Africa Market Value Share and BPS Analysis by Country, 2025 and 2035
  • Figure 62: Middle East & Africa Market Value Share and BPS Analysis by Application , 2025 and 2035
  • Figure 63: Middle East & Africa Market Y-o-Y Growth Comparison by Application , 2025-2035
  • Figure 64: Middle East & Africa Market Attractiveness Analysis by Application
  • Figure 65: Middle East & Africa Market Value Share and BPS Analysis by End Use, 2025 and 2035
  • Figure 66: Middle East & Africa Market Y-o-Y Growth Comparison by End Use, 2025-2035
  • Figure 67: Middle East & Africa Market Attractiveness Analysis by End Use
  • Figure 68: Global Market - Tier Structure Analysis
  • Figure 69: Global Market - Company Share Analysis

Frequently Asked Questions

How big is the atomic absorption spectroscopy market in 2025?

The global atomic absorption spectroscopy market is estimated to be valued at USD 1.3 billion in 2025.

What will be the size of atomic absorption spectroscopy market in 2035?

The market size for the atomic absorption spectroscopy market is projected to reach USD 2.1 billion by 2035.

How much will be the atomic absorption spectroscopy market growth between 2025 and 2035?

The atomic absorption spectroscopy market is expected to grow at a 4.8% CAGR between 2025 and 2035.

What are the key product types in the atomic absorption spectroscopy market?

The key product types in atomic absorption spectroscopy market are food and beverages testing, pharmaceuticals & biotechnology analysis, environmental analysis, geochemical/mining analysis and others.

Which end use segment to contribute significant share in the atomic absorption spectroscopy market in 2025?

In terms of end use, pharmaceutical industry segment to command 40.0% share in the atomic absorption spectroscopy market in 2025.

Explore Similar Insights

Future Market Insights

Atomic Absorption Spectroscopy Market

Chat With MaRIA

Chat With

MaRIA

Hi There, I am MaRIA, Your Market Research Intelligence Assistant. How may I help you?