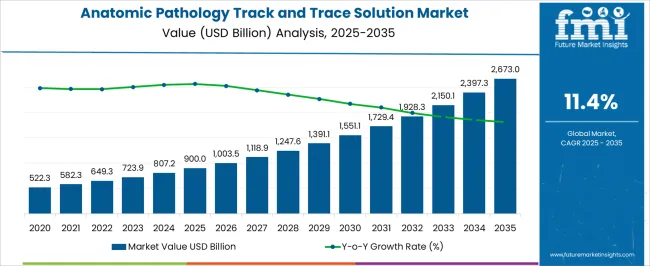
The anatomic pathology track and trace solution market is estimated to be worth USD 2.4 billion by 2034 and is likely to be valued at USD 807.2 million in 2024. According to estimates, the demand for anatomic pathology track and trace solutions is projected to grow at an 11.5% CAGR until 2034.
Attributes | Details |
---|---|
Anatomic Pathology Track and Trace Solution Market Size, 2023 | USD 716.9 million |
Estimated Market Value, 2024 | USD 807.2 million |
Expected Market Value, 2034 | USD 2.4 billion |
Value CAGR (2024 to 2034) | 11.5% |
Rise of Mobile Solutions and Point-of-Care Testing Surges Investments in the Market
The development of pathology point-of-care testing technologies and mobile applications is driving the implementation of real-time specimen tracking. This trend enhances patient care and satisfaction by addressing the need for timely outcomes.
Companies that invest in mobile solutions are strategically positioned to address changing consumer needs and capitalize on the expanding market for accessible healthcare services.
Demand for Cross-Platform Compatibility and Integration Surges in the Market
A market requirement for interoperability is evident in the growing demand for track and trace solutions that seamlessly integrate with various laboratory information systems (LIS) and electronic health record (EHR) platforms.Businesses that offer cross-platform compatible solutions respond to the industry's demand for seamless system integration and data interchange.
Businesses can potentially be positioned as enablers of efficient procedures and participants in the smooth exchange of data throughout the whole healthcare ecosystem by strategically emphasizing interoperability.
Artificial intelligence Incorporation in Pathology Diagnostics Unlocks New Opportunities
More opportunities for better diagnoses arise from using artificial intelligence in track and trace systems. Businesses should look at chances to create AI algorithms that improve specimen identification, automate data processing, and help create more precise and effective diagnostic procedures.
By placing companies at the forefront of technical innovation, this calculated action gives them a competitive advantage in the quickly developing field of pathology.
Trends |
|
---|---|
Opportunities |
|
Challenges |
|
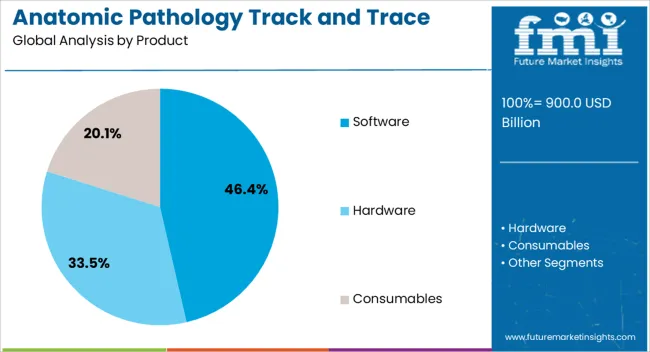
Segment | Software (Product) |
---|---|
Value CAGR (2024 to 2034) | 11.4% |
Based on product, the software segment is projected to rise at an 11.4% CAGR through 2034.
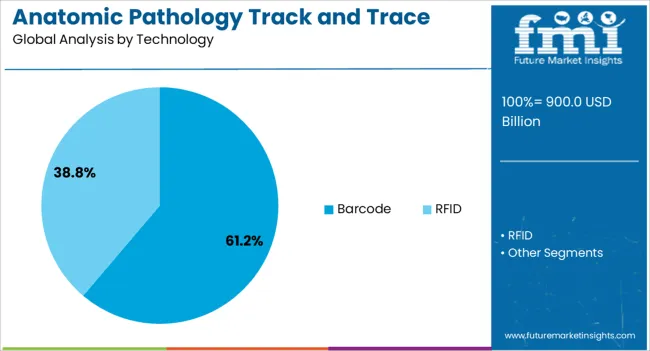
Segment | Barcode (Technology) |
---|---|
Value CAGR (2024 to 2034) | 11.2% |
Based on technology, the barcode segment is anticipated to thrive at an 11.2% CAGR through 2034.
Countries | Value CAGR (2024 to 2034) |
---|---|
The United States | 11.6% |
The United Kingdom | 12.1% |
China | 11.9% |
Japan | 12.0% |
South Korea | 13.6% |
The demand for anatomic pathology track and trace solutions in the United States is projected to rise at an 11.6% CAGR through 2034.
The anatomic pathology track and trace solution market size in the United Kingdom is anticipated to expand at a 12.1% CAGR through 2034.
The demand for anatomic pathology track and trace solutions in China is expected to surge at an 11.9% CAGR through 2034.
The anatomic pathology track and trace solution market growth in Japan is estimated at a 12.0% CAGR through 2034.
The sales of anatomic pathology track and trace solutions in South Korea are predicted to rise at a 13.6% CAGR through 2034.
Anatomic pathology track and trace solution market competition is defined by the dynamic interaction of leading businesses fighting for dominance in a quickly developing healthcare technology industry.
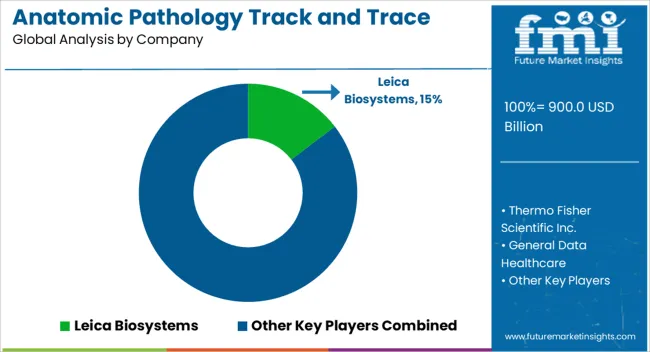
Leica Biosystems and Thermo Fisher Scientific, two well-known industry giants, control a huge portion of the market due to their broad product portfolios and long-standing connections with healthcare facilities.
These businesses promote themselves as all-inclusive solution suppliers, providing complete track and trace services, including specimen gathering, processing, and diagnosis.
Recent Developments
Table 1: Global Market Value (US$ Million) Forecast by Region, 2019 to 2034
Table 2: Global Market Value (US$ Million) Forecast by Product, 2019 to 2034
Table 3: Global Market Value (US$ Million) Forecast by Technology, 2019 to 2034
Table 4: Global Market Value (US$ Million) Forecast by Application, 2019 to 2034
Table 5: Global Market Value (US$ Million) Forecast by End Users, 2019 to 2034
Table 6: North America Market Value (US$ Million) Forecast by Country, 2019 to 2034
Table 7: North America Market Value (US$ Million) Forecast by Product, 2019 to 2034
Table 8: North America Market Value (US$ Million) Forecast by Technology, 2019 to 2034
Table 9: North America Market Value (US$ Million) Forecast by Application, 2019 to 2034
Table 10: North America Market Value (US$ Million) Forecast by End Users, 2019 to 2034
Table 11: Latin America Market Value (US$ Million) Forecast by Country, 2019 to 2034
Table 12: Latin America Market Value (US$ Million) Forecast by Product, 2019 to 2034
Table 13: Latin America Market Value (US$ Million) Forecast by Technology, 2019 to 2034
Table 14: Latin America Market Value (US$ Million) Forecast by Application, 2019 to 2034
Table 15: Latin America Market Value (US$ Million) Forecast by End Users, 2019 to 2034
Table 16: Western Europe Market Value (US$ Million) Forecast by Country, 2019 to 2034
Table 17: Western Europe Market Value (US$ Million) Forecast by Product, 2019 to 2034
Table 18: Western Europe Market Value (US$ Million) Forecast by Technology, 2019 to 2034
Table 19: Western Europe Market Value (US$ Million) Forecast by Application, 2019 to 2034
Table 20: Western Europe Market Value (US$ Million) Forecast by End Users, 2019 to 2034
Table 21: Eastern Europe Market Value (US$ Million) Forecast by Country, 2019 to 2034
Table 22: Eastern Europe Market Value (US$ Million) Forecast by Product, 2019 to 2034
Table 23: Eastern Europe Market Value (US$ Million) Forecast by Technology, 2019 to 2034
Table 24: Eastern Europe Market Value (US$ Million) Forecast by Application, 2019 to 2034
Table 25: Eastern Europe Market Value (US$ Million) Forecast by End Users, 2019 to 2034
Table 26: South Asia and Pacific Market Value (US$ Million) Forecast by Country, 2019 to 2034
Table 27: South Asia and Pacific Market Value (US$ Million) Forecast by Product, 2019 to 2034
Table 28: South Asia and Pacific Market Value (US$ Million) Forecast by Technology, 2019 to 2034
Table 29: South Asia and Pacific Market Value (US$ Million) Forecast by Application, 2019 to 2034
Table 30: South Asia and Pacific Market Value (US$ Million) Forecast by End Users, 2019 to 2034
Table 31: East Asia Market Value (US$ Million) Forecast by Country, 2019 to 2034
Table 32: East Asia Market Value (US$ Million) Forecast by Product, 2019 to 2034
Table 33: East Asia Market Value (US$ Million) Forecast by Technology, 2019 to 2034
Table 34: East Asia Market Value (US$ Million) Forecast by Application, 2019 to 2034
Table 35: East Asia Market Value (US$ Million) Forecast by End Users, 2019 to 2034
Table 36: Middle East and Africa Market Value (US$ Million) Forecast by Country, 2019 to 2034
Table 37: Middle East and Africa Market Value (US$ Million) Forecast by Product, 2019 to 2034
Table 38: Middle East and Africa Market Value (US$ Million) Forecast by Technology, 2019 to 2034
Table 39: Middle East and Africa Market Value (US$ Million) Forecast by Application, 2019 to 2034
Table 40: Middle East and Africa Market Value (US$ Million) Forecast by End Users, 2019 to 2034
Figure 1: Global Market Value (US$ Million) by Product, 2024 to 2034
Figure 2: Global Market Value (US$ Million) by Technology, 2024 to 2034
Figure 3: Global Market Value (US$ Million) by Application, 2024 to 2034
Figure 4: Global Market Value (US$ Million) by End Users, 2024 to 2034
Figure 5: Global Market Value (US$ Million) by Region, 2024 to 2034
Figure 6: Global Market Value (US$ Million) Analysis by Region, 2019 to 2034
Figure 7: Global Market Value Share (%) and BPS Analysis by Region, 2024 to 2034
Figure 8: Global Market Y-o-Y Growth (%) Projections by Region, 2024 to 2034
Figure 9: Global Market Value (US$ Million) Analysis by Product, 2019 to 2034
Figure 10: Global Market Value Share (%) and BPS Analysis by Product, 2024 to 2034
Figure 11: Global Market Y-o-Y Growth (%) Projections by Product, 2024 to 2034
Figure 12: Global Market Value (US$ Million) Analysis by Technology, 2019 to 2034
Figure 13: Global Market Value Share (%) and BPS Analysis by Technology, 2024 to 2034
Figure 14: Global Market Y-o-Y Growth (%) Projections by Technology, 2024 to 2034
Figure 15: Global Market Value (US$ Million) Analysis by Application, 2019 to 2034
Figure 16: Global Market Value Share (%) and BPS Analysis by Application, 2024 to 2034
Figure 17: Global Market Y-o-Y Growth (%) Projections by Application, 2024 to 2034
Figure 18: Global Market Value (US$ Million) Analysis by End Users, 2019 to 2034
Figure 19: Global Market Value Share (%) and BPS Analysis by End Users, 2024 to 2034
Figure 20: Global Market Y-o-Y Growth (%) Projections by End Users, 2024 to 2034
Figure 21: Global Market Attractiveness by Product, 2024 to 2034
Figure 22: Global Market Attractiveness by Technology, 2024 to 2034
Figure 23: Global Market Attractiveness by Application, 2024 to 2034
Figure 24: Global Market Attractiveness by End Users, 2024 to 2034
Figure 25: Global Market Attractiveness by Region, 2024 to 2034
Figure 26: North America Market Value (US$ Million) by Product, 2024 to 2034
Figure 27: North America Market Value (US$ Million) by Technology, 2024 to 2034
Figure 28: North America Market Value (US$ Million) by Application, 2024 to 2034
Figure 29: North America Market Value (US$ Million) by End Users, 2024 to 2034
Figure 30: North America Market Value (US$ Million) by Country, 2024 to 2034
Figure 31: North America Market Value (US$ Million) Analysis by Country, 2019 to 2034
Figure 32: North America Market Value Share (%) and BPS Analysis by Country, 2024 to 2034
Figure 33: North America Market Y-o-Y Growth (%) Projections by Country, 2024 to 2034
Figure 34: North America Market Value (US$ Million) Analysis by Product, 2019 to 2034
Figure 35: North America Market Value Share (%) and BPS Analysis by Product, 2024 to 2034
Figure 36: North America Market Y-o-Y Growth (%) Projections by Product, 2024 to 2034
Figure 37: North America Market Value (US$ Million) Analysis by Technology, 2019 to 2034
Figure 38: North America Market Value Share (%) and BPS Analysis by Technology, 2024 to 2034
Figure 39: North America Market Y-o-Y Growth (%) Projections by Technology, 2024 to 2034
Figure 40: North America Market Value (US$ Million) Analysis by Application, 2019 to 2034
Figure 41: North America Market Value Share (%) and BPS Analysis by Application, 2024 to 2034
Figure 42: North America Market Y-o-Y Growth (%) Projections by Application, 2024 to 2034
Figure 43: North America Market Value (US$ Million) Analysis by End Users, 2019 to 2034
Figure 44: North America Market Value Share (%) and BPS Analysis by End Users, 2024 to 2034
Figure 45: North America Market Y-o-Y Growth (%) Projections by End Users, 2024 to 2034
Figure 46: North America Market Attractiveness by Product, 2024 to 2034
Figure 47: North America Market Attractiveness by Technology, 2024 to 2034
Figure 48: North America Market Attractiveness by Application, 2024 to 2034
Figure 49: North America Market Attractiveness by End Users, 2024 to 2034
Figure 50: North America Market Attractiveness by Country, 2024 to 2034
Figure 51: Latin America Market Value (US$ Million) by Product, 2024 to 2034
Figure 52: Latin America Market Value (US$ Million) by Technology, 2024 to 2034
Figure 53: Latin America Market Value (US$ Million) by Application, 2024 to 2034
Figure 54: Latin America Market Value (US$ Million) by End Users, 2024 to 2034
Figure 55: Latin America Market Value (US$ Million) by Country, 2024 to 2034
Figure 56: Latin America Market Value (US$ Million) Analysis by Country, 2019 to 2034
Figure 57: Latin America Market Value Share (%) and BPS Analysis by Country, 2024 to 2034
Figure 58: Latin America Market Y-o-Y Growth (%) Projections by Country, 2024 to 2034
Figure 59: Latin America Market Value (US$ Million) Analysis by Product, 2019 to 2034
Figure 60: Latin America Market Value Share (%) and BPS Analysis by Product, 2024 to 2034
Figure 61: Latin America Market Y-o-Y Growth (%) Projections by Product, 2024 to 2034
Figure 62: Latin America Market Value (US$ Million) Analysis by Technology, 2019 to 2034
Figure 63: Latin America Market Value Share (%) and BPS Analysis by Technology, 2024 to 2034
Figure 64: Latin America Market Y-o-Y Growth (%) Projections by Technology, 2024 to 2034
Figure 65: Latin America Market Value (US$ Million) Analysis by Application, 2019 to 2034
Figure 66: Latin America Market Value Share (%) and BPS Analysis by Application, 2024 to 2034
Figure 67: Latin America Market Y-o-Y Growth (%) Projections by Application, 2024 to 2034
Figure 68: Latin America Market Value (US$ Million) Analysis by End Users, 2019 to 2034
Figure 69: Latin America Market Value Share (%) and BPS Analysis by End Users, 2024 to 2034
Figure 70: Latin America Market Y-o-Y Growth (%) Projections by End Users, 2024 to 2034
Figure 71: Latin America Market Attractiveness by Product, 2024 to 2034
Figure 72: Latin America Market Attractiveness by Technology, 2024 to 2034
Figure 73: Latin America Market Attractiveness by Application, 2024 to 2034
Figure 74: Latin America Market Attractiveness by End Users, 2024 to 2034
Figure 75: Latin America Market Attractiveness by Country, 2024 to 2034
Figure 76: Western Europe Market Value (US$ Million) by Product, 2024 to 2034
Figure 77: Western Europe Market Value (US$ Million) by Technology, 2024 to 2034
Figure 78: Western Europe Market Value (US$ Million) by Application, 2024 to 2034
Figure 79: Western Europe Market Value (US$ Million) by End Users, 2024 to 2034
Figure 80: Western Europe Market Value (US$ Million) by Country, 2024 to 2034
Figure 81: Western Europe Market Value (US$ Million) Analysis by Country, 2019 to 2034
Figure 82: Western Europe Market Value Share (%) and BPS Analysis by Country, 2024 to 2034
Figure 83: Western Europe Market Y-o-Y Growth (%) Projections by Country, 2024 to 2034
Figure 84: Western Europe Market Value (US$ Million) Analysis by Product, 2019 to 2034
Figure 85: Western Europe Market Value Share (%) and BPS Analysis by Product, 2024 to 2034
Figure 86: Western Europe Market Y-o-Y Growth (%) Projections by Product, 2024 to 2034
Figure 87: Western Europe Market Value (US$ Million) Analysis by Technology, 2019 to 2034
Figure 88: Western Europe Market Value Share (%) and BPS Analysis by Technology, 2024 to 2034
Figure 89: Western Europe Market Y-o-Y Growth (%) Projections by Technology, 2024 to 2034
Figure 90: Western Europe Market Value (US$ Million) Analysis by Application, 2019 to 2034
Figure 91: Western Europe Market Value Share (%) and BPS Analysis by Application, 2024 to 2034
Figure 92: Western Europe Market Y-o-Y Growth (%) Projections by Application, 2024 to 2034
Figure 93: Western Europe Market Value (US$ Million) Analysis by End Users, 2019 to 2034
Figure 94: Western Europe Market Value Share (%) and BPS Analysis by End Users, 2024 to 2034
Figure 95: Western Europe Market Y-o-Y Growth (%) Projections by End Users, 2024 to 2034
Figure 96: Western Europe Market Attractiveness by Product, 2024 to 2034
Figure 97: Western Europe Market Attractiveness by Technology, 2024 to 2034
Figure 98: Western Europe Market Attractiveness by Application, 2024 to 2034
Figure 99: Western Europe Market Attractiveness by End Users, 2024 to 2034
Figure 100: Western Europe Market Attractiveness by Country, 2024 to 2034
Figure 101: Eastern Europe Market Value (US$ Million) by Product, 2024 to 2034
Figure 102: Eastern Europe Market Value (US$ Million) by Technology, 2024 to 2034
Figure 103: Eastern Europe Market Value (US$ Million) by Application, 2024 to 2034
Figure 104: Eastern Europe Market Value (US$ Million) by End Users, 2024 to 2034
Figure 105: Eastern Europe Market Value (US$ Million) by Country, 2024 to 2034
Figure 106: Eastern Europe Market Value (US$ Million) Analysis by Country, 2019 to 2034
Figure 107: Eastern Europe Market Value Share (%) and BPS Analysis by Country, 2024 to 2034
Figure 108: Eastern Europe Market Y-o-Y Growth (%) Projections by Country, 2024 to 2034
Figure 109: Eastern Europe Market Value (US$ Million) Analysis by Product, 2019 to 2034
Figure 110: Eastern Europe Market Value Share (%) and BPS Analysis by Product, 2024 to 2034
Figure 111: Eastern Europe Market Y-o-Y Growth (%) Projections by Product, 2024 to 2034
Figure 112: Eastern Europe Market Value (US$ Million) Analysis by Technology, 2019 to 2034
Figure 113: Eastern Europe Market Value Share (%) and BPS Analysis by Technology, 2024 to 2034
Figure 114: Eastern Europe Market Y-o-Y Growth (%) Projections by Technology, 2024 to 2034
Figure 115: Eastern Europe Market Value (US$ Million) Analysis by Application, 2019 to 2034
Figure 116: Eastern Europe Market Value Share (%) and BPS Analysis by Application, 2024 to 2034
Figure 117: Eastern Europe Market Y-o-Y Growth (%) Projections by Application, 2024 to 2034
Figure 118: Eastern Europe Market Value (US$ Million) Analysis by End Users, 2019 to 2034
Figure 119: Eastern Europe Market Value Share (%) and BPS Analysis by End Users, 2024 to 2034
Figure 120: Eastern Europe Market Y-o-Y Growth (%) Projections by End Users, 2024 to 2034
Figure 121: Eastern Europe Market Attractiveness by Product, 2024 to 2034
Figure 122: Eastern Europe Market Attractiveness by Technology, 2024 to 2034
Figure 123: Eastern Europe Market Attractiveness by Application, 2024 to 2034
Figure 124: Eastern Europe Market Attractiveness by End Users, 2024 to 2034
Figure 125: Eastern Europe Market Attractiveness by Country, 2024 to 2034
Figure 126: South Asia and Pacific Market Value (US$ Million) by Product, 2024 to 2034
Figure 127: South Asia and Pacific Market Value (US$ Million) by Technology, 2024 to 2034
Figure 128: South Asia and Pacific Market Value (US$ Million) by Application, 2024 to 2034
Figure 129: South Asia and Pacific Market Value (US$ Million) by End Users, 2024 to 2034
Figure 130: South Asia and Pacific Market Value (US$ Million) by Country, 2024 to 2034
Figure 131: South Asia and Pacific Market Value (US$ Million) Analysis by Country, 2019 to 2034
Figure 132: South Asia and Pacific Market Value Share (%) and BPS Analysis by Country, 2024 to 2034
Figure 133: South Asia and Pacific Market Y-o-Y Growth (%) Projections by Country, 2024 to 2034
Figure 134: South Asia and Pacific Market Value (US$ Million) Analysis by Product, 2019 to 2034
Figure 135: South Asia and Pacific Market Value Share (%) and BPS Analysis by Product, 2024 to 2034
Figure 136: South Asia and Pacific Market Y-o-Y Growth (%) Projections by Product, 2024 to 2034
Figure 137: South Asia and Pacific Market Value (US$ Million) Analysis by Technology, 2019 to 2034
Figure 138: South Asia and Pacific Market Value Share (%) and BPS Analysis by Technology, 2024 to 2034
Figure 139: South Asia and Pacific Market Y-o-Y Growth (%) Projections by Technology, 2024 to 2034
Figure 140: South Asia and Pacific Market Value (US$ Million) Analysis by Application, 2019 to 2034
Figure 141: South Asia and Pacific Market Value Share (%) and BPS Analysis by Application, 2024 to 2034
Figure 142: South Asia and Pacific Market Y-o-Y Growth (%) Projections by Application, 2024 to 2034
Figure 143: South Asia and Pacific Market Value (US$ Million) Analysis by End Users, 2019 to 2034
Figure 144: South Asia and Pacific Market Value Share (%) and BPS Analysis by End Users, 2024 to 2034
Figure 145: South Asia and Pacific Market Y-o-Y Growth (%) Projections by End Users, 2024 to 2034
Figure 146: South Asia and Pacific Market Attractiveness by Product, 2024 to 2034
Figure 147: South Asia and Pacific Market Attractiveness by Technology, 2024 to 2034
Figure 148: South Asia and Pacific Market Attractiveness by Application, 2024 to 2034
Figure 149: South Asia and Pacific Market Attractiveness by End Users, 2024 to 2034
Figure 150: South Asia and Pacific Market Attractiveness by Country, 2024 to 2034
Figure 151: East Asia Market Value (US$ Million) by Product, 2024 to 2034
Figure 152: East Asia Market Value (US$ Million) by Technology, 2024 to 2034
Figure 153: East Asia Market Value (US$ Million) by Application, 2024 to 2034
Figure 154: East Asia Market Value (US$ Million) by End Users, 2024 to 2034
Figure 155: East Asia Market Value (US$ Million) by Country, 2024 to 2034
Figure 156: East Asia Market Value (US$ Million) Analysis by Country, 2019 to 2034
Figure 157: East Asia Market Value Share (%) and BPS Analysis by Country, 2024 to 2034
Figure 158: East Asia Market Y-o-Y Growth (%) Projections by Country, 2024 to 2034
Figure 159: East Asia Market Value (US$ Million) Analysis by Product, 2019 to 2034
Figure 160: East Asia Market Value Share (%) and BPS Analysis by Product, 2024 to 2034
Figure 161: East Asia Market Y-o-Y Growth (%) Projections by Product, 2024 to 2034
Figure 162: East Asia Market Value (US$ Million) Analysis by Technology, 2019 to 2034
Figure 163: East Asia Market Value Share (%) and BPS Analysis by Technology, 2024 to 2034
Figure 164: East Asia Market Y-o-Y Growth (%) Projections by Technology, 2024 to 2034
Figure 165: East Asia Market Value (US$ Million) Analysis by Application, 2019 to 2034
Figure 166: East Asia Market Value Share (%) and BPS Analysis by Application, 2024 to 2034
Figure 167: East Asia Market Y-o-Y Growth (%) Projections by Application, 2024 to 2034
Figure 168: East Asia Market Value (US$ Million) Analysis by End Users, 2019 to 2034
Figure 169: East Asia Market Value Share (%) and BPS Analysis by End Users, 2024 to 2034
Figure 170: East Asia Market Y-o-Y Growth (%) Projections by End Users, 2024 to 2034
Figure 171: East Asia Market Attractiveness by Product, 2024 to 2034
Figure 172: East Asia Market Attractiveness by Technology, 2024 to 2034
Figure 173: East Asia Market Attractiveness by Application, 2024 to 2034
Figure 174: East Asia Market Attractiveness by End Users, 2024 to 2034
Figure 175: East Asia Market Attractiveness by Country, 2024 to 2034
Figure 176: Middle East and Africa Market Value (US$ Million) by Product, 2024 to 2034
Figure 177: Middle East and Africa Market Value (US$ Million) by Technology, 2024 to 2034
Figure 178: Middle East and Africa Market Value (US$ Million) by Application, 2024 to 2034
Figure 179: Middle East and Africa Market Value (US$ Million) by End Users, 2024 to 2034
Figure 180: Middle East and Africa Market Value (US$ Million) by Country, 2024 to 2034
Figure 181: Middle East and Africa Market Value (US$ Million) Analysis by Country, 2019 to 2034
Figure 182: Middle East and Africa Market Value Share (%) and BPS Analysis by Country, 2024 to 2034
Figure 183: Middle East and Africa Market Y-o-Y Growth (%) Projections by Country, 2024 to 2034
Figure 184: Middle East and Africa Market Value (US$ Million) Analysis by Product, 2019 to 2034
Figure 185: Middle East and Africa Market Value Share (%) and BPS Analysis by Product, 2024 to 2034
Figure 186: Middle East and Africa Market Y-o-Y Growth (%) Projections by Product, 2024 to 2034
Figure 187: Middle East and Africa Market Value (US$ Million) Analysis by Technology, 2019 to 2034
Figure 188: Middle East and Africa Market Value Share (%) and BPS Analysis by Technology, 2024 to 2034
Figure 189: Middle East and Africa Market Y-o-Y Growth (%) Projections by Technology, 2024 to 2034
Figure 190: Middle East and Africa Market Value (US$ Million) Analysis by Application, 2019 to 2034
Figure 191: Middle East and Africa Market Value Share (%) and BPS Analysis by Application, 2024 to 2034
Figure 192: Middle East and Africa Market Y-o-Y Growth (%) Projections by Application, 2024 to 2034
Figure 193: Middle East and Africa Market Value (US$ Million) Analysis by End Users, 2019 to 2034
Figure 194: Middle East and Africa Market Value Share (%) and BPS Analysis by End Users, 2024 to 2034
Figure 195: Middle East and Africa Market Y-o-Y Growth (%) Projections by End Users, 2024 to 2034
Figure 196: Middle East and Africa Market Attractiveness by Product, 2024 to 2034
Figure 197: Middle East and Africa Market Attractiveness by Technology, 2024 to 2034
Figure 198: Middle East and Africa Market Attractiveness by Application, 2024 to 2034
Figure 199: Middle East and Africa Market Attractiveness by End Users, 2024 to 2034
Figure 200: Middle East and Africa Market Attractiveness by Country, 2024 to 2034
The global anatomic pathology track and trace solution market is valued at USD 807.2 million in 2024.
The market size for anatomic pathology track and trace solutions is estimated to increase at an 11.5% CAGR through 2034.
The market is anticipated to be worth USD 2.4 billion by 2034.
Software witnesses high demand in the industry.
The market in South Korea is predicted to rise at a 13.6% CAGR through 2034.
Explore Similar Insights
Thank you!
You will receive an email from our Business Development Manager. Please be sure to check your SPAM/JUNK folder too.