The Quantitative Pathology Imaging Market is estimated to be valued at USD 3.9 billion in 2025 and is projected to reach USD 11.9 billion by 2035, registering a compound annual growth rate (CAGR) of 11.9% over the forecast period.
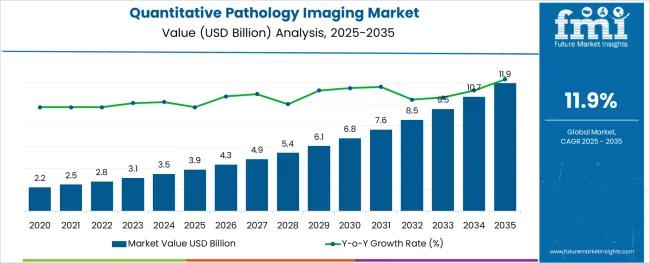
The quantitative pathology imaging market is experiencing accelerated adoption as precision medicine, oncology research, and digital pathology workflows converge. Increasing focus on biomarker validation, tissue-based diagnostics, and whole-slide imaging has driven demand for high-throughput, automated platforms capable of delivering objective and reproducible results.
Advancements in AI algorithms, combined with cloud-based data storage and image analytics, are enabling real-time interpretation and remote consultation across multi-center trials and clinical networks. As pathology departments modernize, the need for digitized image repositories, seamless laboratory information system integration, and regulatory-compliant data formats is growing.
Drug discovery workflows are also increasingly reliant on image-based quantification for evaluating therapeutic efficacy and identifying targetable disease pathways. The expansion of cancer screening programs, adoption of companion diagnostics, and rising investment in clinical informatics infrastructure are expected to shape future demand. Growth opportunities are expected to deepen across hospitals, pharmaceutical labs, and research institutes as digitization, automation, and AI integration continue to transform traditional pathology workflows.
The market is segmented by Product, Application, and End-User and region. By Product, the market is divided into Instruments, Software, and Services. In terms of Application, the market is classified into Drug Discovery and Development, Academic Research, and Disease Diagnosis. Based on End-User, the market is segmented into Hospitals, Clinics, Pathology Diagnostic Laboratories, and Research Institutes. Regionally, the market is classified into North America, Latin America, Western Europe, Eastern Europe, Balkan & Baltic Countries, Russia & Belarus, Central Asia, East Asia, South Asia & Pacific, and the Middle East & Africa.
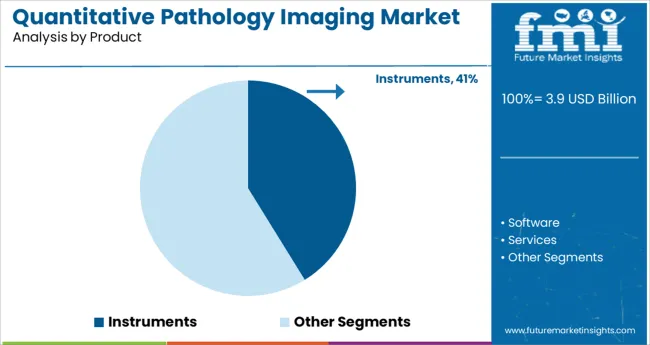
In the product category, instruments are expected to command 41.2% of total market revenue in 2025, making it the leading segment. This leadership is attributed to the widespread deployment of high-resolution scanners, multiplexing platforms, and slide imaging systems in both research and clinical settings.
The demand for rapid, reproducible tissue imaging with minimal manual intervention has positioned instruments as critical components in digital pathology ecosystems. Integration with laboratory automation systems, robotic sample handling, and compatibility with AI-based image analysis software has further reinforced instrument value across laboratories seeking scalable and efficient diagnostic workflows.
Additionally, the growing need for whole-slide imaging in oncology, infectious disease, and biomarker research has driven procurement across hospitals and academic research centers, securing instruments as the primary revenue contributor within the product landscape.
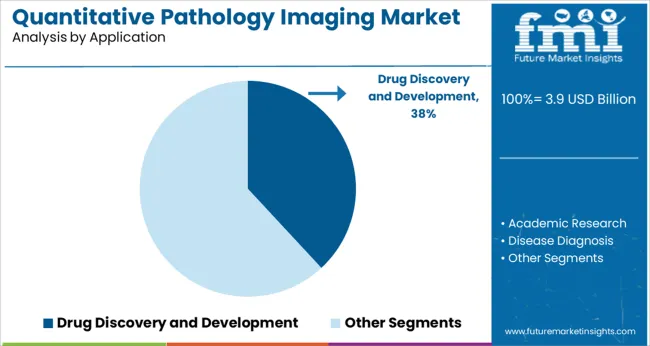
Drug discovery and development is anticipated to hold a 38.1% share of total revenue in the application segment by 2025, positioning it as the dominant application. This position is being driven by the need for high-throughput imaging tools that enable quantitative evaluation of drug-tissue interactions, biomarker expression, and cellular morphology. Imaging platforms integrated into preclinical and translational research workflows have become essential for accelerating compound screening, toxicity assessments, and pharmacodynamic studies.
As precision oncology and immunotherapy research advance, the use of digital pathology tools in validating therapeutic targets and monitoring treatment response is expanding.
Pharmaceutical companies and contract research organizations are investing in image-enabled decision-making tools that reduce development timelines and improve predictive accuracy, reinforcing the leadership of this application in the quantitative pathology imaging market.
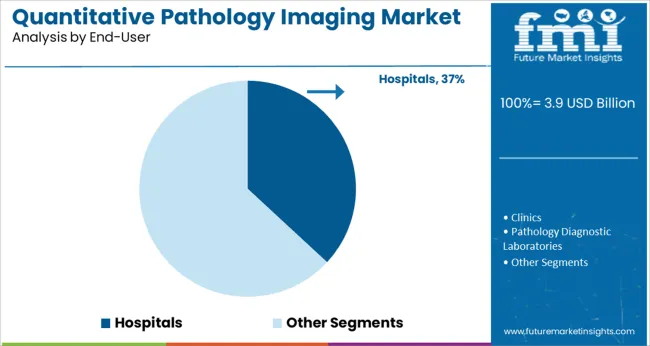
Hospitals are projected to account for 36.9% of total revenue in 2025 within the end user category, marking them as the leading contributors. This dominance is driven by the growing implementation of digital pathology platforms for routine diagnostics, cancer screening, and intraoperative consultations.
With the increasing volume of complex pathology cases and a global shortage of pathologists, hospitals are adopting quantitative imaging solutions to enhance diagnostic throughput and accuracy. Integration with electronic medical records and laboratory information systems is facilitating seamless reporting and image sharing across departments.
Hospitals are also leveraging AI-supported image analytics for second reads and triaging, reducing turnaround time and minimizing diagnostic variability. Additionally, the push toward value-based healthcare and remote pathology services has spurred investments in imaging infrastructure, positioning hospitals as the central hub for pathology innovation and digital transformation.
It is anticipated that the quantitative pathology imaging market is gaining momentum as a proven essential technology. The major factor driving the growth of the quantitative pathology imaging market is the specific support it is providing to education, drug development, tissue-based research, and the practice of human pathology throughout the world.
It is identified that there is an increasing need for enhancing lab efficiency and this factor is expected to drive the growth of the quantitative pathology imaging market.
It is a cutting-edge technology that is aiming towards lower laboratory costs, boosting production, increase operational efficiency, improving treatment decisions, and care for patients. These factors are bolstering the adoption of quantitative pathology imaging and serve as an influential factor in the market growth of quantitative pathology imaging systems.
Quantitative pathology imaging systems offer better visualization, reduced errors, reduced turnaround time, and improved workflow, which is further fueling the demand for quantitative pathology imaging systems in the global market. These systems have the multiplexing capacity, to detect and measure multiple weakly expressed overlapping biomarkers, along with the inclusion of an integrated inform analysis software that automatically identifies specific types of tissues using patented user-trainable algorithms developed for recognizing morphological patterns.
Clinical labs are using quantitative pathology imaging systems for remote consultations, quantitative analysis, and education. Furthermore, rising incidences of various types of cancer along with new lifestyle patterns, coupled with a growing geriatric and matured population energizes the overall growth of the quantitative pathology imaging market.
The facilitation of the right tumor microenvironment and accurate valuation of visualization characteristics of immune tumor cells are likely to drive the commercial demand for quantitative pathology imaging systems and contribute to the steady growth of the quantitative pathology imaging market.
Although there are a number of growth factors that are driving the robust expansion of the global quantitative pathology imaging market, it is also identified that some factors are likely to curb the growth of the quantitative pathology imaging market.
It is observed that the truncated approachability of the quantitative pathology imaging systems is not getting full-scale acceptance among healthcare specialists and is acting as a major restraining factor for the quantitative pathology imaging systems market growth.
There is a lack of availability of quantitative pathology imaging in the international market. The newly launched quantitative pathology imaging systems are considered an innovative technology for which reimbursements are not available, which can act as a restraint and hinder the growth of the global quantitative pathology imaging market.
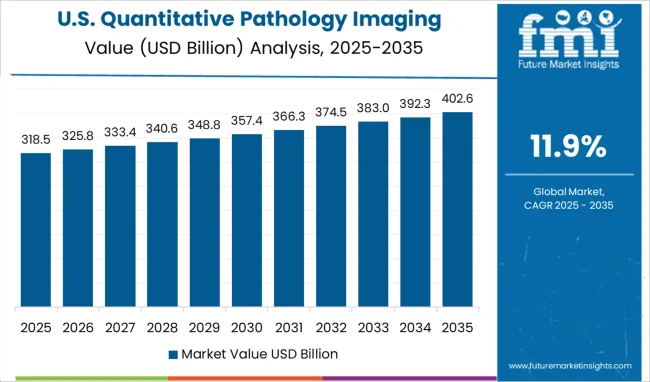
It is projected that North America is likely to dominate the market share for quantitative pathology imaging systems. Currently, the North American region is cumulatively accountable for 41.6% of the total market share of quantitative pathology imaging.
Owing to the development and steady growth of preventive measures in these regions, the organizations of North America are concentrating on the natural laws to control the new medical devices launched. The growth can be attributed to the rising penetration of digital imaging in the huge economy of North America.
There are multiple research and development endeavors taken up on enhancing the framework and putting the resources into clinical examinations which are driving the acceptance and adoption of quantitative pathology imaging systems in North America as well.
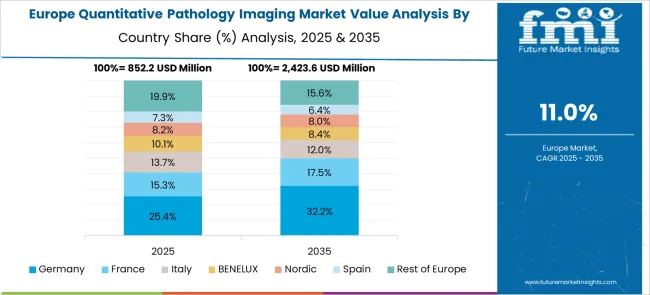
At present, Europe is accountable for 24.8% of the total quantitative pathology imaging market.
Europe is projected to follow North America and is likely to have steady growth in the quantitative pathology imaging market during the forecast period. A major driver in the European region is the rise of the geriatric population and increasing chronic diseases that are expected to further propel the quantitative pathology imaging market.
There is an increasing demand for pathologists and clinicians to diagnose rising cancer cases and the development of the healthcare sector is stimulating the demand for quantitative pathology imaging systems and expanding the market size of quantitative pathology imaging systems in this region.
How are New Entrants Revolutionizing the Quantitative Pathology Imaging Market?
The start-up ecosystem in the quantitative pathology imaging market is intense with frequent innovations being made. Start-ups in the quantitative pathology imaging market are focusing on multiple additional features for further bolstering the adoption of this product on a large scale. They are making efforts to provide services that enable physicians and consumers to detect the presence of a disease or condition, segmented according to the technology used for diagnosis.
Diagnostics Tech is one of the most active sectors for investors, with overall funding of USD 99.7 Billion in 2.7K+ companies. It is also interesting to note that more than half of the funding has been raised in the last 3 years. Some of the start-ups are Spring, EchoNous, Eko, and others.
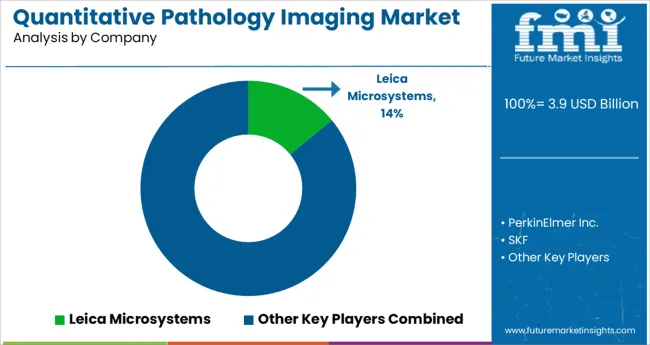
Who are some of the Key Market Players in the Quantitative Pathology Imaging Market?
The key participants in the quantitative pathology imaging system market are Leica Microsystems, PerkinElmer Inc., and Diagnostic Instruments, Inc.
The organizations are essentially concentrating on the solid line of distribution channels and advertising to increase the expansion of quantitative pathology imaging systems in the international market. The major players are enhancing the features such as seeing from different angles and zooming in and out for better facilitation and use of the quantitative pathology imaging systems in the global market by consumers.
| Report Attribute | Details |
|---|---|
| Growth Rate | CAGR of 11.9% from 2025 to 2035 |
| Base Year for Estimation | 2024 |
| Historical Data | 2020 to 2024 |
| Forecast Period | 2025 to 2035 |
| Quantitative Units | Revenue in USD Million and CAGR from 2025 to 2035 |
| Report Coverage | Revenue Forecast, Volume Forecast, Company Ranking, Competitive Landscape, Growth Factors, Trends, and Pricing Analysis |
| Segments Covered | Product Type, Application, End-User, Region |
| Regions Covered | North America; Latin America; Europe; East Asia; South Asia; Oceania; Middle East and Africa |
| Key Countries Profiled | United States of America, Canada, Brazil, Argentina, Germany, United Kingdom, France, Spain, Italy, Nordics, BENELUX, Australia & New Zealand, China, India, ASIAN, GCC Countries, South Africa |
| Key Companies Profiled | Leica Biosystems (Danaher); Hamamatsu Photonics, Inc.; Koninklijke Philips N.V.; Olympus Corporation; F. Hoffmann-La Roche Ltd.; Mikroscan Technologies; Inspirata, Inc.; 3DHISTECH Ltd.; Visiopharm A/S; Huron Technologies International, Inc.; ContextVision AB |
| Customization | Available Upon Request |
The global quantitative pathology imaging market is estimated to be valued at USD 3.9 billion in 2025.
It is projected to reach USD 11.9 billion by 2035.
The market is expected to grow at a 11.9% CAGR between 2025 and 2035.
The key product types are instruments, software and services.
drug discovery and development segment is expected to dominate with a 38.1% industry share in 2025.


Our Research Products

The "Full Research Suite" delivers actionable market intel, deep dives on markets or technologies, so clients act faster, cut risk, and unlock growth.

The Leaderboard benchmarks and ranks top vendors, classifying them as Established Leaders, Leading Challengers, or Disruptors & Challengers.

Locates where complements amplify value and substitutes erode it, forecasting net impact by horizon

We deliver granular, decision-grade intel: market sizing, 5-year forecasts, pricing, adoption, usage, revenue, and operational KPIs—plus competitor tracking, regulation, and value chains—across 60 countries broadly.

Spot the shifts before they hit your P&L. We track inflection points, adoption curves, pricing moves, and ecosystem plays to show where demand is heading, why it is changing, and what to do next across high-growth markets and disruptive tech

Real-time reads of user behavior. We track shifting priorities, perceptions of today’s and next-gen services, and provider experience, then pace how fast tech moves from trial to adoption, blending buyer, consumer, and channel inputs with social signals (#WhySwitch, #UX).

Partner with our analyst team to build a custom report designed around your business priorities. From analysing market trends to assessing competitors or crafting bespoke datasets, we tailor insights to your needs.
Supplier Intelligence
Discovery & Profiling
Capacity & Footprint
Performance & Risk
Compliance & Governance
Commercial Readiness
Who Supplies Whom
Scorecards & Shortlists
Playbooks & Docs
Category Intelligence
Definition & Scope
Demand & Use Cases
Cost Drivers
Market Structure
Supply Chain Map
Trade & Policy
Operating Norms
Deliverables
Buyer Intelligence
Account Basics
Spend & Scope
Procurement Model
Vendor Requirements
Terms & Policies
Entry Strategy
Pain Points & Triggers
Outputs
Pricing Analysis
Benchmarks
Trends
Should-Cost
Indexation
Landed Cost
Commercial Terms
Deliverables
Brand Analysis
Positioning & Value Prop
Share & Presence
Customer Evidence
Go-to-Market
Digital & Reputation
Compliance & Trust
KPIs & Gaps
Outputs
Full Research Suite comprises of:
Market outlook & trends analysis
Interviews & case studies
Strategic recommendations
Vendor profiles & capabilities analysis
5-year forecasts
8 regions and 60+ country-level data splits
Market segment data splits
12 months of continuous data updates
DELIVERED AS:
PDF EXCEL ONLINE
Quantitative Casting Furnace Market Size and Share Forecast Outlook 2025 to 2035
MRI-based Quantitative Biomarkers Market Analysis - Size, Share, and Forecast Outlook 2025 to 2035
Pathology Devices Market Size and Share Forecast Outlook 2025 to 2035
Pathology Imaging Systems Market Size and Share Forecast Outlook 2025 to 2035
Digital Pathology Displays Market Size and Share Forecast Outlook 2025 to 2035
Digital Pathology Market Analysis - Size, Share, and Forecast Outlook 2025 to 2035
Anatomic Pathology Track and Trace Solution Market Size and Share Forecast Outlook 2025 to 2035
Anatomic Pathology Market Size and Share Forecast Outlook 2025 to 2035
Cellular Pathology Market Analysis – Size, Share & Forecast 2025 to 2035
Digital Telepathology Market is segmented by Application and End User from 2025 to 2035
Veterinary Digital Pathology Market Size and Share Forecast Outlook 2025 to 2035
Imaging Markers Market Analysis - Size, Share, and Forecast Outlook 2025 to 2035
3D Imaging Surgical Solution Market Size and Share Forecast Outlook 2025 to 2035
Gel Imaging Documentation Market Size and Share Forecast Outlook 2025 to 2035
PET Imaging Workflow Market Analysis - Size, Share, and Forecast Outlook 2025 to 2035
Brain Imaging and Neuroimaging Market Size and Share Forecast Outlook 2025 to 2035
Dental Imaging Equipment Market Forecast and Outlook 2025 to 2035
Remote Imaging Collaboration Market Analysis - Size, Share, and Forecast Outlook 2025 to 2035
Competitive Overview of Aerial Imaging Market Share
Aerial Imaging Market Growth - Trends & Forecast 2025 to 2035

Thank you!
You will receive an email from our Business Development Manager. Please be sure to check your SPAM/JUNK folder too.
Chat With
MaRIA