Smart Home Solutions Market
Market Insights on Smart Home Solutions covering sales outlook, demand forecast & up-to-date key trends
Smart Home Solutions Market by Product, Software & Services, Sales Channel & Region | Forecast 2022 to 2032
Smart Home Solutions Market Outlook (2022 to 2032)
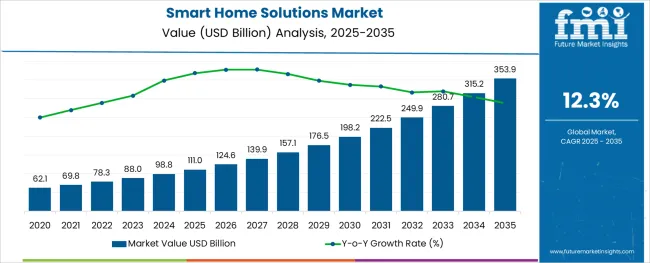
The global smart home solutions market is likely to be valued at US$ 78,342.6 Million in 2022 and is predicted to secure a rapid-paced CAGR of 12.3% during the forecast period. The market is expected to grow at a value of US$ 2,50,456.9 Million by 2032.
The adoption and demand of smart home solutions are on the rise as they are anticipated to be favorable home automation techniques that are triggered by computing devices and information technology, connecting various gadgets and instruments in the house, which respond to the needs of the occupants.
Report Attribute |
Details |
Smart Home Solutions Market Value (2022) |
US$ 78,342.6 Million |
Smart Home Solutions Market Anticipated Value (2032) |
US$ 2,50,456.9 Million |
Smart Home Solutions Projected Growth Rate (2022 to 2032) |
12.3% |
Energy-saving-oriented solutions are taking over the market, owing to the rising disposable income of consumers in developing economies, the increasing importance of home monitoring in remote areas, low carbon emissions solutions, and a growing number of internet users who are likely to expand the market for smart home solutions.
Therefore, it is anticipated that the smart home solutions market is likely to witness significant growth during the forecast period.
Don't pay for what you don't need
Customize your report by selecting specific countries or regions and save 30%!
Key Driving Factors in the Smart Home Solutions Market
The advanced security features are the prime reasons that are driving the market growth for smart home solutions. Its implementation of security features like gas leakage detectors, fire detection systems in the house, and more are driving people towards further adoption of smart home solutions.
They perform basic functions like turning off the lights, dimming lights, and other complex functions like automatically lighting up the exit route in the event of a fire alarm, and more, which is propelling the demand for smart home solutions globally.
It is witnessed that connectivity has emerged as a high-end novelty across a wide range of home devices that include security cameras, thermostats, and utility meters. It is expected that in the coming years connectivity is likely to become a more pervasive trend to the extent of being an embedded standard in every household device and equipment virtually.
The sales of smart home solutions are rapidly increasing probing to the easy and convenient remote access of every device from other locations. One can keep a watch on the activities that are going around within the house through video surveillance systems.
The use of data analytics software and solutions with home automation systems helps the owners determine the electrical equipment in the home is operating efficiently and achieving the targeted usage goals. This helps in the identification of the areas that require improvement and energy efficiency upgrades.
It is also anticipated that the integration of power line communication technology in smart homes is likely to add a positive contribution to the expansion of the smart home solutions market globally.
Factors Deterring the Market Growth of Smart Home Solutions
It is identified that there are some factors that are likely to curb the growth of the smart home solutions market in the upcoming years. The cost of smart home solutions is high compared to the existing devices.
Consumers are most likely to choose products that offer convenience and energy efficiency. The shipment usually depends on the utilization and requirements of homeowners and the smart home devices involve other upfront costs like installation charges and maintenance costs. These costs limit the adoption and acceptance of smart home solutions by customers, as well as many other organizations, and are projected to curb the growth of the smart home solutions market during the forecast period.
Find your sweet spots for generating winning opportunities in this market.
Talk to AnalystRegional Analysis
How is the North America Smart Home Solutions Market getting influenced?
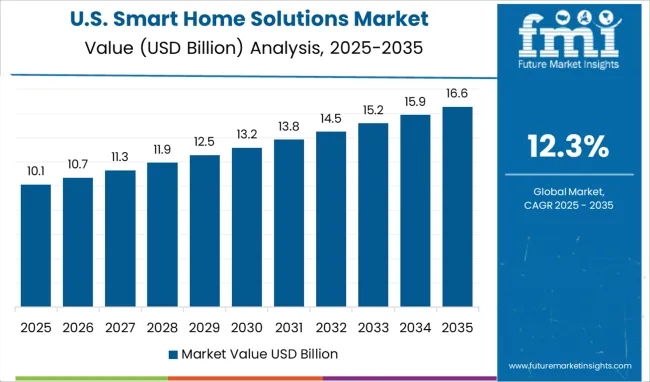
It is projected that North America is going to dominate the global smart home solutions market during the forecast period. Currently, the North American region is cumulatively accountable for 42.3% of the total market share for smart home solutions.
Owing to the increased awareness about the concept of home automation, the populace of North America is highly spending on the adoption of smart home devices. There is an increased number of working individuals in a house, and the families of the North American regions are financially capable of using these solutions at home and are driving the smart home solutions market size in North America.
What is the Growth Outlook for the Europe Smart Home Solutions Market?
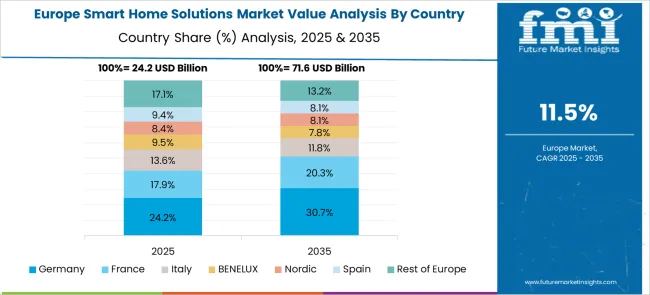
Europe is anticipated to acquire a significant share of the smart home solutions market in the upcoming years. Due to its broad range of products and the advancement of technology in this region, the market size is substantially increasing.
At present, Europe is accountable for 20.4% of the tot market share of smart home solutions. This growth is also backed by the presence of some of the prominent market players in the European regions, coupled with initiatives like the alignment of core communication technologies with residential facilities to maximize benefits.
Start-up Ecosystem
How are the Start-up Companies Revolutionizing the Smart Home Solutions Market?
There are rigorous innovations made to the smart home solutions market by emerging companies. They are cooperating with other well-known organizations to create and deploy unique smart home solutions. They are focusing on building cutting-edge technology that allows them to operate with minimal consumption of energy and in an efficient manner.
For instance, in January 2020, Vivint Smart Home, Inc. and Mosaic Acquisition Corp. announced a merger, with the aim of the merger to make the organization a public-traded company along with enhancing smart home platform offerings.
Some of the other start-up companies gaining momentum in the smart home solutions market are Latch, House, SimpliSafe, Sense, Wyze Labs, Pro.com, Openpath, Nanoleaf, Notion, Ring, Endel, and more.
Get the data you need at a Fraction of the cost
Personalize your report by choosing insights you need
and save 40%!
Competitive Landscape
What is Trending amongst the Key Market Players in the Smart Home Solutions Market?
Recent Development
The key start-up companies are seeking solutions that make the end user’s life more comfortable, and meaningful and provide a higher quality of life. They are getting indulged in mergers and acquisitions for further development of smart home solutions.
For Instance, In August 2021, Schneider Electric and Livspace, a home interiors and renovation platform announced a partnership. The partnership aims to create a smarter house for the future. The alliance is going to use Schneider Electric’s superior home automation technology and Livspace’s interior design experience to revolutionize the Indian home interior market. This experience is likely to include a wise home automation solution.
In the same month, August 2021, SmartRet.com, LLC, a provider of smart home and smart building automation, announced a merger with Fifth Wall Acquisition Corp. This was aimed at expanding the company and going public.
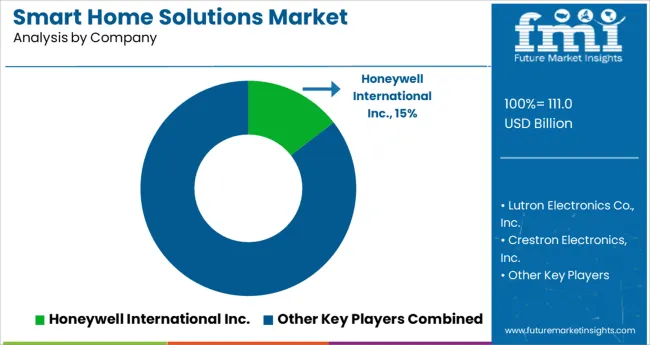
The key market players in the smart home solutions market include
- Honeywell
- Siemens
- Johnson Controls
- Schneider Electric
- ASSA ABLOY
- Amazon
- Apple
- ADT
- ABB
- Robert Bosch
- Sony
- Samsung Electronics
- Ooma
- Delta Controls
- Control4
- Axis Communications
- Comcast
- Smarthome
- Crestron Electronics
- SimpliSafe
- Armorax
- Canary
- LG Electronics
- Lutron
- Legrand
Report Scope
Report Attribute |
Details |
Growth Rate |
CAGR of 12.3% from 2022 to 2032 |
Base Year for Estimation |
2021 |
Historical Data |
2014 to 2020 |
Forecast Period |
2022 to 2032 |
Quantitative Units |
Revenue in US$ million and CAGR from 2022 to 2032 |
Report Coverage |
Revenue Forecast, Volume Forecast, Company Ranking, Competitive Landscape, Growth Factors, Trends, and Pricing Analysis |
Segments Covered |
|
Regions Covered |
|
Key Countries Profiled |
|
Key Companies Profiled |
|
Customization |
Available Upon Request |
Key Segments in the Smart Home Solutions Market
By Product:
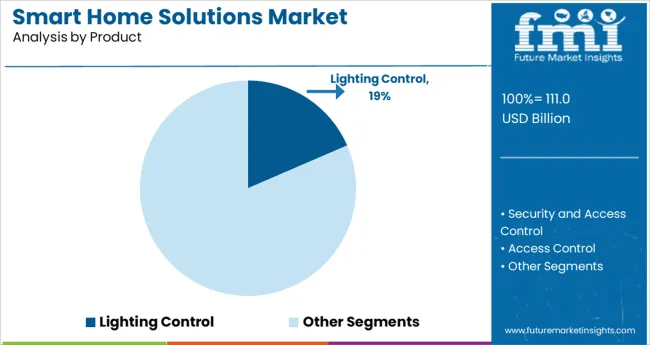
- Lighting Control
- Security and Access Control
- Access Control
- HVAC Control
- Entertainment
- Smart Speaker
- Home Healthcare
- Others
By Software & Services:
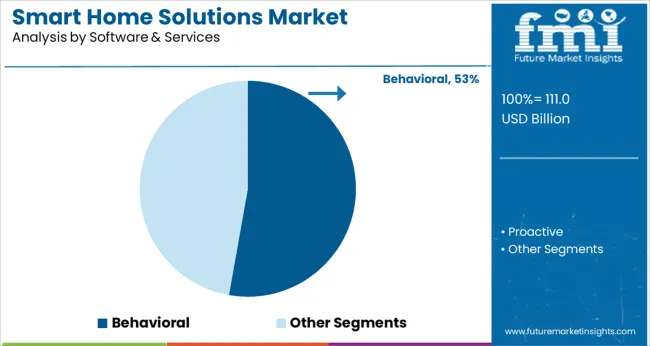
- Behavioral
- Proactive
By Sales Channel:
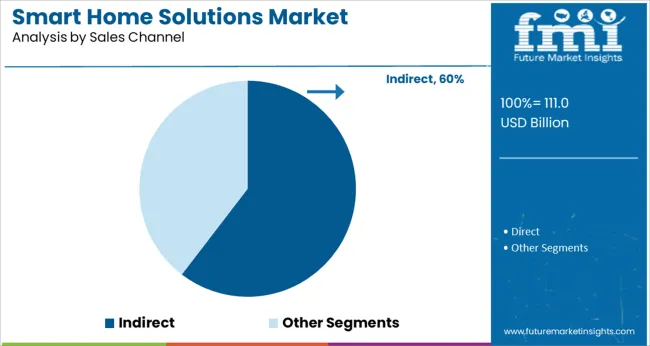
- Direct
- Indirect
By Region:
- North America
- Latin America
- Asia Pacific
- Middle East and Africa (MEA)
- Europe
Frequently Asked Questions
What is the Growth Outlook for the Smart Home Solutions Market?
The growth outlook for the smart home solutions meter market is predicted to advance at a CAGR of 10.0% from 2022 to 2032.
Which Region Leads the Smart Home Solutions Market?
The North American region is anticipated to lead the smart home solutions market during the forecast period.
How much Growth Potential does Smart Home Solutions hold?
The smart home solutions market is likely to hold a valuation of US$ 54,254.7 Million by 2032.
Which sector is the key driver in the Smart Home Solutions Market?
The residential sector is the key driver in the smart home solutions market.
Table of Content
1. Executive Summary | Smart Home Solutions Market 1.1. Global Market Outlook 1.2. Demand-side Trends 1.3. Supply-side Trends 1.4. Technology Roadmap Analysis 1.5. Analysis and Recommendations 2. Market Overview 2.1. Market Coverage / Taxonomy 2.2. Market Definition / Scope / Limitations 3. Market Background 3.1. Market Dynamics 3.1.1. Drivers 3.1.2. Restraints 3.1.3. Opportunity 3.1.4. Trends 3.2. Scenario Forecast 3.2.1. Demand in Optimistic Scenario 3.2.2. Demand in Likely Scenario 3.2.3. Demand in Conservative Scenario 3.3. Opportunity Map Analysis 3.4. Product Life Cycle Analysis 3.5. Supply Chain Analysis 3.5.1. Supply Side Participants and Their Roles 3.5.1.1. Producers 3.5.1.2. Mid-Level Participants (Traders/ Agents/ Brokers) 3.5.1.3. Wholesalers and Distributors 3.5.2. Value Added and Value Created at Node in the Supply Chain 3.5.3. List of Raw Material Suppliers 3.5.4. List of Existing and Potential Buyers 3.6. Investment Feasibility Matrix 3.7. Value Chain Analysis 3.7.1. Profit Margin Analysis 3.7.2. Wholesalers and Distributors 3.7.3. Retailers 3.8. PESTLE and Porter’s Analysis 3.9. Regulatory Landscape 3.9.1. By Key Regions 3.9.2. By Key Countries 3.10. Regional Parent Market Outlook 3.11. Production and Consumption Statistics 3.12. Import and Export Statistics 4. Global Market Analysis 2017 to 2021 and Forecast, 2022 to 2032 4.1. Historical Market Size Value (US$ Million) & Volume (Units) Analysis, 2017 to 2021 4.2. Current and Future Market Size Value (US$ Million) & Volume (Units) Projections, 2022 to 2032 4.2.1. Y-o-Y Growth Trend Analysis 4.2.2. Absolute Opportunity Analysis 5. Global Market Analysis 2017 to 2021 and Forecast 2022 to 2032, By Application 5.1. Introduction / Key Findings 5.2. Historical Market Size Value (US$ Million) & Volume (Units) Analysis By Application, 2017 to 2021 5.3. Current and Future Market Size Value (US$ Million) & Volume (Units) Analysis and Forecast By Application, 2022 to 2032 5.3.1. Safety And Security Systems 5.3.2. Energy Management Systems 5.3.3. lighting Control Systems 5.3.4. Climate Control Systems 5.3.5. Home Entertainment Control Systems 5.4. Y-o-Y Growth Trend Analysis By Application, 2017 to 2021 5.5. Absolute Opportunity Analysis By Application, 2022 to 2032 6. Global Market Analysis 2017 to 2021 and Forecast 2022 to 2032, By End-User 6.1. Introduction / Key Findings 6.2. Historical Market Size Value (US$ Million) & Volume (Units) Analysis By End-User, 2017 to 2021 6.3. Current and Future Market Size Value (US$ Million) & Volume (Units) Analysis and Forecast By End-User, 2022 to 2032 6.3.1. Residential Users 6.3.2. Commercial Users 6.3.3. Government Organizations 6.4. Y-o-Y Growth Trend Analysis By End-User, 2017 to 2021 6.5. Absolute Opportunity Analysis By End-User, 2022 to 2032 7. Global Market Analysis 2017 to 2021 and Forecast 2022 to 2032, By Technology 7.1. Introduction / Key Findings 7.2. Historical Market Size Value (US$ Million) & Volume (Units) Analysis By Technology, 2017 to 2021 7.3. Current and Future Market Size Value (US$ Million) & Volume (Units) Analysis and Forecast By Technology, 2022 to 2032 7.3.1. Network Technologies 7.3.2. Wireless Technologies 7.3.3. Communication Protocols 7.4. Y-o-Y Growth Trend Analysis By Technology, 2017 to 2021 7.5. Absolute Opportunity Analysis By Technology, 2022 to 2032 8. Global Market Analysis 2017 to 2021 and Forecast 2022 to 2032, By Region 8.1. Introduction 8.2. Historical Market Size Value (US$ Million) & Volume (Units) Analysis By Region, 2017 to 2021 8.3. Current Market Size Value (US$ Million) & Volume (Units) Analysis and Forecast By Region, 2022 to 2032 8.3.1. North America 8.3.2. Latin America 8.3.3. Europe 8.3.4. Asia Pacific 8.3.5. Middle East and Africa 8.4. Market Attractiveness Analysis By Region 9. North America Market Analysis 2017 to 2021 and Forecast 2022 to 2032, By Country 9.1. Historical Market Size Value (US$ Million) & Volume (Units) Trend Analysis By Market Taxonomy, 2017 to 2021 9.2. Market Size Value (US$ Million) & Volume (Units) Forecast By Market Taxonomy, 2022 to 2032 9.2.1. By Country 9.2.1.1. United States of America 9.2.1.2. Canada 9.2.2. By Application 9.2.3. By End-User 9.2.4. By Technology 9.3. Market Attractiveness Analysis 9.3.1. By Country 9.3.2. By Application 9.3.3. By End-User 9.3.4. By Technology 9.4. Key Takeaways 10. Latin America Market Analysis 2017 to 2021 and Forecast 2022 to 2032, By Country 10.1. Historical Market Size Value (US$ Million) & Volume (Units) Trend Analysis By Market Taxonomy, 2017 to 2021 10.2. Market Size Value (US$ Million) & Volume (Units) Forecast By Market Taxonomy, 2022 to 2032 10.2.1. By Country 10.2.1.1. Brazil 10.2.1.2. Mexico 10.2.1.3. Rest of Latin America 10.2.2. By Application 10.2.3. By End-User 10.2.4. By Technology 10.3. Market Attractiveness Analysis 10.3.1. By Country 10.3.2. By Application 10.3.3. By End-User 10.3.4. By Technology 10.4. Key Takeaways 11. Europe Market Analysis 2017 to 2021 and Forecast 2022 to 2032, By Country 11.1. Historical Market Size Value (US$ Million) & Volume (Units) Trend Analysis By Market Taxonomy, 2017 to 2021 11.2. Market Size Value (US$ Million) & Volume (Units) Forecast By Market Taxonomy, 2022 to 2032 11.2.1. By Country 11.2.1.1. Germany 11.2.1.2. United Kingdom 11.2.1.3. France 11.2.1.4. Spain 11.2.1.5. Italy 11.2.1.6. Rest of Europe 11.2.2. By Application 11.2.3. By End-User 11.2.4. By Technology 11.3. Market Attractiveness Analysis 11.3.1. By Country 11.3.2. By Application 11.3.3. By End-User 11.3.4. By Technology 11.4. Key Takeaways 12. Asia Pacific Market Analysis 2017 to 2021 and Forecast 2022 to 2032, By Country 12.1. Historical Market Size Value (US$ Million) & Volume (Units) Trend Analysis By Market Taxonomy, 2017 to 2021 12.2. Market Size Value (US$ Million) & Volume (Units) Forecast By Market Taxonomy, 2022 to 2032 12.2.1. By Country 12.2.1.1. China 12.2.1.2. Japan 12.2.1.3. South Korea 12.2.1.4. Malaysia 12.2.1.5. Singapore 12.2.1.6. Australia 12.2.1.7. New Zealand 12.2.1.8. Rest of Asia-Pacific (APAC) 12.2.2. By Application 12.2.3. By End-User 12.2.4. By Technology 12.3. Market Attractiveness Analysis 12.3.1. By Country 12.3.2. By Application 12.3.3. By End-User 12.3.4. By Technology 12.4. Key Takeaways 13. Middle East and Africa Market Analysis 2017 to 2021 and Forecast 2022 to 2032, By Country 13.1. Historical Market Size Value (US$ Million) & Volume (Units) Trend Analysis By Market Taxonomy, 2017 to 2021 13.2. Market Size Value (US$ Million) & Volume (Units) Forecast By Market Taxonomy, 2022 to 2032 13.2.1. By Country 13.2.1.1. GCC Countries 13.2.1.2. South Africa 13.2.1.3. Israel 13.2.1.4. Rest of Middle East and Africa 13.2.2. By Application 13.2.3. By End-User 13.2.4. By Technology 13.3. Market Attractiveness Analysis 13.3.1. By Country 13.3.2. By Application 13.3.3. By End-User 13.3.4. By Technology 13.4. Key Takeaways 14. Key Countries Market Analysis 14.1. United States of America 14.1.1. Pricing Analysis 14.1.2. Market Share Analysis, 2021 14.1.2.1. By Application 14.1.2.2. By End-User 14.1.2.3. By Technology 14.2. Canada 14.2.1. Pricing Analysis 14.2.2. Market Share Analysis, 2021 14.2.2.1. By Application 14.2.2.2. By End-User 14.2.2.3. By Technology 14.3. Brazil 14.3.1. Pricing Analysis 14.3.2. Market Share Analysis, 2021 14.3.2.1. By Application 14.3.2.2. By End-User 14.3.2.3. By Technology 14.4. Mexico 14.4.1. Pricing Analysis 14.4.2. Market Share Analysis, 2021 14.4.2.1. By Application 14.4.2.2. By End-User 14.4.2.3. By Technology 14.5. Germany 14.5.1. Pricing Analysis 14.5.2. Market Share Analysis, 2021 14.5.2.1. By Application 14.5.2.2. By End-User 14.5.2.3. By Technology 14.6. United Kingdom 14.6.1. Pricing Analysis 14.6.2. Market Share Analysis, 2021 14.6.2.1. By Application 14.6.2.2. By End-User 14.6.2.3. By Technology 14.7. France 14.7.1. Pricing Analysis 14.7.2. Market Share Analysis, 2021 14.7.2.1. By Application 14.7.2.2. By End-User 14.7.2.3. By Technology 14.8. Spain 14.8.1. Pricing Analysis 14.8.2. Market Share Analysis, 2021 14.8.2.1. By Application 14.8.2.2. By End-User 14.8.2.3. By Technology 14.9. Italy 14.9.1. Pricing Analysis 14.9.2. Market Share Analysis, 2021 14.9.2.1. By Application 14.9.2.2. By End-User 14.9.2.3. By Technology 14.10. China 14.10.1. Pricing Analysis 14.10.2. Market Share Analysis, 2021 14.10.2.1. By Application 14.10.2.2. By End-User 14.10.2.3. By Technology 14.11. Japan 14.11.1. Pricing Analysis 14.11.2. Market Share Analysis, 2021 14.11.2.1. By Application 14.11.2.2. By End-User 14.11.2.3. By Technology 14.12. South Korea 14.12.1. Pricing Analysis 14.12.2. Market Share Analysis, 2021 14.12.2.1. By Application 14.12.2.2. By End-User 14.12.2.3. By Technology 14.13. Malaysia 14.13.1. Pricing Analysis 14.13.2. Market Share Analysis, 2021 14.13.2.1. By Application 14.13.2.2. By End-User 14.13.2.3. By Technology 14.14. Singapore 14.14.1. Pricing Analysis 14.14.2. Market Share Analysis, 2021 14.14.2.1. By Application 14.14.2.2. By End-User 14.14.2.3. By Technology 14.15. Australia 14.15.1. Pricing Analysis 14.15.2. Market Share Analysis, 2021 14.15.2.1. By Application 14.15.2.2. By End-User 14.15.2.3. By Technology 14.16. New Zealand 14.16.1. Pricing Analysis 14.16.2. Market Share Analysis, 2021 14.16.2.1. By Application 14.16.2.2. By End-User 14.16.2.3. By Technology 14.17. GCC Countries 14.17.1. Pricing Analysis 14.17.2. Market Share Analysis, 2021 14.17.2.1. By Application 14.17.2.2. By End-User 14.17.2.3. By Technology 14.18. South Africa 14.18.1. Pricing Analysis 14.18.2. Market Share Analysis, 2021 14.18.2.1. By Application 14.18.2.2. By End-User 14.18.2.3. By Technology 14.19. Israel 14.19.1. Pricing Analysis 14.19.2. Market Share Analysis, 2021 14.19.2.1. By Application 14.19.2.2. By End-User 14.19.2.3. By Technology 15. Market Structure Analysis 15.1. Competition Dashboard 15.2. Competition Benchmarking 15.3. Market Share Analysis of Top Players 15.3.1. By Regional 15.3.2. By Application 15.3.3. By End-User 15.3.4. By Technology 16. Competition Analysis 16.1. Competition Deep Dive 16.1.1. Honeywell International Inc. 16.1.1.1. Overview 16.1.1.2. Product Portfolio 16.1.1.3. Profitability by Market Segments 16.1.1.4. Sales Footprint 16.1.1.5. Strategy Overview 16.1.1.5.1. Marketing Strategy 16.1.1.5.2. Product Strategy 16.1.1.5.3. Channel Strategy 16.1.2. Lutron Electronics Co., Inc. 16.1.2.1. Overview 16.1.2.2. Product Portfolio 16.1.2.3. Profitability by Market Segments 16.1.2.4. Sales Footprint 16.1.2.5. Strategy Overview 16.1.2.5.1. Marketing Strategy 16.1.2.5.2. Product Strategy 16.1.2.5.3. Channel Strategy 16.1.3. Crestron Electronics, Inc. 16.1.3.1. Overview 16.1.3.2. Product Portfolio 16.1.3.3. Profitability by Market Segments 16.1.3.4. Sales Footprint 16.1.3.5. Strategy Overview 16.1.3.5.1. Marketing Strategy 16.1.3.5.2. Product Strategy 16.1.3.5.3. Channel Strategy 16.1.4. CONTROL4 CORPORATION 16.1.4.1. Overview 16.1.4.2. Product Portfolio 16.1.4.3. Profitability by Market Segments 16.1.4.4. Sales Footprint 16.1.4.5. Strategy Overview 16.1.4.5.1. Marketing Strategy 16.1.4.5.2. Product Strategy 16.1.4.5.3. Channel Strategy 16.1.5. Johnson Controls 16.1.5.1. Overview 16.1.5.2. Product Portfolio 16.1.5.3. Profitability by Market Segments 16.1.5.4. Sales Footprint 16.1.5.5. Strategy Overview 16.1.5.5.1. Marketing Strategy 16.1.5.5.2. Product Strategy 16.1.5.5.3. Channel Strategy 16.1.6. Acuity Brands, Inc. 16.1.6.1. Overview 16.1.6.2. Product Portfolio 16.1.6.3. Profitability by Market Segments 16.1.6.4. Sales Footprint 16.1.6.5. Strategy Overview 16.1.6.5.1. Marketing Strategy 16.1.6.5.2. Product Strategy 16.1.6.5.3. Channel Strategy 16.1.7. Nest Labs 16.1.7.1. Overview 16.1.7.2. Product Portfolio 16.1.7.3. Profitability by Market Segments 16.1.7.4. Sales Footprint 16.1.7.5. Strategy Overview 16.1.7.5.1. Marketing Strategy 16.1.7.5.2. Product Strategy 16.1.7.5.3. Channel Strategy 16.1.8. Schneider Electronics. 16.1.8.1. Overview 16.1.8.2. Product Portfolio 16.1.8.3. Profitability by Market Segments 16.1.8.4. Sales Footprint 16.1.8.5. Strategy Overview 16.1.8.5.1. Marketing Strategy 16.1.8.5.2. Product Strategy 16.1.8.5.3. Channel Strategy 16.1.9. Philips 16.1.9.1. Overview 16.1.9.2. Product Portfolio 16.1.9.3. Profitability by Market Segments 16.1.9.4. Sales Footprint 16.1.9.5. Strategy Overview 16.1.9.5.1. Marketing Strategy 16.1.9.5.2. Product Strategy 16.1.9.5.3. Channel Strategy 16.1.10. Legrand 16.1.10.1. Overview 16.1.10.2. Product Portfolio 16.1.10.3. Profitability by Market Segments 16.1.10.4. Sales Footprint 16.1.10.5. Strategy Overview 16.1.10.5.1. Marketing Strategy 16.1.10.5.2. Product Strategy 16.1.10.5.3. Channel Strategy 17. Assumptions & Acronyms Used 18. Research Methodology
Don't pay for what you don't need
Customize your report by selecting specific countries or regions and save 30%!
List of Tables
Table 1: Global Market Value (US$ Million) Forecast by Region, 2017 to 2032 Table 2: Global Market Volume (Units) Forecast by Region, 2017 to 2032 Table 3: Global Market Value (US$ Million) Forecast by Application, 2017 to 2032 Table 4: Global Market Volume (Units) Forecast by Application, 2017 to 2032 Table 5: Global Market Value (US$ Million) Forecast by End-User, 2017 to 2032 Table 6: Global Market Volume (Units) Forecast by End-User, 2017 to 2032 Table 7: Global Market Value (US$ Million) Forecast by Technology, 2017 to 2032 Table 8: Global Market Volume (Units) Forecast by Technology, 2017 to 2032 Table 9: North America Market Value (US$ Million) Forecast by Country, 2017 to 2032 Table 10: North America Market Volume (Units) Forecast by Country, 2017 to 2032 Table 11: North America Market Value (US$ Million) Forecast by Application, 2017 to 2032 Table 12: North America Market Volume (Units) Forecast by Application, 2017 to 2032 Table 13: North America Market Value (US$ Million) Forecast by End-User, 2017 to 2032 Table 14: North America Market Volume (Units) Forecast by End-User, 2017 to 2032 Table 15: North America Market Value (US$ Million) Forecast by Technology, 2017 to 2032 Table 16: North America Market Volume (Units) Forecast by Technology, 2017 to 2032 Table 17: Latin America Market Value (US$ Million) Forecast by Country, 2017 to 2032 Table 18: Latin America Market Volume (Units) Forecast by Country, 2017 to 2032 Table 19: Latin America Market Value (US$ Million) Forecast by Application, 2017 to 2032 Table 20: Latin America Market Volume (Units) Forecast by Application, 2017 to 2032 Table 21: Latin America Market Value (US$ Million) Forecast by End-User, 2017 to 2032 Table 22: Latin America Market Volume (Units) Forecast by End-User, 2017 to 2032 Table 23: Latin America Market Value (US$ Million) Forecast by Technology, 2017 to 2032 Table 24: Latin America Market Volume (Units) Forecast by Technology, 2017 to 2032 Table 25: Europe Market Value (US$ Million) Forecast by Country, 2017 to 2032 Table 26: Europe Market Volume (Units) Forecast by Country, 2017 to 2032 Table 27: Europe Market Value (US$ Million) Forecast by Application, 2017 to 2032 Table 28: Europe Market Volume (Units) Forecast by Application, 2017 to 2032 Table 29: Europe Market Value (US$ Million) Forecast by End-User, 2017 to 2032 Table 30: Europe Market Volume (Units) Forecast by End-User, 2017 to 2032 Table 31: Europe Market Value (US$ Million) Forecast by Technology, 2017 to 2032 Table 32: Europe Market Volume (Units) Forecast by Technology, 2017 to 2032 Table 33: Asia Pacific Market Value (US$ Million) Forecast by Country, 2017 to 2032 Table 34: Asia Pacific Market Volume (Units) Forecast by Country, 2017 to 2032 Table 35: Asia Pacific Market Value (US$ Million) Forecast by Application, 2017 to 2032 Table 36: Asia Pacific Market Volume (Units) Forecast by Application, 2017 to 2032 Table 37: Asia Pacific Market Value (US$ Million) Forecast by End-User, 2017 to 2032 Table 38: Asia Pacific Market Volume (Units) Forecast by End-User, 2017 to 2032 Table 39: Asia Pacific Market Value (US$ Million) Forecast by Technology, 2017 to 2032 Table 40: Asia Pacific Market Volume (Units) Forecast by Technology, 2017 to 2032 Table 41: Middle East and Africa Market Value (US$ Million) Forecast by Country, 2017 to 2032 Table 42: Middle East and Africa Market Volume (Units) Forecast by Country, 2017 to 2032 Table 43: Middle East and Africa Market Value (US$ Million) Forecast by Application, 2017 to 2032 Table 44: Middle East and Africa Market Volume (Units) Forecast by Application, 2017 to 2032 Table 45: Middle East and Africa Market Value (US$ Million) Forecast by End-User, 2017 to 2032 Table 46: Middle East and Africa Market Volume (Units) Forecast by End-User, 2017 to 2032 Table 47: Middle East and Africa Market Value (US$ Million) Forecast by Technology, 2017 to 2032 Table 48: Middle East and Africa Market Volume (Units) Forecast by Technology, 2017 to 2032
Find your sweet spots for generating winning opportunities in this market.
Talk to AnalystList of Charts
Figure 1: Global Market Value (US$ Million) by Application, 2022 to 2032 Figure 2: Global Market Value (US$ Million) by End-User, 2022 to 2032 Figure 3: Global Market Value (US$ Million) by Technology, 2022 to 2032 Figure 4: Global Market Value (US$ Million) by Region, 2022 to 2032 Figure 5: Global Market Value (US$ Million) Analysis by Region, 2017 to 2032 Figure 6: Global Market Volume (Units) Analysis by Region, 2017 to 2032 Figure 7: Global Market Value Share (%) and BPS Analysis by Region, 2022 to 2032 Figure 8: Global Market Y-o-Y Growth (%) Projections by Region, 2022 to 2032 Figure 9: Global Market Value (US$ Million) Analysis by Application, 2017 to 2032 Figure 10: Global Market Volume (Units) Analysis by Application, 2017 to 2032 Figure 11: Global Market Value Share (%) and BPS Analysis by Application, 2022 to 2032 Figure 12: Global Market Y-o-Y Growth (%) Projections by Application, 2022 to 2032 Figure 13: Global Market Value (US$ Million) Analysis by End-User, 2017 to 2032 Figure 14: Global Market Volume (Units) Analysis by End-User, 2017 to 2032 Figure 15: Global Market Value Share (%) and BPS Analysis by End-User, 2022 to 2032 Figure 16: Global Market Y-o-Y Growth (%) Projections by End-User, 2022 to 2032 Figure 17: Global Market Value (US$ Million) Analysis by Technology, 2017 to 2032 Figure 18: Global Market Volume (Units) Analysis by Technology, 2017 to 2032 Figure 19: Global Market Value Share (%) and BPS Analysis by Technology, 2022 to 2032 Figure 20: Global Market Y-o-Y Growth (%) Projections by Technology, 2022 to 2032 Figure 21: Global Market Attractiveness by Application, 2022 to 2032 Figure 22: Global Market Attractiveness by End-User, 2022 to 2032 Figure 23: Global Market Attractiveness by Technology, 2022 to 2032 Figure 24: Global Market Attractiveness by Region, 2022 to 2032 Figure 25: North America Market Value (US$ Million) by Application, 2022 to 2032 Figure 26: North America Market Value (US$ Million) by End-User, 2022 to 2032 Figure 27: North America Market Value (US$ Million) by Technology, 2022 to 2032 Figure 28: North America Market Value (US$ Million) by Country, 2022 to 2032 Figure 29: North America Market Value (US$ Million) Analysis by Country, 2017 to 2032 Figure 30: North America Market Volume (Units) Analysis by Country, 2017 to 2032 Figure 31: North America Market Value Share (%) and BPS Analysis by Country, 2022 to 2032 Figure 32: North America Market Y-o-Y Growth (%) Projections by Country, 2022 to 2032 Figure 33: North America Market Value (US$ Million) Analysis by Application, 2017 to 2032 Figure 34: North America Market Volume (Units) Analysis by Application, 2017 to 2032 Figure 35: North America Market Value Share (%) and BPS Analysis by Application, 2022 to 2032 Figure 36: North America Market Y-o-Y Growth (%) Projections by Application, 2022 to 2032 Figure 37: North America Market Value (US$ Million) Analysis by End-User, 2017 to 2032 Figure 38: North America Market Volume (Units) Analysis by End-User, 2017 to 2032 Figure 39: North America Market Value Share (%) and BPS Analysis by End-User, 2022 to 2032 Figure 40: North America Market Y-o-Y Growth (%) Projections by End-User, 2022 to 2032 Figure 41: North America Market Value (US$ Million) Analysis by Technology, 2017 to 2032 Figure 42: North America Market Volume (Units) Analysis by Technology, 2017 to 2032 Figure 43: North America Market Value Share (%) and BPS Analysis by Technology, 2022 to 2032 Figure 44: North America Market Y-o-Y Growth (%) Projections by Technology, 2022 to 2032 Figure 45: North America Market Attractiveness by Application, 2022 to 2032 Figure 46: North America Market Attractiveness by End-User, 2022 to 2032 Figure 47: North America Market Attractiveness by Technology, 2022 to 2032 Figure 48: North America Market Attractiveness by Country, 2022 to 2032 Figure 49: Latin America Market Value (US$ Million) by Application, 2022 to 2032 Figure 50: Latin America Market Value (US$ Million) by End-User, 2022 to 2032 Figure 51: Latin America Market Value (US$ Million) by Technology, 2022 to 2032 Figure 52: Latin America Market Value (US$ Million) by Country, 2022 to 2032 Figure 53: Latin America Market Value (US$ Million) Analysis by Country, 2017 to 2032 Figure 54: Latin America Market Volume (Units) Analysis by Country, 2017 to 2032 Figure 55: Latin America Market Value Share (%) and BPS Analysis by Country, 2022 to 2032 Figure 56: Latin America Market Y-o-Y Growth (%) Projections by Country, 2022 to 2032 Figure 57: Latin America Market Value (US$ Million) Analysis by Application, 2017 to 2032 Figure 58: Latin America Market Volume (Units) Analysis by Application, 2017 to 2032 Figure 59: Latin America Market Value Share (%) and BPS Analysis by Application, 2022 to 2032 Figure 60: Latin America Market Y-o-Y Growth (%) Projections by Application, 2022 to 2032 Figure 61: Latin America Market Value (US$ Million) Analysis by End-User, 2017 to 2032 Figure 62: Latin America Market Volume (Units) Analysis by End-User, 2017 to 2032 Figure 63: Latin America Market Value Share (%) and BPS Analysis by End-User, 2022 to 2032 Figure 64: Latin America Market Y-o-Y Growth (%) Projections by End-User, 2022 to 2032 Figure 65: Latin America Market Value (US$ Million) Analysis by Technology, 2017 to 2032 Figure 66: Latin America Market Volume (Units) Analysis by Technology, 2017 to 2032 Figure 67: Latin America Market Value Share (%) and BPS Analysis by Technology, 2022 to 2032 Figure 68: Latin America Market Y-o-Y Growth (%) Projections by Technology, 2022 to 2032 Figure 69: Latin America Market Attractiveness by Application, 2022 to 2032 Figure 70: Latin America Market Attractiveness by End-User, 2022 to 2032 Figure 71: Latin America Market Attractiveness by Technology, 2022 to 2032 Figure 72: Latin America Market Attractiveness by Country, 2022 to 2032 Figure 73: Europe Market Value (US$ Million) by Application, 2022 to 2032 Figure 74: Europe Market Value (US$ Million) by End-User, 2022 to 2032 Figure 75: Europe Market Value (US$ Million) by Technology, 2022 to 2032 Figure 76: Europe Market Value (US$ Million) by Country, 2022 to 2032 Figure 77: Europe Market Value (US$ Million) Analysis by Country, 2017 to 2032 Figure 78: Europe Market Volume (Units) Analysis by Country, 2017 to 2032 Figure 79: Europe Market Value Share (%) and BPS Analysis by Country, 2022 to 2032 Figure 80: Europe Market Y-o-Y Growth (%) Projections by Country, 2022 to 2032 Figure 81: Europe Market Value (US$ Million) Analysis by Application, 2017 to 2032 Figure 82: Europe Market Volume (Units) Analysis by Application, 2017 to 2032 Figure 83: Europe Market Value Share (%) and BPS Analysis by Application, 2022 to 2032 Figure 84: Europe Market Y-o-Y Growth (%) Projections by Application, 2022 to 2032 Figure 85: Europe Market Value (US$ Million) Analysis by End-User, 2017 to 2032 Figure 86: Europe Market Volume (Units) Analysis by End-User, 2017 to 2032 Figure 87: Europe Market Value Share (%) and BPS Analysis by End-User, 2022 to 2032 Figure 88: Europe Market Y-o-Y Growth (%) Projections by End-User, 2022 to 2032 Figure 89: Europe Market Value (US$ Million) Analysis by Technology, 2017 to 2032 Figure 90: Europe Market Volume (Units) Analysis by Technology, 2017 to 2032 Figure 91: Europe Market Value Share (%) and BPS Analysis by Technology, 2022 to 2032 Figure 92: Europe Market Y-o-Y Growth (%) Projections by Technology, 2022 to 2032 Figure 93: Europe Market Attractiveness by Application, 2022 to 2032 Figure 94: Europe Market Attractiveness by End-User, 2022 to 2032 Figure 95: Europe Market Attractiveness by Technology, 2022 to 2032 Figure 96: Europe Market Attractiveness by Country, 2022 to 2032 Figure 97: Asia Pacific Market Value (US$ Million) by Application, 2022 to 2032 Figure 98: Asia Pacific Market Value (US$ Million) by End-User, 2022 to 2032 Figure 99: Asia Pacific Market Value (US$ Million) by Technology, 2022 to 2032 Figure 100: Asia Pacific Market Value (US$ Million) by Country, 2022 to 2032 Figure 101: Asia Pacific Market Value (US$ Million) Analysis by Country, 2017 to 2032 Figure 102: Asia Pacific Market Volume (Units) Analysis by Country, 2017 to 2032 Figure 103: Asia Pacific Market Value Share (%) and BPS Analysis by Country, 2022 to 2032 Figure 104: Asia Pacific Market Y-o-Y Growth (%) Projections by Country, 2022 to 2032 Figure 105: Asia Pacific Market Value (US$ Million) Analysis by Application, 2017 to 2032 Figure 106: Asia Pacific Market Volume (Units) Analysis by Application, 2017 to 2032 Figure 107: Asia Pacific Market Value Share (%) and BPS Analysis by Application, 2022 to 2032 Figure 108: Asia Pacific Market Y-o-Y Growth (%) Projections by Application, 2022 to 2032 Figure 109: Asia Pacific Market Value (US$ Million) Analysis by End-User, 2017 to 2032 Figure 110: Asia Pacific Market Volume (Units) Analysis by End-User, 2017 to 2032 Figure 111: Asia Pacific Market Value Share (%) and BPS Analysis by End-User, 2022 to 2032 Figure 112: Asia Pacific Market Y-o-Y Growth (%) Projections by End-User, 2022 to 2032 Figure 113: Asia Pacific Market Value (US$ Million) Analysis by Technology, 2017 to 2032 Figure 114: Asia Pacific Market Volume (Units) Analysis by Technology, 2017 to 2032 Figure 115: Asia Pacific Market Value Share (%) and BPS Analysis by Technology, 2022 to 2032 Figure 116: Asia Pacific Market Y-o-Y Growth (%) Projections by Technology, 2022 to 2032 Figure 117: Asia Pacific Market Attractiveness by Application, 2022 to 2032 Figure 118: Asia Pacific Market Attractiveness by End-User, 2022 to 2032 Figure 119: Asia Pacific Market Attractiveness by Technology, 2022 to 2032 Figure 120: Asia Pacific Market Attractiveness by Country, 2022 to 2032 Figure 121: Middle East and Africa Market Value (US$ Million) by Application, 2022 to 2032 Figure 122: Middle East and Africa Market Value (US$ Million) by End-User, 2022 to 2032 Figure 123: Middle East and Africa Market Value (US$ Million) by Technology, 2022 to 2032 Figure 124: Middle East and Africa Market Value (US$ Million) by Country, 2022 to 2032 Figure 125: Middle East and Africa Market Value (US$ Million) Analysis by Country, 2017 to 2032 Figure 126: Middle East and Africa Market Volume (Units) Analysis by Country, 2017 to 2032 Figure 127: Middle East and Africa Market Value Share (%) and BPS Analysis by Country, 2022 to 2032 Figure 128: Middle East and Africa Market Y-o-Y Growth (%) Projections by Country, 2022 to 2032 Figure 129: Middle East and Africa Market Value (US$ Million) Analysis by Application, 2017 to 2032 Figure 130: Middle East and Africa Market Volume (Units) Analysis by Application, 2017 to 2032 Figure 131: Middle East and Africa Market Value Share (%) and BPS Analysis by Application, 2022 to 2032 Figure 132: Middle East and Africa Market Y-o-Y Growth (%) Projections by Application, 2022 to 2032 Figure 133: Middle East and Africa Market Value (US$ Million) Analysis by End-User, 2017 to 2032 Figure 134: Middle East and Africa Market Volume (Units) Analysis by End-User, 2017 to 2032 Figure 135: Middle East and Africa Market Value Share (%) and BPS Analysis by End-User, 2022 to 2032 Figure 136: Middle East and Africa Market Y-o-Y Growth (%) Projections by End-User, 2022 to 2032 Figure 137: Middle East and Africa Market Value (US$ Million) Analysis by Technology, 2017 to 2032 Figure 138: Middle East and Africa Market Volume (Units) Analysis by Technology, 2017 to 2032 Figure 139: Middle East and Africa Market Value Share (%) and BPS Analysis by Technology, 2022 to 2032 Figure 140: Middle East and Africa Market Y-o-Y Growth (%) Projections by Technology, 2022 to 2032 Figure 141: Middle East and Africa Market Attractiveness by Application, 2022 to 2032 Figure 142: Middle East and Africa Market Attractiveness by End-User, 2022 to 2032 Figure 143: Middle East and Africa Market Attractiveness by Technology, 2022 to 2032 Figure 144: Middle East and Africa Market Attractiveness by Country, 2022 to 2032
Recommendations
Explore Technology Insights
View Reports