Smart IoT Pumps Market Size and Share Forecast Outlook 2025 to 2035

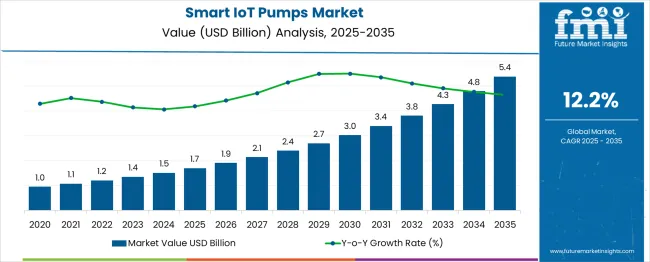
The smart IoT pumps market is projected to reach a valuation of USD 1.7 billion in 2025 and expand to USD 5.4 billion by 2035, reflecting a net increase of USD 3.7 billion over the decade. This translates to a total market expansion of 217.6%, with the compound annual growth rate (CAGR) estimated at 12.2%. Over the ten-year period, the market grows 3.1 in size.
Quick Stats for Smart IoT Pumps Market

  • Market Value (2025): USD 1.7 billion
  • Market Forecast Value (2035): USD 5.4 billion
  • Market Forecast CAGR: 12.2%
  • Leading Segment in 2025: Bluetooth-enabled(38.2%)
  • Key Growth Regions: Europe (United Kingdom is the fastest-growing market with 12.9% CAGR)
  • Top Key Players: Sunyi Packaging, Silgan Dispensing, Rieke Packaging, Frapak Packaging B.V., Sidel (Tetra Laval Group), TPC (The Packaging Company).

Smart Iot Pumps Market Market Value Analysis

Metric Value
Industry Size (2025E) USD 1.7 billion
Industry Value (2035F) USD 5.4 billion
CAGR (2025 to 2035) 12.2%

During the first five-year period (2025 to 2030), the market rises from USD 1.7 billion to USD 3.0 billion, contributing USD 1.3 billion, which accounts for 35.1% of the total decade growth. This phase is characterized by steady integration of IoT-enabled pumps across water utilities, HVAC systems, and building automation networks. The surge in smart city infrastructure and municipal water monitoring drives initial demand, with centrifugal pumps embedded with sensor modules accounting for over 50% of installations.

In the second half from 2030 to 2035, the market grows from USD 3.0 billion to USD 5.4 billion, adding USD 2.4 billion, or 64.9% of total growth. This period witnesses accelerated adoption of AI-integrated pump diagnostics, energy optimization algorithms, and cloud-connected performance platforms. Positive displacement pumps and hybrid pumping systems see growing traction, while software platforms and predictive analytics surpass 50% of value share due to recurring SaaS and maintenance contracts in industrial and agricultural verticals.

From 2020 to 2024, the smart IoT pumps market grew from USD 0.96 billion to USD 1.51 billion, driven by hardware-centric adoption across water management, smart agriculture, industrial automation, and connected building systems. During this period, the competitive landscape was dominated by equipment manufacturers controlling nearly 70% of total revenue, with companies such as Sunyi Packaging, Silgan Dispensing, and Rieke Packaging leading development in sensor-integrated, remotely operable pumps.

Competitive differentiation relied on pump efficiency, embedded telemetry, and compatibility with existing SCADA and IoT frameworks, while software was typically bundled within OEM interfaces and not monetized independently. Service-based models had limited adoption, contributing less than 10% of market value, as early-stage buyers prioritized device performance and integration ease over digital subscriptions.

Demand for smart IoT pumps will expand to USD 5.4 billion in 2035, and the revenue mix will shift as software, predictive analytics, and remote maintenance services grow to over 45% share. Traditional hardware players face rising competition from digital-native vendors offering cloud-connected interfaces, usage pattern analytics, and edge-AI-driven energy optimization.

Major OEMs are pivoting to hybrid models, embedding remote configuration tools, condition-based alerts, and app-connected workflows to retain market share. Emerging players such as Frapak Packaging B.V., Sidel (Tetra Laval Group), and TPC (The Packaging Company) are gaining traction by specializing in open-protocol integration, circular IoT platforms, and sector-specific smart pump solutions.

Why the Smart IoT Pumps Market is growing?

The integration of real-time monitoring, predictive analytics, and wireless connectivity into pump systems is driving growth in the smart IoT pumps market. These pumps enable remote diagnostics, automatic performance optimization, and energy-efficient operations across industrial and municipal applications. Increasing demand for smart water management, energy conservation, and automation in fluid handling is fueling adoption across sectors such as utilities, building services, and manufacturing.

Centrifugal and positive displacement pumps embedded with IoT sensors have gained popularity due to their ability to transmit pressure, flow, and vibration data to cloud-based platforms. These features support condition-based maintenance, reduce downtime, and optimize asset utilization. The rise of Industry 4.0 and smart factory initiatives has further increased the demand for connected pump systems that integrate with SCADA and ERP environments.

Industries such as oil & gas, wastewater treatment, and HVAC systems are driving demand for intelligent pump technologies that can adapt dynamically to varying process loads. These systems support sustainability targets, cost reduction, and compliance with environmental mandates through data-driven decision-making and energy optimization.

Segment growth is expected to be led by centrifugal pump types, cloud-integrated monitoring systems in control categories, and wireless communication modules due to their scalability, interoperability, and role in enabling decentralized pump network management.

Segmental Analysis

The market is segmented by connectivity type, power source, functionality, application, end-use industry, and region. Connectivity type includes Bluetooth, Wi-Fi, NFC, and RFID, enabling real-time communication, data sharing, and device integration across IoT ecosystems. Power source segmentation covers battery-powered, rechargeable (USB), and manual with smart cap, allowing for flexible deployment across home and clinical environments.

In terms of functionality, the segmentation includes dispense tracking, refill alert, dosage control, and tamper detection, supporting precision dispensing and user safety. Application areas comprise medication dispensing, smart fragrance pumps, and interactive cosmetic dispensers, reflecting the convergence of personalization and health monitoring. The end-use industry scope includes healthcare, personal care, elderly care, and consumer electronics, where smart automation and user behavior insights are increasingly valued. Regionally, the market is divided into North America, Europe, Asia-Pacific, Latin America, and the Middle East & Africa.
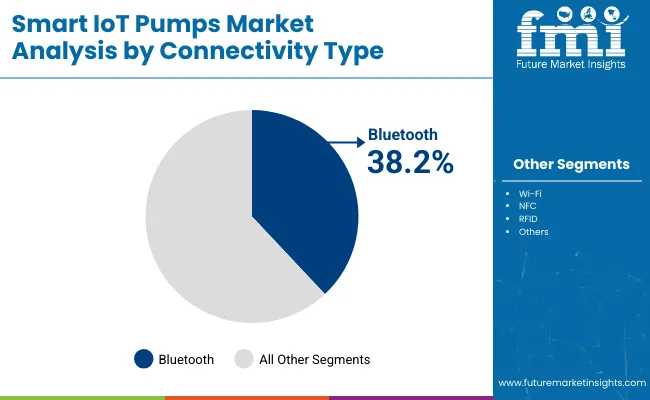
Bluetooth-Enabled Segment Dominates Due to Seamless Smartphone Integration and User Accessibility

Smart Iot Pumps Market By Connectivity Type

The Bluetooth-enabled segment is projected to hold the highest share of 38.2% in the Smart IoT Pumps Market by 2025. This dominance is primarily driven by the increasing integration of smart pumps with mobile apps and wearable devices, offering users real-time control, dosage precision, and refill alerts. Bluetooth technology allows pump systems to operate wirelessly and synchronize usage data with health and lifestyle apps, enhancing user convenience and product personalization.

manufacturers are embedding Bluetooth chips into pump packaging formats to allow consumers to monitor fluid consumption, track expiration dates, and receive automated reminders for replacements. The affordability and widespread compatibility of Bluetooth with most consumer electronics make it a default choice for smart packaging. With beauty, healthcare, and hygiene brands embracing connected packaging, Bluetooth-enabled smart pumps are rapidly evolving into a packaging standard for next-gen, user-interactive dispensing solutions.
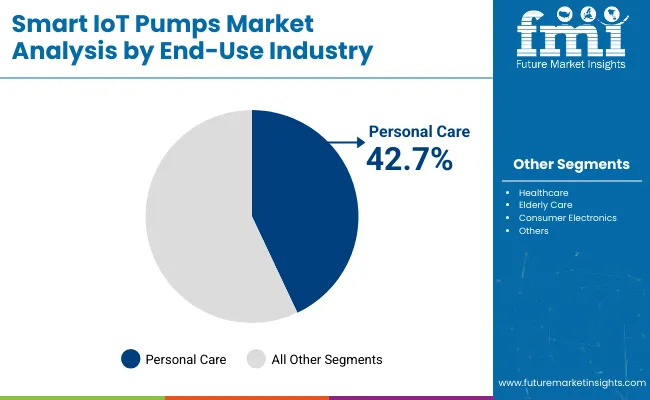
Personal Care Segment Leads as Smart Cosmetic Dispensers Align with Refillability and Sustainability Trends

Smart Iot Pumps Market By End Use Industry

The personal care segment is forecasted to lead the end-use industry in the smart IoT pumps market, accounting for a 42.7% share in 2025. This growth is attributed to rising consumer demand for connected beauty experiences, where smart packaging technologies offer dosing accuracy, application tracking, and personalized skincare regimens. IoT-enabled pumps are increasingly integrated into smart mirrors and skin diagnostic tools, creating seamless ecosystems for tech-savvy users.

Refillable formats enabled by smart pumps also support zero-waste initiatives, where brands aim to reduce single-use plastic through smart-enabled cartridges and pump-enabled reuse systems. Leading cosmetics companies are investing in sustainable IoT solutions that monitor usage behavior while minimizing environmental impact. As consumers shift toward eco-conscious and tech-integrated personal care routines, smart pump solutions are becoming essential in aligning product performance with digital lifestyles.
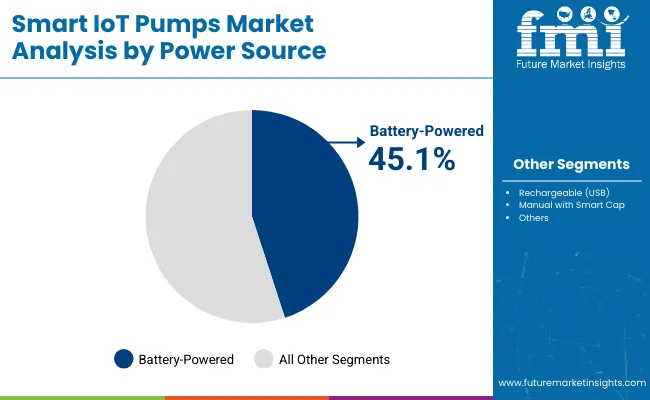
Battery-powered Smart IoT Pumps to Dominate Due to Wireless Flexibility and Reusability

Smart Iot Pumps Market By Power Source

The battery-powered segment is expected to account for the highest share of 45.1% in 2025 in the smart IoT pumps market. This dominance stems from growing demand for portable and wire-free smart dispensing solutions across consumer and medical applications. Battery-powered units allow users to operate pumps independently of fixed power sources, making them ideal for home healthcare, cosmetic routines, and personal hygiene settings.

These pumps often integrate Bluetooth or Wi-Fi modules, and their rechargeable or replaceable battery systems enhance product sustainability and reusability. Their convenience aligns with increasing consumer preferences for clutter-free, minimalistic designs, especially in connected health and personal care environments.
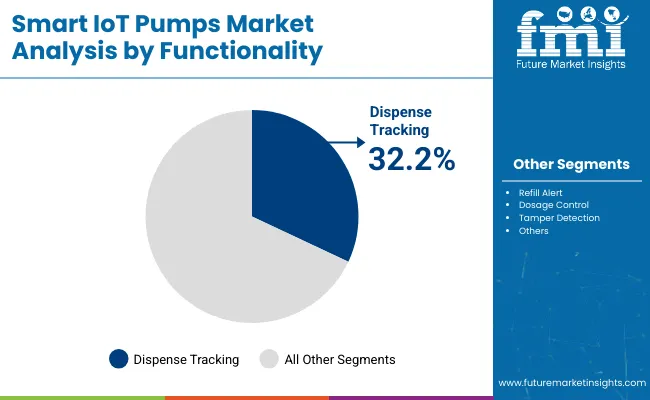
Dispense Tracking Functionality Gains Ground as Brands Prioritize Real-Time Usage Insights

Smart Iot Pumps Market By Functionality

The dispense tracking segment is projected to account for 32.2% share in 2025 in the smart IoT pumps market. This growth is driven by rising adoption of smart dispensing systems that monitor, record, and transmit dosing or usage data in real time. Brands in both the cosmetic and medical sectors are increasingly integrating this feature to promote product adherence, personalize refill recommendations, and track consumption patterns.

Dispense tracking provides users with instant feedback on usage history, supports parental or caregiver monitoring, and helps ensure proper dosage in regulated applications.
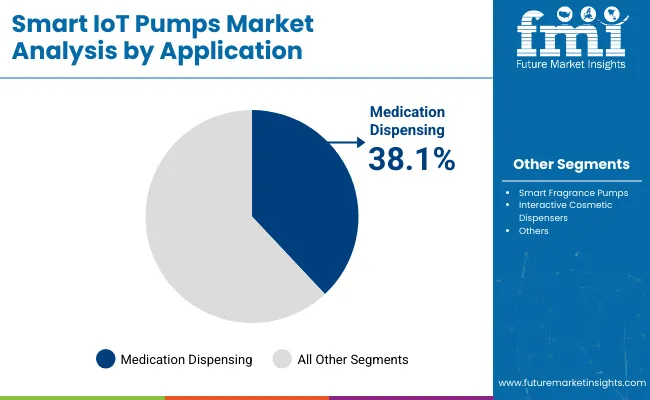
Medication Dispensing Emerges as Leading Application on Back of Smart Adherence Solutions

Smart Iot Pumps Market By Application

The medication dispensing application is projected to lead the smart IoT pumps market with a 38.1% share in 2025. This leadership is attributed to rising global interest in connected drug delivery systems that improve medication adherence, reduce dosing errors, and streamline remote patient monitoring. Smart pumps designed for medical use cases increasingly feature programmable dosing schedules, lockout features, and real-time alerts, ensuring safe and accurate dispensing of oral, dermal, or sublingual medications.

Their role in chronic disease management, elderly care, and home-based therapies is expanding rapidly, especially in response to the shift toward decentralized healthcare models. Integration with telehealth platforms and electronic health records further enhances their appeal in clinical environments.

What are the Drivers, Restraints, and Key Trends of the Smart IoT Pumps Market?

Data overload, integration complexity, and high upfront costs hinder smart IoT pump deployment, even as demand rises in manufacturing, utilities, and water infrastructure for real-time monitoring, predictive maintenance, and energy-efficient, sensor-integrated pumping systems.

Remote Monitoring and Predictive Maintenance Driving Industrial Adoption

Smart IoT pumps are increasingly adopted in industries such as water utilities, chemical processing, oil & gas, and building automation due to their real-time monitoring and control capabilities. These pumps are embedded with sensors that continuously track parameters such as pressure, temperature, and flow, enabling early detection of anomalies and reducing downtime.

Integration with SCADA systems and cloud platforms allows operators to remotely manage multiple assets across locations, improving operational efficiency and safety. Predictive maintenance algorithms also reduce unplanned servicing and extend equipment lifespan. The demand for intelligent pumps is further supported by sustainability mandates and the growing need to optimize energy consumption across critical infrastructure.

High Costs and Complexity in System Integration

Despite their operational advantages, smart IoT pumps remain cost-prohibitive for many small and mid-sized enterprises. The initial investment includes not only the pump hardware but also the software, sensors, wireless modules, and data platforms required for full integration.

Added to this are cybersecurity concerns, as connected systems introduce new vulnerabilities within operational technology networks. Moreover, integrating smart pumps with legacy infrastructure or third-party systems can be technically challenging, requiring skilled IT-OT convergence and ongoing support. These issues collectively limit deployment in industries where budget constraints or low digital maturity restrict access to IoT-enabled solutions.

AI-powered Analytics and Cloud-native Pumping Solutions Gaining Ground

One of the most significant trends in the smart pump market is the adoption of AI-powered analytics and cloud-native control platforms. Manufacturers are embedding edge computing modules within pump systems to enable localized decision-making and reduce data latency.

These systems use machine learning models to optimize flow profiles, identify anomalies, and adapt pump performance in real-time. At the same time, cloud connectivity ensures seamless integration with enterprise-level dashboards, enhancing visibility across distributed assets. This digital transformation is being accelerated by decarbonization goals, water scarcity challenges, and smart city initiatives, which position intelligent pumping systems as a critical enabler of infrastructure modernization.
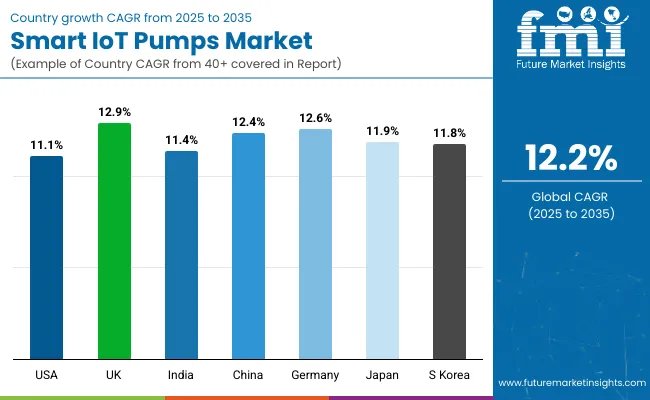
Analysis of Smart IoT Pumps Market by Key Countries

Country Wise Analysis Smart Iot Pumps Market

The global smart IoT pumps market is expanding rapidly, driven by advancements in sensor-enabled fluid control, predictive maintenance systems, and energy-efficient operations. Integration of Industrial Internet of Things (IIoT), cloud analytics, and remote diagnostics is transforming conventional pump systems into intelligent, self-monitoring solutions. Asia-Pacific is emerging as a key growth engine, with China and India investing heavily in smart water infrastructure and connected manufacturing.

In Europe, Germany and the UK are leading smart retrofit adoption for industrial automation and sustainability compliance. North America, led by the USA is witnessing strong demand for IIoT-based pumping solutions in building automation, utilities, and smart agriculture. Globally, cloud-integrated diagnostics, AI-enabled flow optimization, and real-time energy usage tracking are central to smart pump market evolution.

Sales Outlook for Smart IoT Pumps in the United States

The smart IoT pumps market in the United States is projected to grow at a CAGR of 11.1% between 2025 and 2035. The surge is driven by advanced retrofitting of legacy fluid systems in utilities, HVAC systems, and industrial cooling applications. Federal energy-efficiency incentives and sustainability targets are accelerating the shift to smart pump systems with cloud-connectivity and energy monitoring features. OEMs are focusing on AI-enhanced control platforms that offer fault detection, leak prediction, and condition-based servicing.

  • Commercial buildings are adopting IoT-integrated pumps to manage HVAC load and water usage.
  • Utilities are deploying cloud-enabled pump systems for real-time monitoring and leak alerts.
  • OEMs are launching smart retrofitting modules for legacy centrifugal and booster pumps.

Growth and Expansion Outlook for Smart IoT Pumps in the United Kingdom

The smart IoT pumps market in the United Kingdom is expected to grow at a CAGR of 12.9%, fueled by Industry 4.0 transformation across manufacturing and public utilities. Government-backed decarbonization initiatives and regulatory focus on water leakage control have driven demand for smart water and wastewater pump installations. In urban infrastructure, pump-as-a-service models and predictive diagnostics are gaining traction among local councils and smart city programs.

  • Smart pump systems are being deployed for intelligent water management in urban boroughs
  • Industrial users are integrating sensors and data dashboards for energy and pressure optimization.
  • Startups and OEMs are offering subscription-based smart pump services for SMEs and municipalities.

Growth and Expansion Outlook for Smart IoT Pumps in India

India is experiencing rapid growth in the smart IoT pumps market, forecast to expand at a CAGR of 11.4% through 2035. Demand is driven by smart irrigation systems, state-level water grid digitization programs, and adoption in process industries seeking efficiency and uptime. MSMEs and smart city mission projects are implementing IoT-enabled pumps for water reuse, leak detection, and flow automation. Local manufacturers are partnering with analytics providers to offer scalable, mobile-connected pump solutions.

  • Smart irrigation schemes are deploying IoT pump controllers in rural and semi-urban zones.
  • Water boards are investing in pressure-monitored pumps to detect and localize leakages.
  • Pump makers are embedding Bluetooth and GSM-based modules for small-scale industrial users.

Sales Outlook for Smart IoT Pumps in China

The smart IoT pumps market in China is expected to grow at a CAGR of 12.4%, supported by large-scale industrial automation, smart city development, and robust digital infrastructure. Government-led initiatives for smart water conservation and predictive asset management are fueling the market. Integration of AI-driven diagnostics and 5G-based remote monitoring is helping local manufacturers deliver competitively priced yet high-tech smart pump systems for both industrial and municipal use.

  • Smart pump adoption is expanding in smart manufacturing zones and water reuse systems.
  • Municipal networks are using real-time data to optimize pump energy consumption and pressure loads.
  • Domestic OEMs are developing edge-enabled pump controllers with AI analytics and 5G modules.

In-depth Analysis of Smart IoT Pumps in Germany

The smart IoT pumps market in Germany is projected to grow at a CAGR of 12.6%, driven by adoption across automotive, pharmaceuticals, chemicals, and building automation sectors. Industry 4.0 strategies and the Green Deal framework are supporting real-time monitoring, fault prediction, and smart flow modulation. German OEMs are embedding AI algorithms into decentralized control units to optimize pressure, detect anomalies, and enhance life-cycle management.

  • Process plants are using vibration sensors and ML models to minimize unplanned pump downtime.
  • HVAC and facility management teams are switching to IoT pumps with occupancy-based demand control.
  • Digital twin technology is being paired with smart pumps for real-time simulation and benchmarking.

Growth Outlook for Smart IoT Pumps in Japan

The smart IoT pumps market in Japan is projected to grow at a CAGR of 11.9%, supported by high-precision industrial needs and government-driven sustainability goals. The integration of smart fluid systems in semiconductor fabs, biotech labs, and smart buildings is driving new installations. Japan's manufacturing sector emphasizes condition monitoring and energy management, leading to rapid adoption of pumps embedded with diagnostics, remote access platforms, and alert-triggered automation.

  • Smart pumps are used in semiconductor cleanrooms for high-stability pressure control.
  • Facility operators rely on predictive alerts to maintain optimal pump uptime and fluid quality.
  • Energy use dashboards are integrated with smart pump systems for ESG reporting.

Opportunity Analysis of South Korea Smart IoT Pumps Market

The smart IoT pumps market in South Korea is projected to grow at a CAGR of 11.8%, valued for its deployment in microelectronics, medical devices, and infrastructure automation. As the country advances its smart factory roadmap, pump systems are being networked into centralized control systems with real-time analytics and AI-based maintenance scheduling. Short-cycle and high-pressure operations in tech industries are leading use cases, supported by widespread 5G connectivity.

  • Medical and electronics firms deploy smart dosing pumps for precision fluid management.
  • Factories are integrating IoT-enabled pumps into MES and SCADA layers for centralized control.
  • Energy-efficient smart pumps are being installed in eco-resilient building retrofits.

Competitive Landscape of Smart IoT Pumps Market

The smart IoT pumps market is moderately fragmented, with packaging automation leaders, fluid dispensing system manufacturers, and digitally enhanced pump solution providers competing across personal care, home care, pharmaceutical, and industrial fluid delivery applications. Global players such as Silgan Dispensing and Sidel (Tetra Laval Group) hold significant market share, driven by sensor-integrated pump designs, cloud-based monitoring systems, and closed-loop feedback for flow control and usage analytics. Their strategies increasingly emphasize Bluetooth/NFC-enabled smart closures, refill-tracking apps, and connected dispensers for both commercial and consumer-facing environments.

Established mid-sized players including Rieke Packaging, TPC (The Packaging Company), and Frapak Packaging B.V. are actively advancing adoption through semi-automated dispensing systems embedded with tamper alerts, metering capabilities, and adaptive triggers. These companies are addressing niche segments like precision cosmetic dispensing, medical dosing, and reusable container integration with smart-pump technologies aligned to sustainability and data-driven UX design.

Specialized providers such as Sunyi Packaging and TPC focus on cost-effective, application-specific smart pump modules for skincare, cleaning products, and refillable IoT-connected packaging. Their strength lies in agile development of modular pump designs with compatibility for multiple viscosities, cloud-based refill alerts, and customizable smart dispensing features suitable for smart home ecosystems and emerging refill-as-a-service (RaaS) models.

Key Development of Smart IoT Pumps Market

  • April 25, 2025, Grundfos launched the CUE 120, a new locally engineered variable-frequency drive (VFD) in India for energy-efficient smart pump control.
  • LEWA GmbH, Smart Monitoring IoT solution for industrial pumps from LEWA and generic.de receive Allianz Industrie 4.0 Award. Seamless remote monitoring even in remote locations.

Report Scope

Item Value
Quantitative Units USD 1.7 Billion
By Connectivity Type Bluetooth, Wi-Fi, NFC, and RFID
By Power Source Battery-powered, Rechargeable (USB), and Manual with Smart Cap
By Functionality Dispense Tracking, Refill Alert, Dosage Control, and Tamper Detection
By Application Medication Dispensing, Smart Fragrance Pumps, and Interactive Cosmetic Dispensers
By End-Use Industry Healthcare, Personal Care, Elderly Care, and Consumer Electronics
Key Companies Profiled Sunyi Packaging, Silgan Dispensing, Rieke Packaging, Frapak Packaging B.V., Sidel (Tetra Laval Group), TPC (The Packaging Company).
Additional Attributes Integration of IoT for real-time monitoring and remote control, increased use in connected skincare and wellness routines, demand driven by aging population and remote medication adherence, rise in refillable smart dispensers with NFC pairing, development of app-based dosage scheduling systems, enhanced patient safety with tamper alerts and smart lockouts, growing deployment in ambient intelligence platforms, cross-industry applications in health-tech and consumer IoT , regional growth led by North America and East Asia, and innovation in battery optimization for extended smart pump life

Key Segments

By Connectivity Type:

  • Bluetooth
  • Wi-Fi
  • NFC
  • RFID

By Power Source:

  • Battery-powered
  • Rechargeable (USB)
  • Manual with Smart Cap

By Functionality

  • Dispense Tracking
  • Refill Alert
  • Dosage Control
  • Tamper Detection

By Application:

  • Medication Dispensing
  • Smart Fragrance Pumps
  • Interactive Cosmetic Dispensers

By End-Use Industry

  • Healthcare
  • Personal Care
  • Elderly Care
  • Consumer Electronics

By Region

  • North America
  • Europe
  • Asia-Pacific
  • Latin America
  • Middle East & Africa

Table of Content

  1. Executive Summary
    • Global Market Outlook
    • Demand-side Trends
    • Supply-side Trends
    • Technology Roadmap Analysis
    • Analysis and Recommendations
  2. Market Overview
    • Market Coverage / Taxonomy
    • Market Definition / Scope / Limitations
  3. Market Background
    • Market Dynamics
      • Drivers
      • Restraints
      • Opportunity
      • Trends
    • Scenario Forecast
      • Demand in Optimistic Scenario
      • Demand in Likely Scenario
      • Demand in Conservative Scenario
    • Opportunity Map Analysis
    • Product Life Cycle Analysis
    • Supply Chain Analysis
      • Supply Side Participants and their Roles
        • Producers
        • Mid-Level Participants (Traders/ Agents/ Brokers)
        • Wholesalers and Distributors
      • Value Added and Value Created at Node in the Supply Chain
      • List of Raw Material Suppliers
      • List of Existing and Potential Buyer’s
    • Investment Feasibility Matrix
    • Value Chain Analysis
      • Profit Margin Analysis
      • Wholesalers and Distributors
      • Retailers
    • PESTLE and Porter’s Analysis
    • Regulatory Landscape
      • By Key Regions
      • By Key Countries
    • Regional Parent Market Outlook
    • Production and Consumption Statistics
    • Import and Export Statistics
  4. Global Analysis 2020-2024 and Forecast, 2025-2035
    • Historical Market Size Value (USD Million) & Volume (Units) Analysis, 2020-2024
    • Current and Future Market Size Value (USD Million) & Volume (Units) Projections, 2025-2035
      • Y-o-Y Growth Trend Analysis
      • Absolute $ Opportunity Analysis
  5. Global Pricing Analysis 2020-2024 and Forecast 2025-2035
  6. Global Analysis 2020-2024 and Forecast 2025-2035, By By Connectivity Type
    • Introduction / Key Findings
    • Historical Market Size Value (USD Million) & Volume (Units) Analysis By By Connectivity Type, 2020-2024
    • Current and Future Market Size Value (USD Million) & Volume (Units) Analysis and Forecast By By Connectivity Type, 2025-2035
      • Bluetooth
      • Wi-Fi
      • NFC
      • RFID
    • Y-o-Y Growth Trend Analysis By By Connectivity Type, 2020-2024
    • Absolute $ Opportunity Analysis By By Connectivity Type, 2025-2035
  7. Global Analysis 2020-2024 and Forecast 2025-2035, By By Power Source
    • Introduction / Key Findings
    • Historical Market Size Value (USD Million) & Volume (Units) Analysis By By Power Source, 2020-2024
    • Current and Future Market Size Value (USD Million) & Volume (Units) Analysis and Forecast By By Power Source, 2025-2035
      • Battery-powered
      • Rechargeable (USB)
      • Manual with Smart Cap
    • Y-o-Y Growth Trend Analysis By By Power Source, 2020-2024
    • Absolute $ Opportunity Analysis By By Power Source, 2025-2035
  8. Global Analysis 2020-2024 and Forecast 2025-2035, By By Functionality
    • Introduction / Key Findings
    • Historical Market Size Value (USD Million) & Volume (Units) Analysis By By Functionality, 2020-2024
    • Current and Future Market Size Value (USD Million) & Volume (Units) Analysis and Forecast By By Functionality, 2025-2035
      • Dispense Tracking
      • Refill Alert
      • Dosage Control
      • Tamper Detection
    • Y-o-Y Growth Trend Analysis By By Functionality, 2020-2024
    • Absolute $ Opportunity Analysis By By Functionality, 2025-2035
  9. Global Analysis 2020-2024 and Forecast 2025-2035, By By Application
    • Introduction / Key Findings
    • Historical Market Size Value (USD Million) & Volume (Units) Analysis By By Application, 2020-2024
    • Current and Future Market Size Value (USD Million) & Volume (Units) Analysis and Forecast By By Application, 2025-2035
      • Medication Dispensing
      • Smart Fragrance Pumps
      • Interactive Cosmetic Dispensers
    • Y-o-Y Growth Trend Analysis By By Application, 2020-2024
    • Absolute $ Opportunity Analysis By By Application, 2025-2035
  10. Global Analysis 2020-2024 and Forecast 2025-2035, By By End-Use Industry
    • Introduction / Key Findings
    • Historical Market Size Value (USD Million) & Volume (Units) Analysis By By End-Use Industry, 2020-2024
    • Current and Future Market Size Value (USD Million) & Volume (Units) Analysis and Forecast By By End-Use Industry, 2025-2035
      • Healthcare
      • Personal Care
      • Elderly Care
      • Consumer Electronics
    • Y-o-Y Growth Trend Analysis By By End-Use Industry, 2020-2024
    • Absolute $ Opportunity Analysis By By End-Use Industry, 2025-2035
  11. Global Analysis 2020-2024 and Forecast 2025-2035, By Region
    • Introduction
    • Historical Market Size Value (USD Million) & Volume (Units) Analysis By Region, 2020-2024
    • Current Market Size Value (USD Million) & Volume (Units) Analysis and Forecast By Region, 2025-2035
      • North America
      • Latin America
      • Europe
      • East Asia
      • South Asia
      • Oceania
      • MEA
    • Market Attractiveness Analysis By Region
  12. North America Analysis 2020-2024 and Forecast 2025-2035, By Country
    • Historical Market Size Value (USD Million) & Volume (Units) Trend Analysis By Market Taxonomy, 2020-2024
    • Market Size Value (USD Million) & Volume (Units) Forecast By Market Taxonomy, 2025-2035
      • By Country
        • USA
        • Canada
      • By By Connectivity Type
      • By By Power Source
      • By By Functionality
      • By By Application
      • By By End-Use Industry
    • Market Attractiveness Analysis
      • By Country
      • By By Connectivity Type
      • By By Power Source
      • By By Functionality
      • By By Application
      • By By End-Use Industry
    • Key Takeaways
  13. Latin America Analysis 2020-2024 and Forecast 2025-2035, By Country
    • Historical Market Size Value (USD Million) & Volume (Units) Trend Analysis By Market Taxonomy, 2020-2024
    • Market Size Value (USD Million) & Volume (Units) Forecast By Market Taxonomy, 2025-2035
      • By Country
        • Brazil
        • Mexico
        • Argentina
        • Chile
        • Peru
        • Rest of Latin America
      • By By Connectivity Type
      • By By Power Source
      • By By Functionality
      • By By Application
      • By By End-Use Industry
    • Market Attractiveness Analysis
      • By Country
      • By By Connectivity Type
      • By By Power Source
      • By By Functionality
      • By By Application
      • By By End-Use Industry
    • Key Takeaways
  14. Europe Analysis 2020-2024 and Forecast 2025-2035, By Country
    • Historical Market Size Value (USD Million) & Volume (Units) Trend Analysis By Market Taxonomy, 2020-2024
    • Market Size Value (USD Million) & Volume (Units) Forecast By Market Taxonomy, 2025-2035
      • By Country
        • Germany
        • Italy
        • France
        • UK
        • Spain
        • Russia
        • BENELUX
        • Rest of Europe
      • By By Connectivity Type
      • By By Power Source
      • By By Functionality
      • By By Application
      • By By End-Use Industry
    • Market Attractiveness Analysis
      • By Country
      • By By Connectivity Type
      • By By Power Source
      • By By Functionality
      • By By Application
      • By By End-Use Industry
    • Key Takeaways
  15. East Asia Analysis 2020-2024 and Forecast 2025-2035, By Country
    • Historical Market Size Value (USD Million) & Volume (Units) Trend Analysis By Market Taxonomy, 2020-2024
    • Market Size Value (USD Million) & Volume (Units) Forecast By Market Taxonomy, 2025-2035
      • By Country
        • China
        • Japan
        • South Korea
      • By By Connectivity Type
      • By By Power Source
      • By By Functionality
      • By By Application
      • By By End-Use Industry
    • Market Attractiveness Analysis
      • By Country
      • By By Connectivity Type
      • By By Power Source
      • By By Functionality
      • By By Application
      • By By End-Use Industry
    • Key Takeaways
  16. South Asia Analysis 2020-2024 and Forecast 2025-2035, By Country
    • Historical Market Size Value (USD Million) & Volume (Units) Trend Analysis By Market Taxonomy, 2020-2024
    • Market Size Value (USD Million) & Volume (Units) Forecast By Market Taxonomy, 2025-2035
      • By Country
        • India
        • Thailand
        • Malaysia
        • Indonesia
        • Rest of South Asia
      • By By Connectivity Type
      • By By Power Source
      • By By Functionality
      • By By Application
      • By By End-Use Industry
    • Market Attractiveness Analysis
      • By Country
      • By By Connectivity Type
      • By By Power Source
      • By By Functionality
      • By By Application
      • By By End-Use Industry
    • Key Takeaways
  17. Oceania Analysis 2020-2024 and Forecast 2025-2035, By Country
    • Historical Market Size Value (USD Million) & Volume (Units) Trend Analysis By Market Taxonomy, 2020-2024
    • Market Size Value (USD Million) & Volume (Units) Forecast By Market Taxonomy, 2025-2035
      • By Country
        • Australia
        • New Zealand
      • By By Connectivity Type
      • By By Power Source
      • By By Functionality
      • By By Application
      • By By End-Use Industry
    • Market Attractiveness Analysis
      • By Country
      • By By Connectivity Type
      • By By Power Source
      • By By Functionality
      • By By Application
      • By By End-Use Industry
    • Key Takeaways
  18. MEA Analysis 2020-2024 and Forecast 2025-2035, By Country
    • Historical Market Size Value (USD Million) & Volume (Units) Trend Analysis By Market Taxonomy, 2020-2024
    • Market Size Value (USD Million) & Volume (Units) Forecast By Market Taxonomy, 2025-2035
      • By Country
        • GCC
        • Rest of MEA
      • By By Connectivity Type
      • By By Power Source
      • By By Functionality
      • By By Application
      • By By End-Use Industry
    • Market Attractiveness Analysis
      • By Country
      • By By Connectivity Type
      • By By Power Source
      • By By Functionality
      • By By Application
      • By By End-Use Industry
    • Key Takeaways
  19. Key Countries Analysis
    • USA
      • Pricing Analysis
      • Market Share Analysis, 2024
        • By By Connectivity Type
        • By By Power Source
        • By By Functionality
        • By By Application
        • By By End-Use Industry
    • Canada
      • Pricing Analysis
      • Market Share Analysis, 2024
        • By By Connectivity Type
        • By By Power Source
        • By By Functionality
        • By By Application
        • By By End-Use Industry
    • Brazil
      • Pricing Analysis
      • Market Share Analysis, 2024
        • By By Connectivity Type
        • By By Power Source
        • By By Functionality
        • By By Application
        • By By End-Use Industry
    • Mexico
      • Pricing Analysis
      • Market Share Analysis, 2024
        • By By Connectivity Type
        • By By Power Source
        • By By Functionality
        • By By Application
        • By By End-Use Industry
    • Argentina
      • Pricing Analysis
      • Market Share Analysis, 2024
        • By By Connectivity Type
        • By By Power Source
        • By By Functionality
        • By By Application
        • By By End-Use Industry
  20. Market Structure Analysis
    • Competition Dashboard
    • Competition Benchmarking
    • Market Share Analysis of Top Players
      • By Regional
      • By By Connectivity Type
      • By By Power Source
      • By By Functionality
      • By By Application
      • By By End-Use Industry
  21. Competition Analysis
    • Competition Deep Dive
      • Grundfos Holding A/S
        • Overview
        • Product Portfolio
        • Profitability by Market Segments (Product/Age /Sales Channel/Region)
        • Sales Footprint
        • Strategy Overview
          • Marketing Strategy
          • Product Strategy
          • Channel Strategy
      • Wilo SE
        • Overview
        • Product Portfolio
        • Profitability by Market Segments (Product/Age /Sales Channel/Region)
        • Sales Footprint
        • Strategy Overview
          • Marketing Strategy
          • Product Strategy
          • Channel Strategy
      • LEWA GmbH
        • Overview
        • Product Portfolio
        • Profitability by Market Segments (Product/Age /Sales Channel/Region)
        • Sales Footprint
        • Strategy Overview
          • Marketing Strategy
          • Product Strategy
          • Channel Strategy
      • SMARTBOT Pumps
        • Overview
        • Product Portfolio
        • Profitability by Market Segments (Product/Age /Sales Channel/Region)
        • Sales Footprint
        • Strategy Overview
          • Marketing Strategy
          • Product Strategy
          • Channel Strategy
      • Flowserve Corporation
        • Overview
        • Product Portfolio
        • Profitability by Market Segments (Product/Age /Sales Channel/Region)
        • Sales Footprint
        • Strategy Overview
          • Marketing Strategy
          • Product Strategy
          • Channel Strategy
      • EBARA CORPORATION.
        • Overview
        • Product Portfolio
        • Profitability by Market Segments (Product/Age /Sales Channel/Region)
        • Sales Footprint
        • Strategy Overview
          • Marketing Strategy
          • Product Strategy
          • Channel Strategy
      • STREAMPUMPS
        • Overview
        • Product Portfolio
        • Profitability by Market Segments (Product/Age /Sales Channel/Region)
        • Sales Footprint
        • Strategy Overview
          • Marketing Strategy
          • Product Strategy
          • Channel Strategy
      • Rotech Pumps & Systems Inc.
        • Overview
        • Product Portfolio
        • Profitability by Market Segments (Product/Age /Sales Channel/Region)
        • Sales Footprint
        • Strategy Overview
          • Marketing Strategy
          • Product Strategy
          • Channel Strategy
  22. Assumptions & Acronyms Used
  23. Research Methodology

List of Tables

  • Table 1: Global Value (USD Million) Forecast by Region, 2020-2035
  • Table 2: Global Volume (Units) Forecast by Region, 2020-2035
  • Table 3: Global Value (USD Million) Forecast by By Connectivity Type, 2020-2035
  • Table 4: Global Volume (Units) Forecast by By Connectivity Type, 2020-2035
  • Table 5: Global Value (USD Million) Forecast by By Power Source, 2020-2035
  • Table 6: Global Volume (Units) Forecast by By Power Source, 2020-2035
  • Table 7: Global Value (USD Million) Forecast by By Functionality, 2020-2035
  • Table 8: Global Volume (Units) Forecast by By Functionality, 2020-2035
  • Table 9: Global Value (USD Million) Forecast by By Application, 2020-2035
  • Table 10: Global Volume (Units) Forecast by By Application, 2020-2035
  • Table 11: Global Value (USD Million) Forecast by By End-Use Industry, 2020-2035
  • Table 12: Global Volume (Units) Forecast by By End-Use Industry, 2020-2035
  • Table 13: North America Value (USD Million) Forecast by Country, 2020-2035
  • Table 14: North America Volume (Units) Forecast by Country, 2020-2035
  • Table 15: North America Value (USD Million) Forecast by By Connectivity Type, 2020-2035
  • Table 16: North America Volume (Units) Forecast by By Connectivity Type, 2020-2035
  • Table 17: North America Value (USD Million) Forecast by By Power Source, 2020-2035
  • Table 18: North America Volume (Units) Forecast by By Power Source, 2020-2035
  • Table 19: North America Value (USD Million) Forecast by By Functionality, 2020-2035
  • Table 20: North America Volume (Units) Forecast by By Functionality, 2020-2035
  • Table 21: North America Value (USD Million) Forecast by By Application, 2020-2035
  • Table 22: North America Volume (Units) Forecast by By Application, 2020-2035
  • Table 23: North America Value (USD Million) Forecast by By End-Use Industry, 2020-2035
  • Table 24: North America Volume (Units) Forecast by By End-Use Industry, 2020-2035
  • Table 25: Latin America Value (USD Million) Forecast by Country, 2020-2035
  • Table 26: Latin America Volume (Units) Forecast by Country, 2020-2035
  • Table 27: Latin America Value (USD Million) Forecast by By Connectivity Type, 2020-2035
  • Table 28: Latin America Volume (Units) Forecast by By Connectivity Type, 2020-2035
  • Table 29: Latin America Value (USD Million) Forecast by By Power Source, 2020-2035
  • Table 30: Latin America Volume (Units) Forecast by By Power Source, 2020-2035
  • Table 31: Latin America Value (USD Million) Forecast by By Functionality, 2020-2035
  • Table 32: Latin America Volume (Units) Forecast by By Functionality, 2020-2035
  • Table 33: Latin America Value (USD Million) Forecast by By Application, 2020-2035
  • Table 34: Latin America Volume (Units) Forecast by By Application, 2020-2035
  • Table 35: Latin America Value (USD Million) Forecast by By End-Use Industry, 2020-2035
  • Table 36: Latin America Volume (Units) Forecast by By End-Use Industry, 2020-2035
  • Table 37: Europe Value (USD Million) Forecast by Country, 2020-2035
  • Table 38: Europe Volume (Units) Forecast by Country, 2020-2035
  • Table 39: Europe Value (USD Million) Forecast by By Connectivity Type, 2020-2035
  • Table 40: Europe Volume (Units) Forecast by By Connectivity Type, 2020-2035
  • Table 41: Europe Value (USD Million) Forecast by By Power Source, 2020-2035
  • Table 42: Europe Volume (Units) Forecast by By Power Source, 2020-2035
  • Table 43: Europe Value (USD Million) Forecast by By Functionality, 2020-2035
  • Table 44: Europe Volume (Units) Forecast by By Functionality, 2020-2035
  • Table 45: Europe Value (USD Million) Forecast by By Application, 2020-2035
  • Table 46: Europe Volume (Units) Forecast by By Application, 2020-2035
  • Table 47: Europe Value (USD Million) Forecast by By End-Use Industry, 2020-2035
  • Table 48: Europe Volume (Units) Forecast by By End-Use Industry, 2020-2035
  • Table 49: East Asia Value (USD Million) Forecast by Country, 2020-2035
  • Table 50: East Asia Volume (Units) Forecast by Country, 2020-2035
  • Table 51: East Asia Value (USD Million) Forecast by By Connectivity Type, 2020-2035
  • Table 52: East Asia Volume (Units) Forecast by By Connectivity Type, 2020-2035
  • Table 53: East Asia Value (USD Million) Forecast by By Power Source, 2020-2035
  • Table 54: East Asia Volume (Units) Forecast by By Power Source, 2020-2035
  • Table 55: East Asia Value (USD Million) Forecast by By Functionality, 2020-2035
  • Table 56: East Asia Volume (Units) Forecast by By Functionality, 2020-2035
  • Table 57: East Asia Value (USD Million) Forecast by By Application, 2020-2035
  • Table 58: East Asia Volume (Units) Forecast by By Application, 2020-2035
  • Table 59: East Asia Value (USD Million) Forecast by By End-Use Industry, 2020-2035
  • Table 60: East Asia Volume (Units) Forecast by By End-Use Industry, 2020-2035
  • Table 61: South Asia Value (USD Million) Forecast by Country, 2020-2035
  • Table 62: South Asia Volume (Units) Forecast by Country, 2020-2035
  • Table 63: South Asia Value (USD Million) Forecast by By Connectivity Type, 2020-2035
  • Table 64: South Asia Volume (Units) Forecast by By Connectivity Type, 2020-2035
  • Table 65: South Asia Value (USD Million) Forecast by By Power Source, 2020-2035
  • Table 66: South Asia Volume (Units) Forecast by By Power Source, 2020-2035
  • Table 67: South Asia Value (USD Million) Forecast by By Functionality, 2020-2035
  • Table 68: South Asia Volume (Units) Forecast by By Functionality, 2020-2035
  • Table 69: South Asia Value (USD Million) Forecast by By Application, 2020-2035
  • Table 70: South Asia Volume (Units) Forecast by By Application, 2020-2035
  • Table 71: South Asia Value (USD Million) Forecast by By End-Use Industry, 2020-2035
  • Table 72: South Asia Volume (Units) Forecast by By End-Use Industry, 2020-2035
  • Table 73: Oceania Value (USD Million) Forecast by Country, 2020-2035
  • Table 74: Oceania Volume (Units) Forecast by Country, 2020-2035
  • Table 75: Oceania Value (USD Million) Forecast by By Connectivity Type, 2020-2035
  • Table 76: Oceania Volume (Units) Forecast by By Connectivity Type, 2020-2035
  • Table 77: Oceania Value (USD Million) Forecast by By Power Source, 2020-2035
  • Table 78: Oceania Volume (Units) Forecast by By Power Source, 2020-2035
  • Table 79: Oceania Value (USD Million) Forecast by By Functionality, 2020-2035
  • Table 80: Oceania Volume (Units) Forecast by By Functionality, 2020-2035
  • Table 81: Oceania Value (USD Million) Forecast by By Application, 2020-2035
  • Table 82: Oceania Volume (Units) Forecast by By Application, 2020-2035
  • Table 83: Oceania Value (USD Million) Forecast by By End-Use Industry, 2020-2035
  • Table 84: Oceania Volume (Units) Forecast by By End-Use Industry, 2020-2035
  • Table 85: MEA Value (USD Million) Forecast by Country, 2020-2035
  • Table 86: MEA Volume (Units) Forecast by Country, 2020-2035
  • Table 87: MEA Value (USD Million) Forecast by By Connectivity Type, 2020-2035
  • Table 88: MEA Volume (Units) Forecast by By Connectivity Type, 2020-2035
  • Table 89: MEA Value (USD Million) Forecast by By Power Source, 2020-2035
  • Table 90: MEA Volume (Units) Forecast by By Power Source, 2020-2035
  • Table 91: MEA Value (USD Million) Forecast by By Functionality, 2020-2035
  • Table 92: MEA Volume (Units) Forecast by By Functionality, 2020-2035
  • Table 93: MEA Value (USD Million) Forecast by By Application, 2020-2035
  • Table 94: MEA Volume (Units) Forecast by By Application, 2020-2035
  • Table 95: MEA Value (USD Million) Forecast by By End-Use Industry, 2020-2035
  • Table 96: MEA Volume (Units) Forecast by By End-Use Industry, 2020-2035

List of Figures

  • Figure 1: Global Volume (Units) Forecast 2020-2035
  • Figure 2: Global Pricing Analysis
  • Figure 3: Global Value (USD Million) Forecast 2020-2035
  • Figure 4: Global Value Share and BPS Analysis by By Connectivity Type, 2025 and 2035
  • Figure 5: Global Y-o-Y Growth Comparison by By Connectivity Type, 2025-2035
  • Figure 6: Global Attractiveness Analysis by By Connectivity Type
  • Figure 7: Global Value Share and BPS Analysis by By Power Source, 2025 and 2035
  • Figure 8: Global Y-o-Y Growth Comparison by By Power Source, 2025-2035
  • Figure 9: Global Attractiveness Analysis by By Power Source
  • Figure 10: Global Value Share and BPS Analysis by By Functionality, 2025 and 2035
  • Figure 11: Global Y-o-Y Growth Comparison by By Functionality, 2025-2035
  • Figure 12: Global Attractiveness Analysis by By Functionality
  • Figure 13: Global Value Share and BPS Analysis by By Application, 2025 and 2035
  • Figure 14: Global Y-o-Y Growth Comparison by By Application, 2025-2035
  • Figure 15: Global Attractiveness Analysis by By Application
  • Figure 16: Global Value Share and BPS Analysis by By End-Use Industry, 2025 and 2035
  • Figure 17: Global Y-o-Y Growth Comparison by By End-Use Industry, 2025-2035
  • Figure 18: Global Attractiveness Analysis by By End-Use Industry
  • Figure 19: Global Value (USD Million) Share and BPS Analysis by Region, 2025 and 2035
  • Figure 20: Global Y-o-Y Growth Comparison by Region, 2025-2035
  • Figure 21: Global Attractiveness Analysis by Region
  • Figure 22: North America Incremental $ Opportunity, 2025-2035
  • Figure 23: Latin America Incremental $ Opportunity, 2025-2035
  • Figure 24: Europe Incremental $ Opportunity, 2025-2035
  • Figure 25: East Asia Incremental $ Opportunity, 2025-2035
  • Figure 26: South Asia Incremental $ Opportunity, 2025-2035
  • Figure 27: Oceania Incremental $ Opportunity, 2025-2035
  • Figure 28: MEA Incremental $ Opportunity, 2025-2035
  • Figure 29: North America Value Share and BPS Analysis by Country, 2025 and 2035
  • Figure 30: North America Value Share and BPS Analysis by By Connectivity Type, 2025 and 2035
  • Figure 31: North America Y-o-Y Growth Comparison by By Connectivity Type, 2025-2035
  • Figure 32: North America Attractiveness Analysis by By Connectivity Type
  • Figure 33: North America Value Share and BPS Analysis by By Power Source, 2025 and 2035
  • Figure 34: North America Y-o-Y Growth Comparison by By Power Source, 2025-2035
  • Figure 35: North America Attractiveness Analysis by By Power Source
  • Figure 36: North America Value Share and BPS Analysis by By Functionality, 2025 and 2035
  • Figure 37: North America Y-o-Y Growth Comparison by By Functionality, 2025-2035
  • Figure 38: North America Attractiveness Analysis by By Functionality
  • Figure 39: North America Value Share and BPS Analysis by By Application, 2025 and 2035
  • Figure 40: North America Y-o-Y Growth Comparison by By Application, 2025-2035
  • Figure 41: North America Attractiveness Analysis by By Application
  • Figure 42: North America Value Share and BPS Analysis by By End-Use Industry, 2025 and 2035
  • Figure 43: North America Y-o-Y Growth Comparison by By End-Use Industry, 2025-2035
  • Figure 44: North America Attractiveness Analysis by By End-Use Industry
  • Figure 45: Latin America Value Share and BPS Analysis by Country, 2025 and 2035
  • Figure 46: Latin America Value Share and BPS Analysis by By Connectivity Type, 2025 and 2035
  • Figure 47: Latin America Y-o-Y Growth Comparison by By Connectivity Type, 2025-2035
  • Figure 48: Latin America Attractiveness Analysis by By Connectivity Type
  • Figure 49: Latin America Value Share and BPS Analysis by By Power Source, 2025 and 2035
  • Figure 50: Latin America Y-o-Y Growth Comparison by By Power Source, 2025-2035
  • Figure 51: Latin America Attractiveness Analysis by By Power Source
  • Figure 52: Latin America Value Share and BPS Analysis by By Functionality, 2025 and 2035
  • Figure 53: Latin America Y-o-Y Growth Comparison by By Functionality, 2025-2035
  • Figure 54: Latin America Attractiveness Analysis by By Functionality
  • Figure 55: Latin America Value Share and BPS Analysis by By Application, 2025 and 2035
  • Figure 56: Latin America Y-o-Y Growth Comparison by By Application, 2025-2035
  • Figure 57: Latin America Attractiveness Analysis by By Application
  • Figure 58: Latin America Value Share and BPS Analysis by By End-Use Industry, 2025 and 2035
  • Figure 59: Latin America Y-o-Y Growth Comparison by By End-Use Industry, 2025-2035
  • Figure 60: Latin America Attractiveness Analysis by By End-Use Industry
  • Figure 61: Europe Value Share and BPS Analysis by Country, 2025 and 2035
  • Figure 62: Europe Value Share and BPS Analysis by By Connectivity Type, 2025 and 2035
  • Figure 63: Europe Y-o-Y Growth Comparison by By Connectivity Type, 2025-2035
  • Figure 64: Europe Attractiveness Analysis by By Connectivity Type
  • Figure 65: Europe Value Share and BPS Analysis by By Power Source, 2025 and 2035
  • Figure 66: Europe Y-o-Y Growth Comparison by By Power Source, 2025-2035
  • Figure 67: Europe Attractiveness Analysis by By Power Source
  • Figure 68: Europe Value Share and BPS Analysis by By Functionality, 2025 and 2035
  • Figure 69: Europe Y-o-Y Growth Comparison by By Functionality, 2025-2035
  • Figure 70: Europe Attractiveness Analysis by By Functionality
  • Figure 71: Europe Value Share and BPS Analysis by By Application, 2025 and 2035
  • Figure 72: Europe Y-o-Y Growth Comparison by By Application, 2025-2035
  • Figure 73: Europe Attractiveness Analysis by By Application
  • Figure 74: Europe Value Share and BPS Analysis by By End-Use Industry, 2025 and 2035
  • Figure 75: Europe Y-o-Y Growth Comparison by By End-Use Industry, 2025-2035
  • Figure 76: Europe Attractiveness Analysis by By End-Use Industry
  • Figure 77: East Asia Value Share and BPS Analysis by Country, 2025 and 2035
  • Figure 78: East Asia Value Share and BPS Analysis by By Connectivity Type, 2025 and 2035
  • Figure 79: East Asia Y-o-Y Growth Comparison by By Connectivity Type, 2025-2035
  • Figure 80: East Asia Attractiveness Analysis by By Connectivity Type
  • Figure 81: East Asia Value Share and BPS Analysis by By Power Source, 2025 and 2035
  • Figure 82: East Asia Y-o-Y Growth Comparison by By Power Source, 2025-2035
  • Figure 83: East Asia Attractiveness Analysis by By Power Source
  • Figure 84: East Asia Value Share and BPS Analysis by By Functionality, 2025 and 2035
  • Figure 85: East Asia Y-o-Y Growth Comparison by By Functionality, 2025-2035
  • Figure 86: East Asia Attractiveness Analysis by By Functionality
  • Figure 87: East Asia Value Share and BPS Analysis by By Application, 2025 and 2035
  • Figure 88: East Asia Y-o-Y Growth Comparison by By Application, 2025-2035
  • Figure 89: East Asia Attractiveness Analysis by By Application
  • Figure 90: East Asia Value Share and BPS Analysis by By End-Use Industry, 2025 and 2035
  • Figure 91: East Asia Y-o-Y Growth Comparison by By End-Use Industry, 2025-2035
  • Figure 92: East Asia Attractiveness Analysis by By End-Use Industry
  • Figure 93: South Asia Value Share and BPS Analysis by Country, 2025 and 2035
  • Figure 94: South Asia Value Share and BPS Analysis by By Connectivity Type, 2025 and 2035
  • Figure 95: South Asia Y-o-Y Growth Comparison by By Connectivity Type, 2025-2035
  • Figure 96: South Asia Attractiveness Analysis by By Connectivity Type
  • Figure 97: South Asia Value Share and BPS Analysis by By Power Source, 2025 and 2035
  • Figure 98: South Asia Y-o-Y Growth Comparison by By Power Source, 2025-2035
  • Figure 99: South Asia Attractiveness Analysis by By Power Source
  • Figure 100: South Asia Value Share and BPS Analysis by By Functionality, 2025 and 2035
  • Figure 101: South Asia Y-o-Y Growth Comparison by By Functionality, 2025-2035
  • Figure 102: South Asia Attractiveness Analysis by By Functionality
  • Figure 103: South Asia Value Share and BPS Analysis by By Application, 2025 and 2035
  • Figure 104: South Asia Y-o-Y Growth Comparison by By Application, 2025-2035
  • Figure 105: South Asia Attractiveness Analysis by By Application
  • Figure 106: South Asia Value Share and BPS Analysis by By End-Use Industry, 2025 and 2035
  • Figure 107: South Asia Y-o-Y Growth Comparison by By End-Use Industry, 2025-2035
  • Figure 108: South Asia Attractiveness Analysis by By End-Use Industry
  • Figure 109: Oceania Value Share and BPS Analysis by Country, 2025 and 2035
  • Figure 110: Oceania Value Share and BPS Analysis by By Connectivity Type, 2025 and 2035
  • Figure 111: Oceania Y-o-Y Growth Comparison by By Connectivity Type, 2025-2035
  • Figure 112: Oceania Attractiveness Analysis by By Connectivity Type
  • Figure 113: Oceania Value Share and BPS Analysis by By Power Source, 2025 and 2035
  • Figure 114: Oceania Y-o-Y Growth Comparison by By Power Source, 2025-2035
  • Figure 115: Oceania Attractiveness Analysis by By Power Source
  • Figure 116: Oceania Value Share and BPS Analysis by By Functionality, 2025 and 2035
  • Figure 117: Oceania Y-o-Y Growth Comparison by By Functionality, 2025-2035
  • Figure 118: Oceania Attractiveness Analysis by By Functionality
  • Figure 119: Oceania Value Share and BPS Analysis by By Application, 2025 and 2035
  • Figure 120: Oceania Y-o-Y Growth Comparison by By Application, 2025-2035
  • Figure 121: Oceania Attractiveness Analysis by By Application
  • Figure 122: Oceania Value Share and BPS Analysis by By End-Use Industry, 2025 and 2035
  • Figure 123: Oceania Y-o-Y Growth Comparison by By End-Use Industry, 2025-2035
  • Figure 124: Oceania Attractiveness Analysis by By End-Use Industry
  • Figure 125: MEA Value Share and BPS Analysis by Country, 2025 and 2035
  • Figure 126: MEA Value Share and BPS Analysis by By Connectivity Type, 2025 and 2035
  • Figure 127: MEA Y-o-Y Growth Comparison by By Connectivity Type, 2025-2035
  • Figure 128: MEA Attractiveness Analysis by By Connectivity Type
  • Figure 129: MEA Value Share and BPS Analysis by By Power Source, 2025 and 2035
  • Figure 130: MEA Y-o-Y Growth Comparison by By Power Source, 2025-2035
  • Figure 131: MEA Attractiveness Analysis by By Power Source
  • Figure 132: MEA Value Share and BPS Analysis by By Functionality, 2025 and 2035
  • Figure 133: MEA Y-o-Y Growth Comparison by By Functionality, 2025-2035
  • Figure 134: MEA Attractiveness Analysis by By Functionality
  • Figure 135: MEA Value Share and BPS Analysis by By Application, 2025 and 2035
  • Figure 136: MEA Y-o-Y Growth Comparison by By Application, 2025-2035
  • Figure 137: MEA Attractiveness Analysis by By Application
  • Figure 138: MEA Value Share and BPS Analysis by By End-Use Industry, 2025 and 2035
  • Figure 139: MEA Y-o-Y Growth Comparison by By End-Use Industry, 2025-2035
  • Figure 140: MEA Attractiveness Analysis by By End-Use Industry
  • Figure 141: Global - Tier Structure Analysis
  • Figure 142: Global - Company Share Analysis

Frequently Asked Questions

How big is the smart IoT pumps market in 2025?

The global smart IoT pumps market is estimated to be valued at USD 1.7 billion in 2025.

What will be the size of the smart IoT pumps market in 2035?

The market size for the smart IoT pumps market is projected to reach USD 5.4 billion by 2035.

How much will be the smart IoT pumps market growth between 2025 and 2035?

The smart IoT pumps market is expected to grow at a 12.2% CAGR between 2025 and 2035.

What are the key product types in the smart IoT pumps market?

The key product types in the smart IoT pumps market include centrifugal pumps, positive displacement pumps, peristaltic pumps, and diaphragm pumps with integrated IoT features.

Which connectivity segment is expected to contribute significant share in the smart IoT pumps market in 2025?

In terms of connectivity, the Bluetooth-enabled segment is expected to command the highest share of 38.2% in the smart IoT pumps market in 2025.

Explore Similar Insights

Future Market Insights

Smart IoT Pumps Market

Chat With

MaRIA

Hi There, I am MaRIA, Your Market Research Intelligence Assistant. How may I help you?