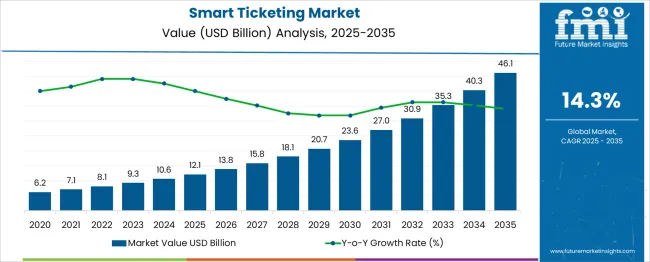
The smart ticketing market is estimated to be valued at USD 12.1 billion in 2025 and is projected to reach USD 46.1 billion by 2035, registering a compound annual growth rate (CAGR) of 14.3% over the forecast period. Year-on-year (YoY) growth in absolute terms steadily increases across the period, with annual increments rising from USD 1.7 billion between 2025 and 2026 to USD 5.8 billion between 2034 and 2035. During the initial five years (2025–2030), the average annual increase is USD 2.3 billion. From 2030 to 2035, the annual average jumps to USD 4.1 billion, confirming a steep acceleration trend.
The YoY percentage gain begins at 14.0% between 2025 and 2026 and crosses 15.0% from 2030 onward. This trajectory reflects scaling demand from integrated transport systems, mobile-first transit experiences, and expanding digital fare interoperability. Incremental gains from 2025 to 2028 remain below USD 3.0 billion annually, but surpass this threshold from 2029 forward.
Ticketing innovations in urban mobility platforms, intermodal fare systems, and event entry management are key contributors to this progression. Published transport systems research and mobility engineering literature point to real-time validation, biometric authentication, and multi-token payments as key enabling layers reinforcing YoY expansion in both public and commercial smart ticketing infrastructure.
| Metric | Value |
|---|---|
| Smart Ticketing Market Estimated Value in (2025 E) | USD 12.1 billion |
| Smart Ticketing Market Forecast Value in (2035 F) | USD 46.1 billion |
| Forecast CAGR (2025 to 2035) | 14.3% |
Smart ticketing captures approximately 35% of the public transport systems market, through contactless cards and mobile applications used in buses, trains, and subways. Around 25% is derived from event ticketing, where QR codes and e-tickets streamline entry to concerts, sports, and exhibitions. About 20% of the demand ties into digital payment platforms, because ticketing relies on secure transactions.
The transit technology and fare-collection segment contributes roughly 30%, reflecting investments in back-end systems and validators. The remaining 15% comes from broader smart city and integrated mobility initiatives, where unified ticketing across modes improves usability and planning. The market is undergoing a shift as more than 55% of transit systems now rely on contactless and mobile-based platforms for fare collection. Account-based ticketing adoption has increased, allowing fare capping and travel flexibility across multiple transport modes.
Around 30% of deployments in urban networks include biometric or QR-based access to reduce manual checks and improve throughput. Hardware upgrades in gates and validators are enabling interoperability between metro, rail, and bus services. Approximately 40% of cities with integrated systems are also reducing printed ticket dependency. This transition is changing how mobility providers manage access, payments, and commuter data.
The current market environment is characterized by widespread adoption of digital payment systems and enhanced focus on operational efficiency in public transportation and event management. Corporate disclosures and technology news highlight that governments and private operators are increasingly investing in smart infrastructure to improve passenger convenience while reducing operational costs.
The future outlook remains strong as innovations in secure authentication, cloud integration, and mobile ticketing continue to evolve. Increased regulatory emphasis on transparent and efficient fare collection, combined with growing urbanization and rising disposable incomes, has further contributed to the momentum.
Statements from transportation agencies and industry announcements have underscored sustainability benefits, such as reduced paper usage and lower maintenance requirements, which are also shaping long-term market growth. These factors collectively establish a favorable foundation for sustained adoption across regions and industries.
The smart ticketing market is segmented by component, offering, connectivity, end use, and geographic regions. The smart ticketing market is divided into Hardware, Software, and Services. In terms of providing the smart ticketing market, it is classified into Smart card readers, Ticket validators, Ticketing mobile terminals, Request trackers, Ticketing machines / smart ticketing kiosks, and E-toll. The smart ticketing market is segmented based on connectivity into RFID, Barcode, Near-field Communication (NFC), Cellular network, and Wi-Fi. The smart ticketing market is segmented by end use into Transportation, Parking, Sports & entertainment, and Others. Regionally, the smart ticketing industry is classified into North America, Latin America, Western Europe, Eastern Europe, Balkan & Baltic Countries, Russia & Belarus, Central Asia, East Asia, South Asia & Pacific, and the Middle East & Africa.
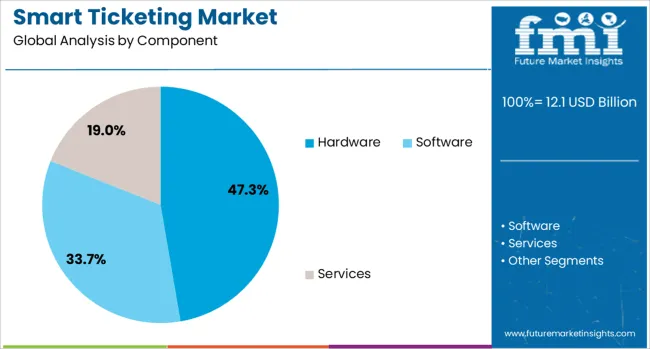
The hardware component segment is projected to contribute 47.3% of the Smart Ticketing market revenue share in 2025, making it the leading component segment. This leadership is being attributed to the continued reliance on physical devices required for issuing and validating tickets, as detailed in product announcements and transit authority updates.
Hardware solutions such as validators, gates, and kiosks have been widely deployed owing to their durability, reliability, and compatibility with various software platforms. Transportation operators have favored hardware investments because of their ability to withstand high-traffic environments while maintaining accurate data capture.
Industry publications and corporate updates have emphasized that the hardware segment remains essential for supporting both legacy and modern ticketing systems, especially in regions where digital-only solutions have not yet achieved full penetration. The segment’s growth has also been supported by ongoing upgrades to accommodate contactless cards and mobile payments, reinforcing its prominence in the market.
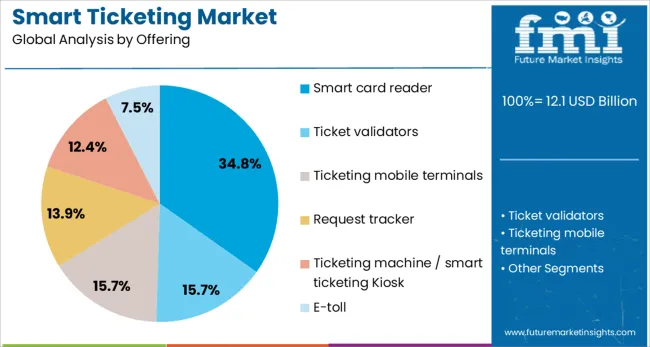
The smart card reader offering segment is anticipated to hold 34.8% of the Smart Ticketing market revenue share in 2025, establishing itself as the leading offering segment. This dominance has been shaped by increased adoption of contactless smart cards across public transportation and access control systems, as reported in corporate communications and transport authority publications.
Smart card readers have been preferred because of their proven efficiency, speed, and ability to integrate seamlessly with existing fare collection infrastructure. Technology announcements have highlighted enhancements in reader technology that improve authentication times and enhance user experiences, further driving their deployment.
The segment’s growth has also been influenced by regulatory requirements for secure, tamper-resistant fare collection systems, which smart card readers have effectively addressed. Additionally, their widespread compatibility with a range of card technologies and ability to support multi-application environments have solidified their position as a critical component of smart ticketing systems globally.
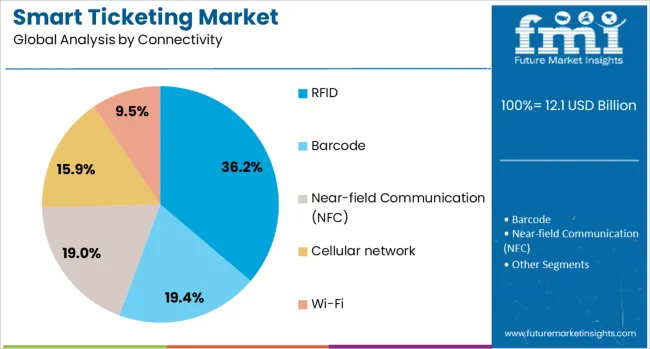
The RFID connectivity segment is forecasted to account for 36.2% of the Smart Ticketing market revenue share in 2025, maintaining its role as the leading connectivity segment. This prominence has been driven by the superior efficiency and reliability of RFID technology in enabling quick, contactless transactions, as noted in press releases and transit agency presentations.
RFID has been widely deployed because it minimizes physical wear and tear, improves throughput at gates, and supports secure authentication without direct line of sight. Industry publications have underscored that RFID connectivity offers enhanced durability and lower maintenance costs compared to magnetic stripe or barcode alternatives, making it an attractive choice for both operators and passengers.
Corporate updates have also emphasized that RFID technology aligns with the growing need for scalable and sustainable ticketing solutions, as it supports high-frequency use while reducing operational bottlenecks. These advantages have strengthened RFID’s position as the preferred connectivity standard in the smart ticketing ecosystem.
Public transit systems captured 62 % of implementations, while contactless solutions were adopted by 23 % of events, stadiums, and airline services. More than 55 % of urban networks globally accept mobile or RFID fare media. Among regular commuters, repeat utilization rates exceeded 68 % due to convenience and integrated loyalty features. Use of mobile payment systems post-COVID-19 pandemic, along with blending of mobility-as-a-service tools with ticketing tools, will propel the global market trends. Moreover, automated fare collection through smart ticketing systems will reduce the operating costs of tickets.
Fare consolidation across transit modes such as buses, trains, shared bikes, and ride-hailing applications was prioritized by operators, with 38 % of new projects in 2024 involving city-wide wallet-based systems. NFC-based ticketing platforms linked to loyalty programs were embedded in 19 % of deployments targeting stadiums and events. Transit agencies have pushed for retail integration to upsell seasonal passes through ticket apps. Consumer comfort with mobile payments and digital wallets has exceeded 70 % in urban centers, making smart ticketing a logical extension of everyday expenditure behavior.
Integration with older fare collection technologies has slowed rollouts, as nearly 60 % of systems still rely on legacy validators incompatible with account-based models. Data protection and encryption requirements raised compliance costs by approximately 12 % in regulated markets, creating procurement delays. Fragmented standards across municipalities have hindered interoperability and stalled vendor consolidation in 25 % of bidding processes. Public pushback regarding location tracking in NFC-enabled apps emerged in several regions, contributing to a 5 % decline in user opt-ins for trip history features.
Cross-platform ticketing solutions have expanded revenue opportunities, enabling integrated use cases such as parking, tolling, and retail point-of-sale with transport apps. Fare bundling with loyalty schemes increased travel frequency by 10 % in pilot cities. Contactless access features were integrated in nearly 27 % of public and private venue rollouts during global major event trials. Expansion into closed-loop transit cards offering stored-value payment options has unlocked regional market entry potential where bank penetration remains limited. Personalized fare packages based on commuter patterns helped raise average monthly ticket spend by 8 %.
Mobile-ticket interfaces with barcode or NFC presentation were used in 57 % of greenfield transit program launches in 2024. Account-based ticketing systems issued 43 % of transit cards, enabling remote fare validity checks. Real-time occupancy and travel pattern analytics have been layered into ticketing systems to allow dynamic fare pricing and surge travel alerts. Multi-modal journey planning features were included in 48 % of ticketing platforms, allowing seamless transfers across bus, rail, and micromobility services within a single interface. In-app ticket validation through smartphone sensors and RFID devices continues to replace paper checks in dense urban networks.
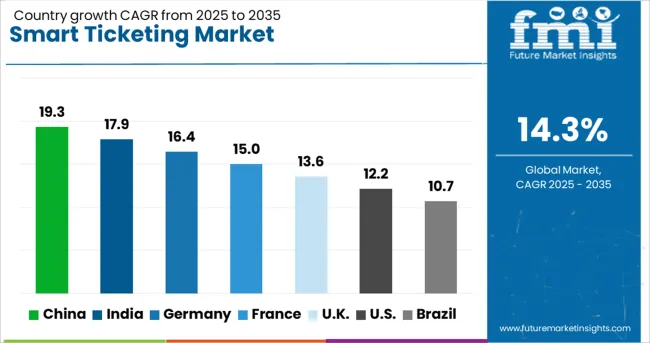
| Country | CAGR |
|---|---|
| China | 19.3% |
| India | 17.9% |
| Germany | 16.4% |
| France | 15.0% |
| UK | 13.6% |
| USA | 12.2% |
| Brazil | 10.7% |
The global smart ticketing market is forecast to grow at a CAGR of 14.3% from 2025 to 2035. China leads at 19.3%, exceeding the global rate by 5%, supported by full-scale digital transit integration and mobile-first ticketing adoption. India follows at 17.9%, 3.6% above the global average, as metro expansions and smartphone penetration drive system upgrades. Germany (OECD) registers 16.4%, outperforming by 2.1%, with consistent rollouts across regional rail. The United Kingdom (OECD) posts 13.6%, just below the benchmark, where national interoperability remains in progress. The United States (OECD) lags at 12.2%, trailing by 2.1%, impacted by state-level fragmentation. Across ASEAN, countries such as Thailand and Singapore are scaling above 15% with QR-enabled transit platforms and cashless mobility ecosystems.
China held 19.3% of the global smart ticketing market share in 2025. Deployment of contactless transit infrastructure has progressed across Tier 1 and Tier 2 cities, integrating QR code and NFC-based ticketing systems. Government digital mobility initiatives and public-private collaborations with firms like Alibaba and Tencent have scaled ticketless entry formats. Biometric-enabled fare gates and facial recognition pilots have also gained momentum. Urban transit platforms have transitioned toward multi-modal and seamless payment ecosystems in over 40 metropolitan areas.
India accounted for 17.9% of the global smart ticketing market in 2025. Unified Payments Interface (UPI)-linked QR systems and NFC-enabled smartcards have been adopted across 30+ transit networks. National Common Mobility Card (NCMC) penetration has increased, supported by policy-driven digitization. Real-time validation infrastructure has been established across metro corridors in Delhi, Nagpur, Kochi, and Ahmedabad. Transit digitization has been reinforced by consumer familiarity with mobile wallets and low-cost smartphones.
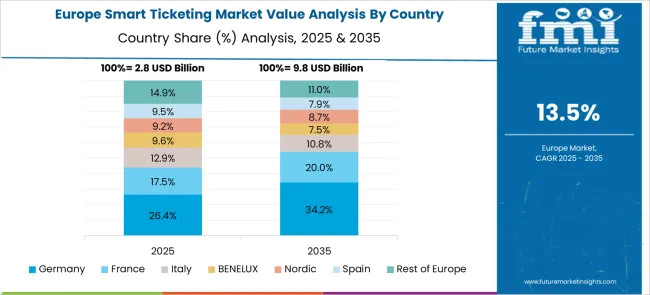
Germany held 16.4% of the global market share in 2025. Nationwide adoption of account-based ticketing (ABT) has progressed across rail, tram, and regional bus systems. Cross-platform interoperability has been promoted through the European Interoperability Framework. Real-time payment processing and mobile-based validation have been widely adopted by operators, including Deutsche Bahn and HVV. Smart ticketing has also been integrated into national climate-focused mobility incentives.
The United Kingdom captured 13.6% of the global smart ticketing market in 2025. Fare capping and contactless mobile integration have been scaled through partnerships between Transport for London (TfL), National Rail, and regional transport authorities. Tap-in/tap-out models using smartphones and contactless bank cards have been implemented in most urban systems. Hybrid ABT architectures have supported unified pricing across transport modes.
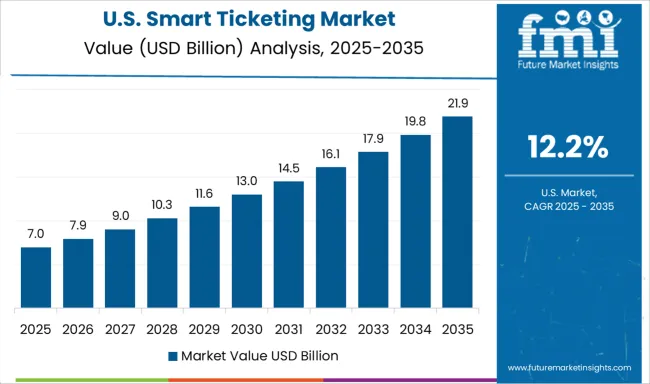
The United States held 12.2% of the smart ticketing market in 2025. NFC, barcode-based, and mobile wallet-integrated ticketing systems have been deployed across more than 40 metropolitan transit agencies. Cities such as New York, Chicago, and San Francisco transitioned to account-based frameworks that support dynamic pricing and fare capping. Magnetic stripe systems have been phased out in favor of digital platforms compatible with Apple Pay, Google Pay, and proprietary apps.
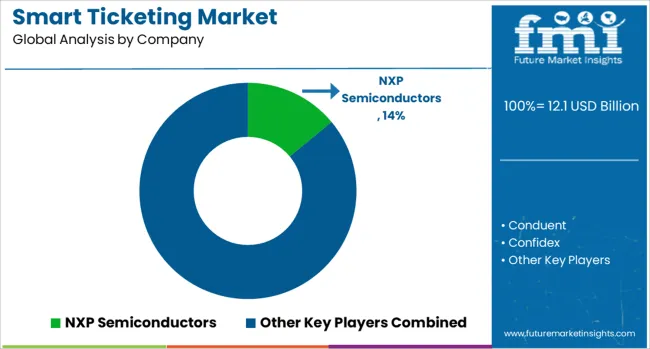
The market involves companies specializing in secure semiconductors, fare systems, and digital credentialing. NXP Semiconductors dominates the contactless card space through its MIFARE product line, embedded in urban transit cards across global cities. Infineon Technologies promotes CIPURSE-compatible modules through the SECORA platform to support secure, standardized fare media.
Thales Group provides modular platforms for mobility authorities, managing identity and access through its software and card issuance systems. Siemens supports integrated fare operations via automated validators and centralized software. Cubic Corporation remains a critical supplier for open-loop fare structures in New York and London, driving large-scale deployments. Conduent delivers cloud-native back-office fare processing tools, emphasizing fare reconciliation, real-time journey tracking, and user account management.
Confidex focuses on fare media manufacturing using RFID-enabled tickets and cards, addressing public transport and event access needs. CPI Card Group offers contactless card solutions for metro networks and closed-loop ticketing programs. HID Global delivers smart access technologies tailored to municipal transit systems, while Giesecke + Devrient develops secure EMV ticketing products for smart mobility cards.
Partnerships with transit authorities, interoperability between regions, and ability to support phased rollouts define competitive edge. Companies with hardware-software integration capabilities continue to gain advantage over those offering standalone components or isolated solutions for fare collection.
The industry is being shaped by advancements in contactless technologies and mobile integrations. NFC-enabled smartphones, QR code systems, and biometric authentication are being adopted by transit authorities to streamline fare collection and reduce queue times. Governments in Asia and Europe have increased investments in open-loop payment systems, allowing bank cards and digital wallets to be used across public transport.
Companies such as Cubic Corporation and Indra Sistemas are expanding multi-modal ticketing platforms with real-time analytics. Integration with mobility-as-a-service (MaaS) applications is also gaining traction, particularly in urban and intercity travel. These developments are reshaping the ticketing landscape.
| Item | Value |
|---|---|
| Quantitative Units | USD 12.1 Billion |
| Component | Hardware, Software, and Services |
| Offering | Smart card reader, Ticket validators, Ticketing mobile terminals, Request tracker, Ticketing machine / smart ticketing Kiosk, and E-toll |
| Connectivity | RFID, Barcode, Near-field Communication (NFC), Cellular network, and Wi-Fi |
| End Use | Transportation, Parking, Sports & entertainment, and Others |
| Regions Covered | North America, Europe, Asia-Pacific, Latin America, Middle East & Africa |
| Country Covered | United States, Canada, Germany, France, United Kingdom, China, Japan, India, Brazil, South Africa |
| Key Companies Profiled | NXP Semiconductors, Conduent, Confidex, CPI Card Group, Cubic Corporation, Giesecke + Devrient, HID Global (Assa Abloy), Infineon Technologies, Siemens, and Thales Group (formerly Gemalto) |
| Additional Attributes | Dollar sales by technology (RFID, NFC, QR/barcode, mobile apps) and application (public transport, events and venues, airlines), demand across smart cities transit, mass gatherings, and travel services, regional trends led by Asia‑Pacific with North America catching up, innovation in contactless mobile integration, multimodal ticketing platforms, tokenization and blockchain-based validation, and environmental impact via paperless ticketing, reduced physical passes, and integration into sustainable urban transport ecosystems. |
The global smart ticketing market is estimated to be valued at USD 12.1 billion in 2025.
The market size for the smart ticketing market is projected to reach USD 46.1 billion by 2035.
The smart ticketing market is expected to grow at a 14.3% CAGR between 2025 and 2035.
The key product types in smart ticketing market are hardware, software and services.
In terms of offering, smart card reader segment to command 34.8% share in the smart ticketing market in 2025.


Our Research Products

The "Full Research Suite" delivers actionable market intel, deep dives on markets or technologies, so clients act faster, cut risk, and unlock growth.

The Leaderboard benchmarks and ranks top vendors, classifying them as Established Leaders, Leading Challengers, or Disruptors & Challengers.

Locates where complements amplify value and substitutes erode it, forecasting net impact by horizon

We deliver granular, decision-grade intel: market sizing, 5-year forecasts, pricing, adoption, usage, revenue, and operational KPIs—plus competitor tracking, regulation, and value chains—across 60 countries broadly.

Spot the shifts before they hit your P&L. We track inflection points, adoption curves, pricing moves, and ecosystem plays to show where demand is heading, why it is changing, and what to do next across high-growth markets and disruptive tech

Real-time reads of user behavior. We track shifting priorities, perceptions of today’s and next-gen services, and provider experience, then pace how fast tech moves from trial to adoption, blending buyer, consumer, and channel inputs with social signals (#WhySwitch, #UX).

Partner with our analyst team to build a custom report designed around your business priorities. From analysing market trends to assessing competitors or crafting bespoke datasets, we tailor insights to your needs.
Supplier Intelligence
Discovery & Profiling
Capacity & Footprint
Performance & Risk
Compliance & Governance
Commercial Readiness
Who Supplies Whom
Scorecards & Shortlists
Playbooks & Docs
Category Intelligence
Definition & Scope
Demand & Use Cases
Cost Drivers
Market Structure
Supply Chain Map
Trade & Policy
Operating Norms
Deliverables
Buyer Intelligence
Account Basics
Spend & Scope
Procurement Model
Vendor Requirements
Terms & Policies
Entry Strategy
Pain Points & Triggers
Outputs
Pricing Analysis
Benchmarks
Trends
Should-Cost
Indexation
Landed Cost
Commercial Terms
Deliverables
Brand Analysis
Positioning & Value Prop
Share & Presence
Customer Evidence
Go-to-Market
Digital & Reputation
Compliance & Trust
KPIs & Gaps
Outputs
Full Research Suite comprises of:
Market outlook & trends analysis
Interviews & case studies
Strategic recommendations
Vendor profiles & capabilities analysis
5-year forecasts
8 regions and 60+ country-level data splits
Market segment data splits
12 months of continuous data updates
DELIVERED AS:
PDF EXCEL ONLINE
Smart Meeting Pod Market Size and Share Forecast Outlook 2025 to 2035
Smart Electrogastrogram Recorder Market Size and Share Forecast Outlook 2025 to 2035
Smart Aerial Work Robots Market Size and Share Forecast Outlook 2025 to 2035
Smart Bladder Scanner Market Size and Share Forecast Outlook 2025 to 2035
Smart School Bus Platform Market Size and Share Forecast Outlook 2025 to 2035
Smart Home Wireless Smoke Detector Market Size and Share Forecast Outlook 2025 to 2035
Smart Bus Platform Market Size and Share Forecast Outlook 2025 to 2035
Smart Vision Processing Chips Market Size and Share Forecast Outlook 2025 to 2035
Smart Touch Screen Scale Market Size and Share Forecast Outlook 2025 to 2035
Smart Magnetic Drive Conveyor System Market Size and Share Forecast Outlook 2025 to 2035
Smart Wheelchair market Size and Share Forecast Outlook 2025 to 2035
Smart Mining Technologies Market Size and Share Forecast Outlook 2025 to 2035
Smart Parking Market Size and Share Forecast Outlook 2025 to 2035
Smart Digital Valve Positioner Market Forecast and Outlook 2025 to 2035
Smart Card IC Market Size and Share Forecast Outlook 2025 to 2035
Smart-Tag Inlay Inserters Market Analysis - Size and Share Forecast Outlook 2025 to 2035
Smart TV Market Forecast and Outlook 2025 to 2035
Smart/AI Toy Market Size and Share Forecast Outlook 2025 to 2035
Smart Locks Market Size and Share Forecast Outlook 2025 to 2035
Smart Sprinkler Controller Market Size and Share Forecast Outlook 2025 to 2035

Thank you!
You will receive an email from our Business Development Manager. Please be sure to check your SPAM/JUNK folder too.
Chat With
MaRIA