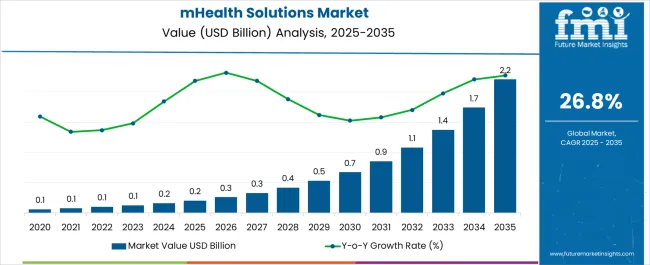
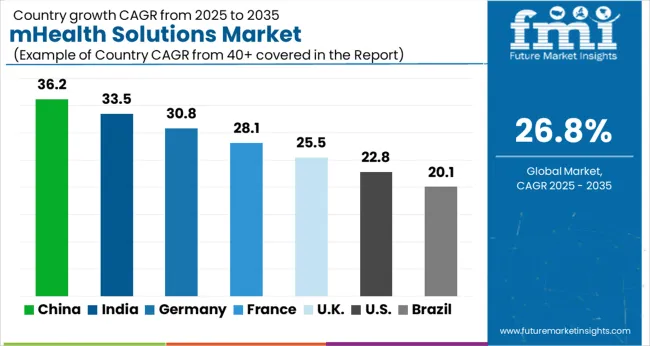
The mHealth Solutions Market is estimated to be valued at USD 0.2 billion in 2025 and is projected to reach USD 2.2 billion by 2035, registering a compound annual growth rate (CAGR) of 26.8% over the forecast period.
The mHealth solutions market operates within a fragmented global regulatory landscape where divergent approaches to digital health governance create distinct operational challenges and opportunities across different jurisdictions. Unlike traditional healthcare sectors with established international standards, mHealth regulation reflects national priorities around data sovereignty, patient safety, and healthcare system integration, producing market segmentation that influences product development strategies and competitive dynamics.
Current regulatory frameworks demonstrate fundamental philosophical divisions between markets that emphasize innovation facilitation versus those prioritizing precautionary oversight. The United States pioneered risk-based classification systems that distinguish between wellness applications and medical device software, creating clearer pathways for market entry while maintaining safety oversight for higher-risk applications. This approach enables rapid market development but requires sophisticated compliance strategies as companies navigate multiple regulatory tiers based on product functionality and clinical claims.
European markets operate under comprehensive data protection regimes that impose stringent consent requirements, cross-border data transfer restrictions, and extensive documentation obligations that can complicate multi-country deployment strategies. The General Data Protection Regulation creates uniform privacy standards across EU territories but lacks specific mHealth guidance, forcing companies to interpret generic data protection principles within healthcare contexts. This regulatory uncertainty increases development costs and extends market entry timelines as companies invest in legal compliance infrastructure.
Asian markets present complex regulatory environments where rapid digital health adoption encounters evolving oversight frameworks. China maintains dual regulatory tracks that encourage domestic mHealth innovation while imposing strict data localization requirements and content monitoring obligations. Chinese healthcare apps must navigate personal information protection laws, cybersecurity classified protection systems, and medical device regulations that can restrict functionality or require extensive clinical validation depending on diagnostic capabilities.
Manufacturing and deployment strategies reflect these regulatory divisions as companies establish region-specific development programs to accommodate different compliance requirements. European operations require extensive privacy impact assessments, data protection officer appointments, and cross-border data transfer mechanisms that increase operational complexity. Asian deployments often require local partnerships, data residency arrangements, and content adaptation to satisfy cultural and regulatory expectations.
Healthcare provider integration presents varying challenges across regulatory environments as different markets impose distinct requirements for clinical validation, interoperability standards, and professional liability frameworks. United States markets generally allow broader healthcare professional autonomy in selecting and recommending mHealth solutions, creating market opportunities for direct-to-provider sales strategies. European markets increasingly require formal clinical evaluation processes that can extend adoption timelines but provide stronger reimbursement pathways once established.

| Metric | Value |
|---|---|
| mHealth Solutions Market Estimated Value in (2025 E) | USD 0.2 billion |
| mHealth Solutions Market Forecast Value in (2035 F) | USD 2.2 billion |
| Forecast CAGR (2025 to 2035) | 26.8% |
The mHealth solutions market is expanding steadily due to the rising adoption of mobile health applications, wearable technologies, and remote patient monitoring systems. Growing smartphone penetration, coupled with increasing internet connectivity, has enabled real time access to health services and data driven decision making.
Healthcare systems are increasingly embracing mHealth to reduce hospital visits, enhance patient engagement, and improve chronic disease management. Regulatory encouragement for digital health adoption, along with the integration of artificial intelligence and data analytics, is accelerating innovation in this field.
The outlook remains positive as healthcare providers, payers, and technology companies collaborate to deliver scalable and cost effective digital health solutions that enhance accessibility and improve patient outcomes across both developed and emerging markets.
The mHealth devices segment is expected to account for 41.70% of total revenue by 2025 within the product and service category, making it the leading contributor. Growth in this segment is being driven by increasing demand for wearable technologies such as fitness trackers, smartwatches, and connected medical devices.
These devices provide continuous monitoring of health parameters, enabling proactive healthcare management and early diagnosis of potential conditions. The integration of Bluetooth and cloud based connectivity further supports real time data transfer to physicians and healthcare systems.
As consumers become more health conscious and healthcare providers adopt remote monitoring practices, mHealth devices are projected to remain the dominant product and service segment.
The mHealth solutions for physicians segment is anticipated to account for 44.20% of total revenue by 2025 within the end user category, positioning it as the most prominent segment. Physicians are increasingly adopting mobile platforms to access patient data, conduct virtual consultations, and prescribe treatments remotely.
The ability to streamline clinical workflows, improve patient communication, and enhance diagnostic accuracy has strengthened demand among healthcare professionals. Furthermore, mHealth platforms provide physicians with decision support tools, integration with electronic health records, and secure communication channels, all of which improve care delivery.
These benefits have established physicians as the leading end user group in the mHealth solutions market.
There is a considerable increase in the use of mobile devices around the world due to digitization becoming a crucial trend followed globally. Moreover, the demand for mobile healthcare solutions is increasing the use of smartphones as well as other mobile devices. Demand for mHealth systems increased and captured an impressive CAGR of 24.6% between 2020 and 2024.
Patient data sharing and storing, quick access to healthcare-related information, and use for distant consultation are different applications of mHealth systems which increase the demand for these systems and consequently fuel the mHealth systems market growth.
Factors that are estimated to bolster the growth of the mHealth solutions market through 2035 include the presence of digital health infrastructure, rising prevalence of chronic diseases, introduction of novel and innovative technologies, increasing focus on patient-centric healthcare, growing use of connected devices, and increasing penetration of mobile devices.
| Year | Valuation |
|---|---|
| 2020 | USD 26,401.6 million |
| 2024 | USD 80,312.6 million |
| 2025 | USD 101,186.1 million |
| 2025 | USD 127,865.0 million |
| 2035 | USD 2.2 million |
FMI anticipates that the market valuation could reach USD USD 2.2 million by 2035.
| Market Statistics | Details |
|---|---|
| H1,2024 (A) | 26.0% |
| H1,2025 Projected (P) | 25.8% |
| H1,2025 Outlook (O) | 26.5% |
| BPS Change : H1,2025 (O) - H1,2025 (P) | (+) 70 ↑ |
| BPS Change : H1,2025 (O) - H1,2024 (A) | (+) 45 ↑ |
According to FMI analysis, the variation between the BPS values observed in the mHealth solutions market in H1, 2025 (O) - Outlook over H1, 2025 (P) Projected reflects a spike of 70 units.
Increasing usage of digital healthcare services for the monitoring of remote patient monitoring, which in turn is likely to bolster the market expansion over the forthcoming years. Furthermore, compared to H1, 2024 (A), the market is expected to spike by 45 BPS in H1 -2025 (O).
Among other regions, the North America market is predicted to be a fruitful market over the projection period for mHealth service providers. These regions are expected to record significant growth due to the increase in mHealth start-ups and the presence of the leading mHealth solutions market players.
Europe is projected to get a lucrative setting for mHealth solutions due to the increasing focus on the health management of the population. A few key factors that are estimated to enhance the mHealth solution market growth through 2024 are the prevalence of chronic diseases, high healthcare spending potential, the presence of developed healthcare infrastructure, and the growing consciousness for patient monitoring.
East Asia is another prominent region that is projected to witness significant growth due to crucial trends such as the growing elderly population, increasing healthcare expenditure, and rising digitization. This region is also anticipated to offer highly lucrative growth opportunities for mHealth solution providers during the estimation period. Moreover, over the projection period through 2035, China and Japan are also projected to be the most significant markets in East Asia.
| Region | North America |
|---|---|
| CAGR 2025 | 17.6% |
| CAGR 2035 | 16.5% |
| Market Size - 2025 | USD 30,059.0 million |
| Market Size - 2035 | USD 88,942.4 million |
| Region | Europe |
|---|---|
| CAGR 2025 | 20.5.% |
| CAGR 2035 | 21.1% |
| Market Size - 2025 | USD 23,079.7 million |
| Market Size - 2035 | USD 86,392.2 million |

Growing Technological Production in Healthcare to Fuel Growth in Japan
Japan is regarded as the most technologically advanced nation. Such technological development becomes a part of its healthcare infrastructure too. Increasing use of technology in healthcare services is projected to offer lucrative opportunities in Japan for mHealth solution providers. Moreover, the growing demand for patient monitoring and the increasing elderly population are the key trends that are going to influence the potential of the mHealth solutions market.
In Japan, Pocket ECGs, mHealth heart monitors, and other mHealth devices are expected to witness increasing sales over the years to come. Moreover, the growing adoption of mHealth apps by many healthcare providers and patients in Japan may boost the market in Japan.

Favorable Government Policies to Increase Revenue Generation in the United States
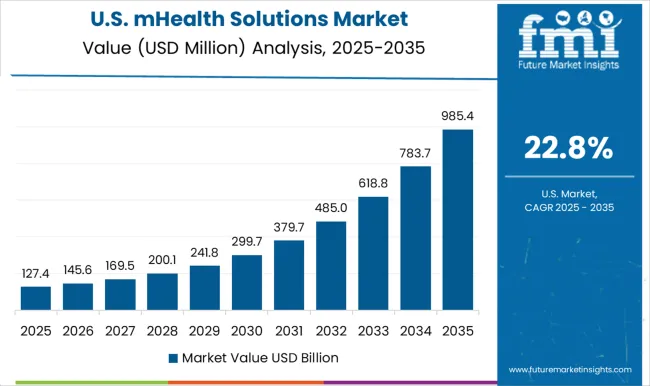
The mHealth solutions market in the United States is predicted to be notably lucrative due to the favorable government initiatives to introduce new healthcare technologies as well as the presence of developed healthcare infrastructure. Moreover, there are a few other important factors that are estimated to boost the mHealth solution market potential, which include a focus on patient engagement, growing consciousness among patients, and favorable reimbursement policies.
An increase in the use of patient monitoring devices and a growing elderly population are also anticipated to enhance the United States mHealth solutions market potential during the forecast period.
Hospitals Segment to record significant mHealth Solutions Market Share
Increasing investments are made in hospitals to improvising their infrastructure and provide the best healthcare services to patients. Mobile health solutions are estimated to record high deployment in hospitals due to increasing focus on patient engagement.
Increasing efforts to make healthcare accessible to all are anticipated to increase the adoption of electronic health record solutions, population health management solutions, and other mHealth systems to facilitate better healthcare services.
| Segments | Market Size - 2025 |
|---|---|
| Hospitals | USD 48,002.3 million |
Increasing Focus on Patient Engagement to Enhance Industry Potential
Patient monitoring has a significant role in the treatment of many types of health conditions and henceforth, the demand for it has considerably increased on a global scale. Patient monitoring application dominates the mHealth solutions market growth in terms of application and is estimated to grow significantly over the coming years.
Real-time monitoring and preparing an efficient treatment plan for the patient become easy with mobile health solutions. The unprecedented epidemic of coronavirus infections in 2024 led to a global health emergency and transformed the way healthcare was approached in the modern world. Detection of CVOID-19 cases was a key challenge for healthcare institutions across the world and this was even worse in asymptomatic cases which were tough to identify.
These factors greatly contributed toward the adoption of mHealth systems across the world as they allow remote monitoring of alleged individuals. Mobile health solutions can also improve healthcare services by enabling early diagnosis, risk profiling, etc. An Increase in the deployment of digital solutions in healthcare has led to a productive backdrop for mHealth solutions market growth and this is anticipated to drive potential across the forecast period.
| Segment | Market Size - 2025 |
|---|---|
| Patient Monitoring | USD 42,285.5 million |

The mHealth Solutions Market is expanding rapidly, driven by increasing smartphone penetration, growing prevalence of chronic diseases, and the global shift toward digital and remote healthcare management. mHealth (mobile health) solutions leverage mobile devices, wearable sensors, and cloud-based applications to support patient monitoring, diagnosis, and treatment adherence. The market’s growth is fueled by the rise in telemedicine adoption, demand for real-time health analytics, and the integration of AI and IoT technologies into patient care ecosystems.
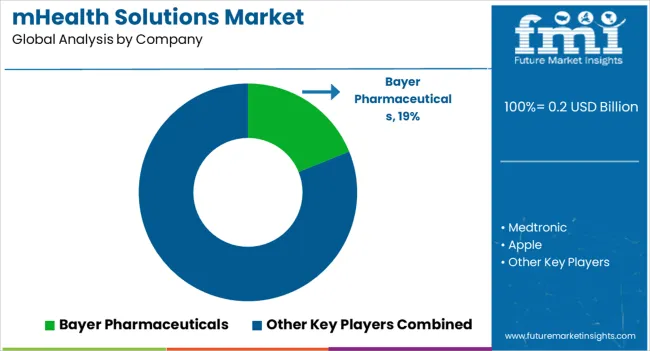
Leading players such as Bayer Pharmaceuticals, Medtronic plc, and Apple Inc. are at the forefront of innovation in connected health technologies. Bayer Pharmaceuticals focuses on mobile platforms for chronic disease management and digital therapeutics, enhancing patient engagement through data-driven insights. Medtronic develops mobile-enabled cardiac monitoring and diabetes management solutions, while Apple Inc. continues to expand its HealthKit ecosystem with features like ECG monitoring and personalized health tracking through Apple Watch.
AirStrip Technologies Inc. and AliveCor Inc. specialize in real-time mobile ECG monitoring and clinical data visualization tools for physicians. BioTelemetry Inc. and LifeWatch Services Inc. (now part of Koninklijke Philips N.V.) contribute to remote cardiac diagnostics and long-term patient monitoring platforms. Athenahealth Inc. and Cerner Corporation integrate mHealth apps into electronic health record (EHR) systems, improving data interoperability and patient-provider communication.
Omron Healthcare Inc., iHealth Labs Inc., and AgaMatrix Inc. lead the personal health device segment, offering connected blood pressure monitors, glucose meters, and wearable devices linked to mobile apps. Qualcomm Technologies Inc. and AT&T Inc. provide the connectivity backbone for mHealth platforms, enabling seamless data transmission between patients, providers, and cloud servers. Nokia Corporation focuses on consumer-grade connected health devices and analytics solutions through its digital health division.
| Attribute | Details |
|---|---|
| Forecast Period | 2025 to 2035 |
| Historical Data Available for | 2020 to 2024 |
| Market Analysis | USD million for Value |
| Key Regions Covered | North America; Latin America; Europe; East Asia; South Asia & Pacific; The Middle East & Africa (MEA) |
| Key Countries Covered | The United States, Canada, Brazil, Mexico, Germany, The United Kingdom, France, Spain, Italy, China, Japan, South Korea, India, Indonesia, Malaysia, Singapore, Australia, New Zealand, Turkey, South Africa, and GCC Countries |
| Key Market Segments Covered | Product and Service, Application, End User, Region |
| Key Companies Profiled |
Bayer Pharmaceuticals, Medtronic plc, Apple Inc., AirStrip Technologies Inc., AliveCor Inc., BioTelemetry Inc. (now part of Philips), Athenahealth Inc., AgaMatrix Inc., LifeWatch Services Inc. (Philips), Koninklijke Philips N.V., iHealth Labs Inc., AT&T Inc., Omron Healthcare Inc., Qualcomm Technologies Inc., Cerner Corporation, Nokia Corporation |
| Pricing | Available upon Request |
The global mhealth solutions market is estimated to be valued at USD 0.2 billion in 2025.
The market size for the mhealth solutions market is projected to reach USD 2.2 billion by 2035.
The mhealth solutions market is expected to grow at a 26.8% CAGR between 2025 and 2035.
The key product types in mhealth solutions market are mhealth devices, mhealth apps and mhealth services.
In terms of application, mhealth solutions for disease tracking segment to command 38.6% share in the mhealth solutions market in 2025.


Our Research Products

The "Full Research Suite" delivers actionable market intel, deep dives on markets or technologies, so clients act faster, cut risk, and unlock growth.

The Leaderboard benchmarks and ranks top vendors, classifying them as Established Leaders, Leading Challengers, or Disruptors & Challengers.

Locates where complements amplify value and substitutes erode it, forecasting net impact by horizon

We deliver granular, decision-grade intel: market sizing, 5-year forecasts, pricing, adoption, usage, revenue, and operational KPIs—plus competitor tracking, regulation, and value chains—across 60 countries broadly.

Spot the shifts before they hit your P&L. We track inflection points, adoption curves, pricing moves, and ecosystem plays to show where demand is heading, why it is changing, and what to do next across high-growth markets and disruptive tech

Real-time reads of user behavior. We track shifting priorities, perceptions of today’s and next-gen services, and provider experience, then pace how fast tech moves from trial to adoption, blending buyer, consumer, and channel inputs with social signals (#WhySwitch, #UX).

Partner with our analyst team to build a custom report designed around your business priorities. From analysing market trends to assessing competitors or crafting bespoke datasets, we tailor insights to your needs.
Supplier Intelligence
Discovery & Profiling
Capacity & Footprint
Performance & Risk
Compliance & Governance
Commercial Readiness
Who Supplies Whom
Scorecards & Shortlists
Playbooks & Docs
Category Intelligence
Definition & Scope
Demand & Use Cases
Cost Drivers
Market Structure
Supply Chain Map
Trade & Policy
Operating Norms
Deliverables
Buyer Intelligence
Account Basics
Spend & Scope
Procurement Model
Vendor Requirements
Terms & Policies
Entry Strategy
Pain Points & Triggers
Outputs
Pricing Analysis
Benchmarks
Trends
Should-Cost
Indexation
Landed Cost
Commercial Terms
Deliverables
Brand Analysis
Positioning & Value Prop
Share & Presence
Customer Evidence
Go-to-Market
Digital & Reputation
Compliance & Trust
KPIs & Gaps
Outputs
Full Research Suite comprises of:
Market outlook & trends analysis
Interviews & case studies
Strategic recommendations
Vendor profiles & capabilities analysis
5-year forecasts
8 regions and 60+ country-level data splits
Market segment data splits
12 months of continuous data updates
DELIVERED AS:
PDF EXCEL ONLINE
5PL Solutions Market
Long Haul Solutions Market Size and Share Forecast Outlook 2025 to 2035
eClinical Solutions and Software Market Insights - Trends & Forecast 2025 to 2035
E-tailing Solutions Market Growth – Trends & Forecast 2020-2030
Connected Solutions for Oil & Gas Market Insights – Trends & Forecast 2020-2030
Biocontrol Solutions Market Size and Share Forecast Outlook 2025 to 2035
WealthTech Solutions Market Size and Share Forecast Outlook 2025 to 2035
Smart Home Solutions Market Size and Share Forecast Outlook 2025 to 2035
Filter Press Solutions Market Size and Share Forecast Outlook 2025 to 2035
Payment Bank Solutions Market Size and Share Forecast Outlook 2025 to 2035
Aviation IoT Solutions Market
Eye Tracking Solutions Market
Hair Thinning Solutions Market Analysis - Size and Share Forecast Outlook 2025 to 2035
Hormonal Acne Solutions Market Analysis - Size and Share Forecast Outlook 2025 to 2035
Drug Delivery Solutions Market Insights - Growth & Forecast 2025 to 2035
Sensitive Skin Solutions Market Size and Share Forecast Outlook 2025 to 2035
Smart Building Solutions Market Size and Share Forecast Outlook 2025 to 2035
Acne Treatment Solutions Market Size and Share Forecast Outlook 2025 to 2035
Neuromarketing Solutions Market Size and Share Forecast Outlook 2025 to 2035
Cable Cleaning Solutions Market Analysis - Size, Share, and Forecast Outlook 2025 to 2035

Thank you!
You will receive an email from our Business Development Manager. Please be sure to check your SPAM/JUNK folder too.
Chat With
MaRIA